
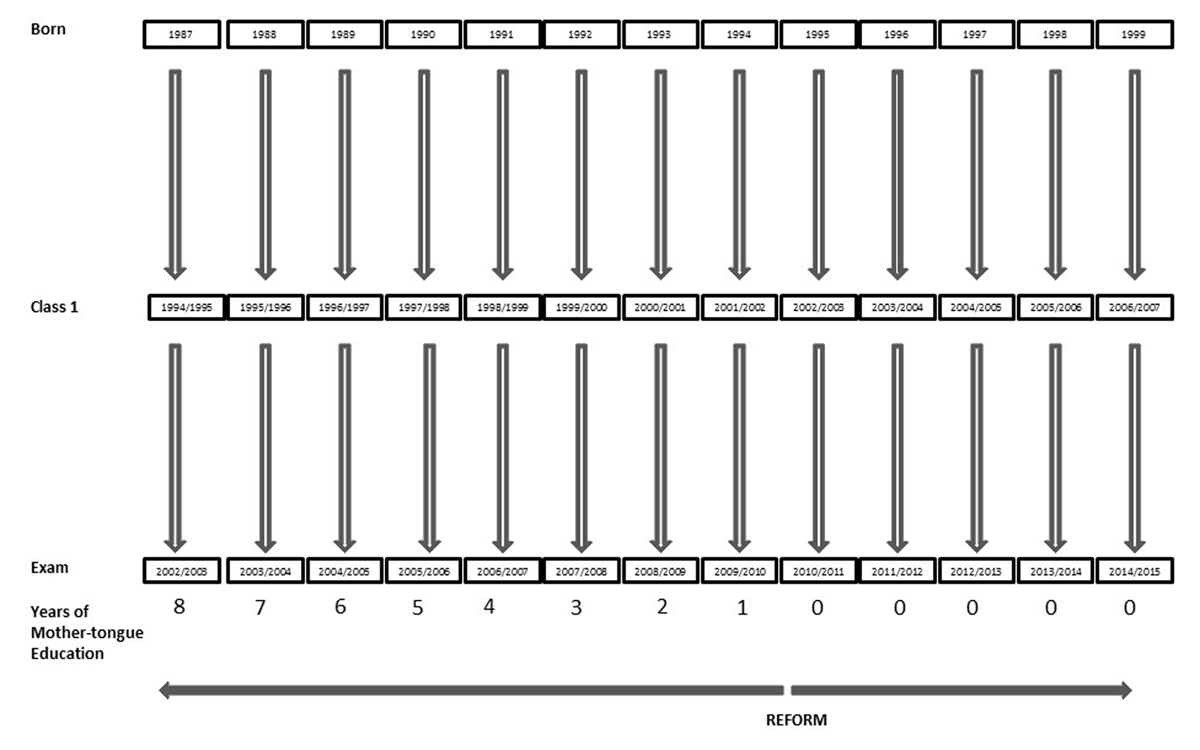
Figure 1
Cohorts included in the study, years of exposure to mother-tongue education in treated municipalities (removing mother-tongue education).
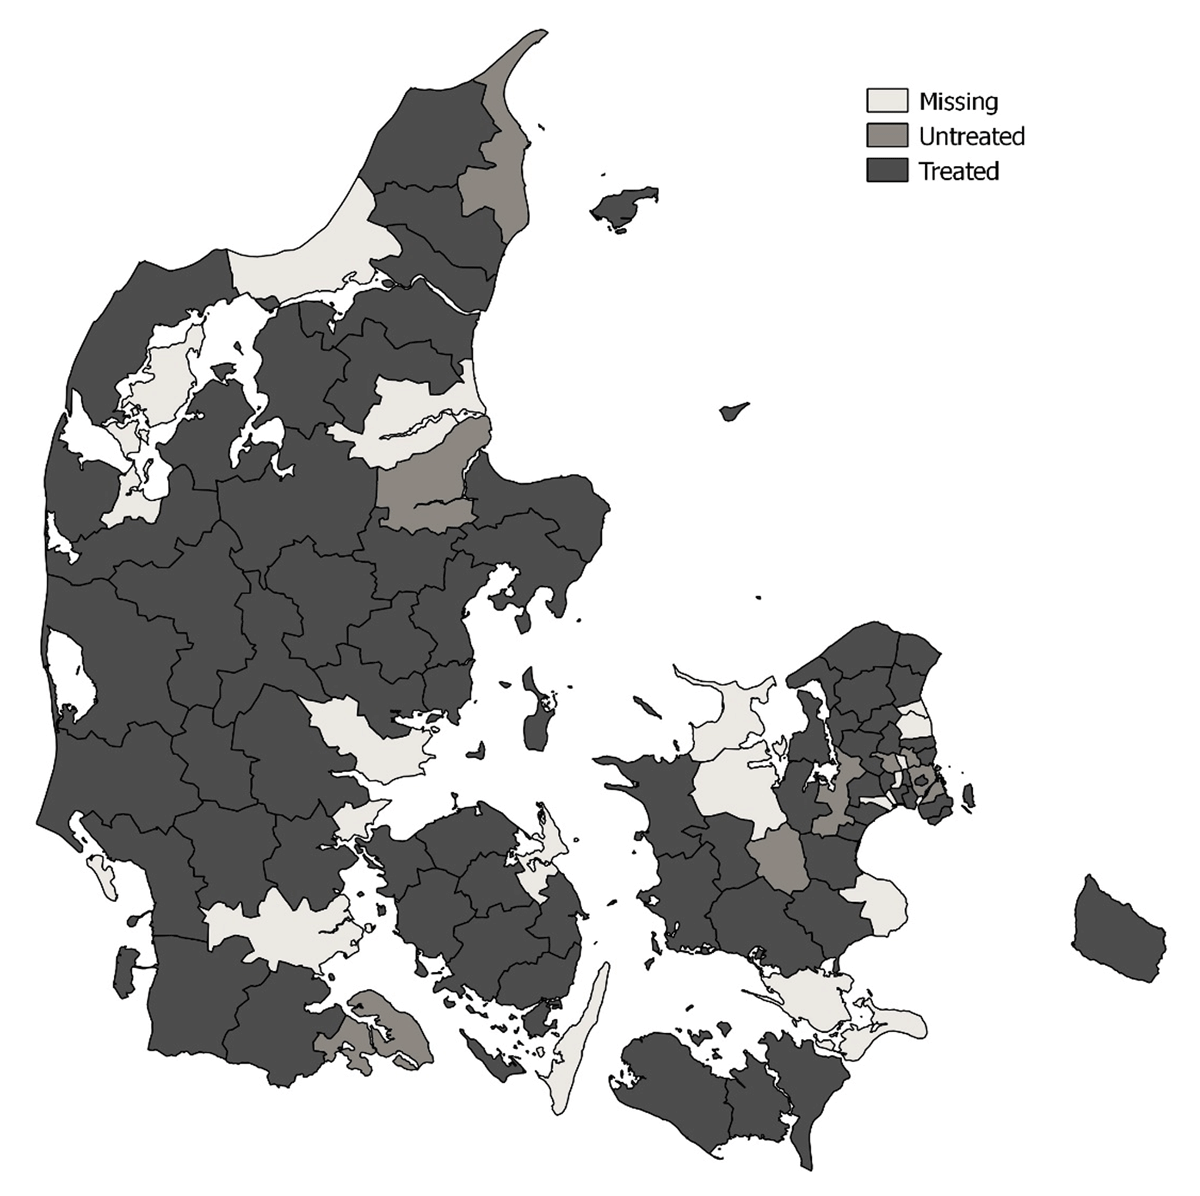
Figure 2
Map of Danish municipalities: treated and untreated Map downloaded with permission from the Danish Geodata Agency.
Table 1
Variable means by gender and immigrant generation of treated municipalities (removing mother-tongue training).
| All | Boys | Girls | First-generation immigrants | Second-generation immigrants | Male first-generation immigrants | Female first-generation immigrants | Male second-generation immigrants | Female second-generation immigrants | |
|---|---|---|---|---|---|---|---|---|---|
| Year | 2009.3 | 2009.3 | 2009.4 | 2008.3 | 2009.9 | 2008.3 | 2008.3 | 2009.9 | 2009.8 |
| Father’s age | 47.6 | 47.6 | 47.6 | 47.8 | 47.4 | 47.7 | 47.9 | 47.5 | 47.4 |
| Mother’s age | 43.1 | 43.1 | 43.1 | 43.0 | 43.1 | 43.0 | 43.0 | 43.2 | 43.1 |
| Father’s education | |||||||||
| Unknown | 10.1 | 10.2 | 10.02 | 9.33 | 10.49 | 9.42 | 9.23 | 10.59 | 10.39 |
| Primary | 28.9 | 28.7 | 29.2 | 23.78 | 31.47 | 23.76 | 23.79 | 31.14 | 31.78 |
| Secondary | 35.8 | 35.8 | 35.71 | 35.53 | 35.88 | 35.16 | 35.91 | 36.16 | 35.62 |
| Tertiary | 25.2 | 25.3 | 25.06 | 31.37 | 22.16 | 31.65 | 31.07 | 22.11 | 22.2 |
| Mother’s education | |||||||||
| Unknown | 8.3 | 8.2 | 8.3 | 8.4 | 8.2 | 8.4 | 8.4 | 8.1 | 8.3 |
| Primary | 37.6 | 37.5 | 37.7 | 35.2 | 38.8 | 35.3 | 35.1 | 38.5 | 39.0 |
| Secondary | 35.0 | 34.9 | 35.1 | 34.6 | 35.2 | 34.6 | 34.5 | 35.1 | 35.4 |
| Tertiary | 19.1 | 19.5 | 18.8 | 21.8 | 17.8 | 21.6 | 22.0 | 18.3 | 17.4 |
| Parents separated | |||||||||
| Yes | 32.5 | 32.0 | 32.9 | 27.5 | 35.0 | 27.0 | 28.0 | 34.7 | 35.4 |
| No | 67.5 | 68.0 | 67.1 | 72.5 | 65.0 | 73.0 | 72.0 | 65.3 | 64.6 |
| Children in family | 2.3 | 2.3 | 2.3 | 2.5 | 2.2 | 2.5 | 2.5 | 2.2 | 2.3 |
| Individuals | 34,045 | 16,839 | 17,206 | 11,213 | 22,832 | 5,668 | 5,545 | 11,171 | 11,661 |
Table 2
Variable means by gender and immigrant generation of untreated municipalities (keeping mother-tongue training).
| All | Boys | Girls | First-generation immigrants | Second-generation immigrants | Male first- generation immigrants | Female first-generation immigrants | Male second-generation immigrants | Female second-generation immigrants | |
|---|---|---|---|---|---|---|---|---|---|
| Year | 2009.3 | 2009.4 | 2009.3 | 2007.7 | 2009.7 | 2007.8 | 2007.6 | 2009.8 | 2009.7 |
| Father’s age | 48.3 | 48.3 | 48.2 | 48.2 | 48.3 | 48.2 | 48.3 | 48.3 | 48.1 |
| Mother’s age | 43.2 | 43.3 | 43.1 | 43.1 | 43.3 | 42.9 | 43.1 | 43.4 | 43.1 |
| Father’s education | |||||||||
| Unknown | 10.2 | 10.2 | 10.3 | 9.7 | 10.4 | 9.6 | 9.7 | 10.4 | 10.4 |
| Primary | 28.0 | 28.2 | 27.9 | 22.2 | 29,6 | 22.4 | 22.0 | 29.8 | 29.4 |
| Secondary | 36.0 | 35.4 | 36.5 | 34.9 | 36.2 | 34.8 | 35.0 | 35.5 | 36.8 |
| Tertiary | 25.8 | 26.2 | 25.4 | 33.2 | 23.8 | 33.2 | 33.3 | 24.3 | 23.4 |
| Mother’s education | |||||||||
| Unknown | 7.7 | 7.9 | 7.4 | 8.7 | 7.4 | 8.7 | 8.7 | 7.7 | 7.1 |
| Primary | 37.5 | 36.9 | 37.1 | 37.1 | 37.6 | 36.2 | 38.0 | 37.1 | 38.0 |
| Secondary | 35.4 | 35.3 | 32.7 | 32.4 | 36.1 | 33.1 | 32.2 | 35.8 | 36.5 |
| Tertiary | 19.4 | 19.9 | 21.5 | 21.8 | 18.9 | 22.0 | 21.1 | 19.4 | 18.4 |
| Parents separated | |||||||||
| Yes | 40.8 | 40.6 | 40.6 | 35.3 | 41.8 | 36.3 | 64.57 | 58.5 | 57.9 |
| No | 59.2 | 59.7 | 59.4 | 64.1 | 58.20 | 63.7 | 35.4 | 41.5 | 42.1 |
| Children in family | 2.2 | 2.1 | 2.2 | 2.2 | 2.2 | 2.2 | 2.2 | 2.1 | 2.2 |
| Individuals | 22,471 | 11,143 | 11,328 | 4,712 | 17,759 | 2,404 | 2,308 | 8,739 | 9,020 |
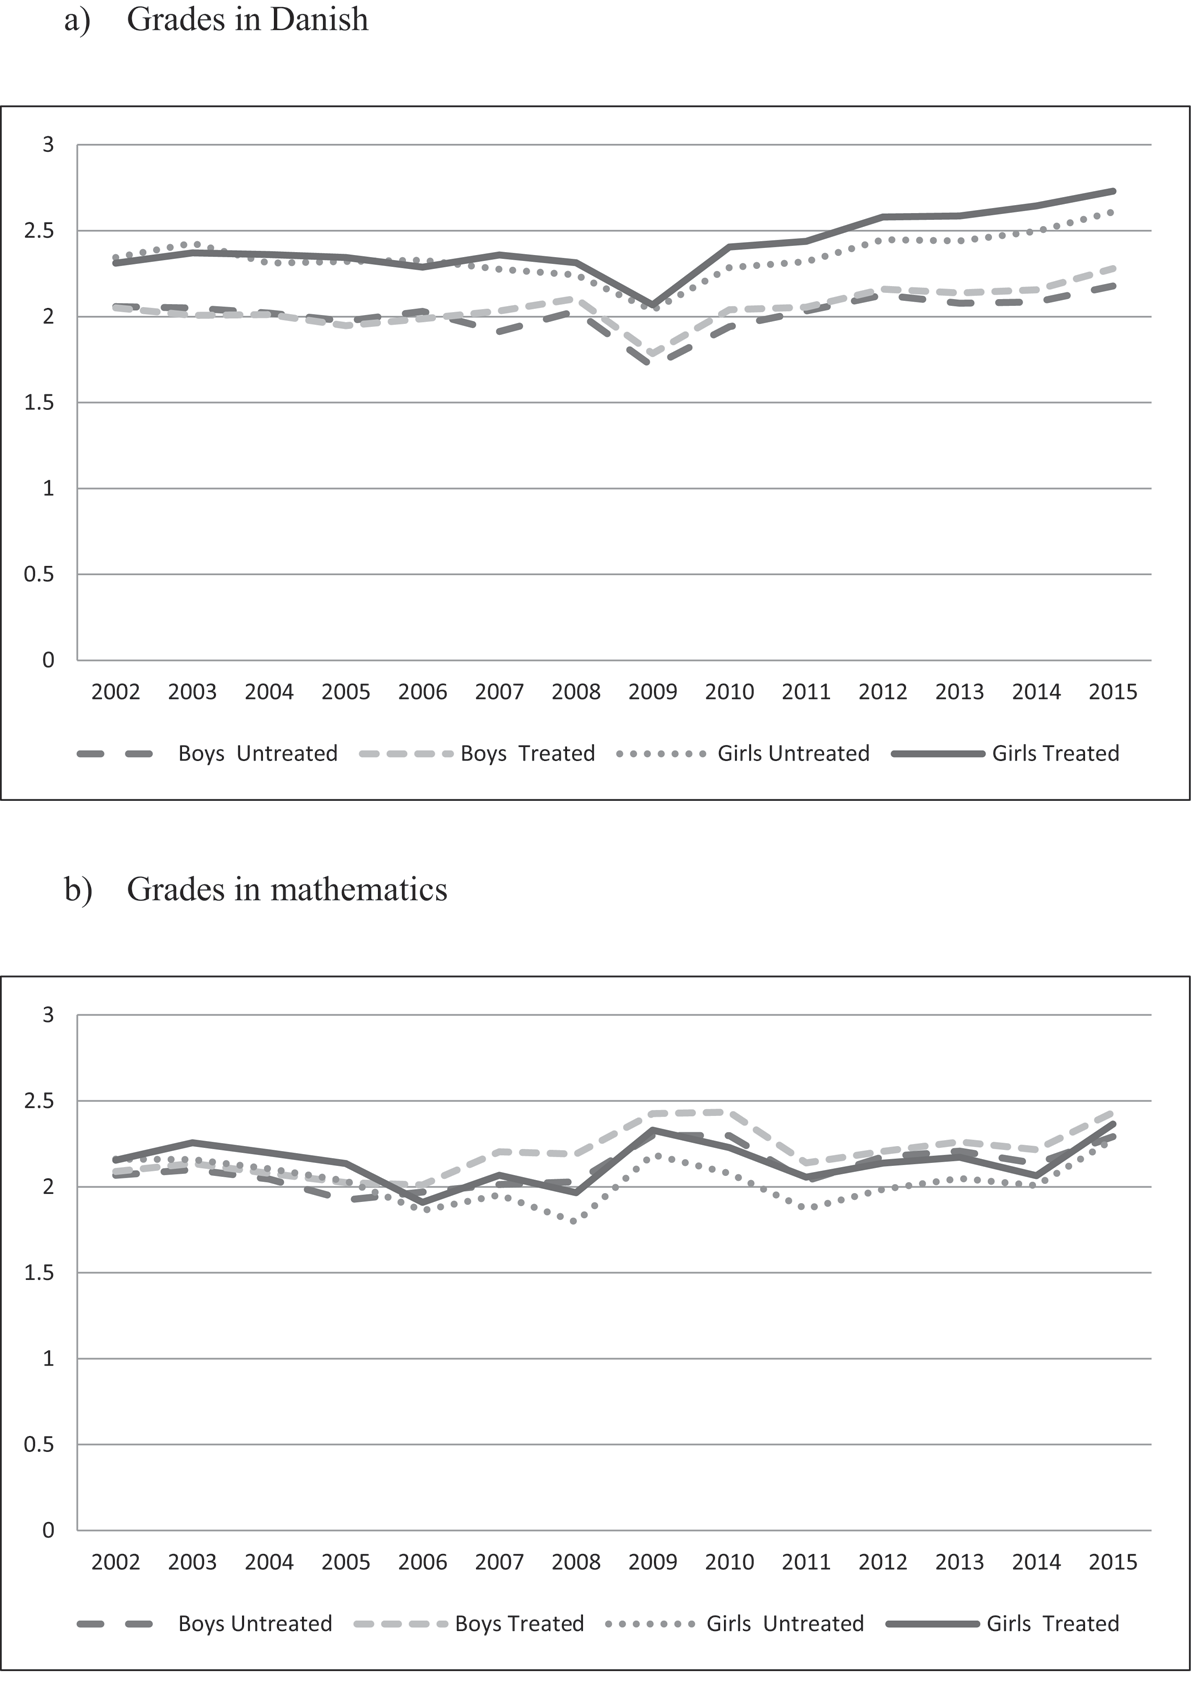
Figure 3
Unstandardised grade differences, treated and untreated municipalities, 2002–2015.12.10
Table 3
Effects of the mother-tongue training reform on standardised grades in Danish for immigrants and the second-generation immigrants from countries outside the EU, the EES, Greenland and the Faroe Islands – full sample.
| (1) | (2) | (3) | (4) | (5) | (6) | (7) | (8) | (9) | |
|---|---|---|---|---|---|---|---|---|---|
| All | Boys | Girls | First-generation immigrants | Second-generation immigrants | Male first-generation immigrants | Female first-generation immigrants | Male second-generation immigrants | Female second-generation immigrants | |
| A. Controlling for municipality and year fixed effects | |||||||||
| Estimate | 0.058*** | 0.032 | 0.086*** | 0.040 | 0.035 | 0.031 | 0.058 | –0.009 | 0.076*** |
| Standard errors | (0.015) | (0.022) | (0.023) | (0.040) | (0.017) | (0.046) | (0.065) | (0.026) | (0.025) |
| B. Controlling for municipality and year fixed effects, and municipality–specific trends | |||||||||
| Estimate | –0.064 | –0.076 | –0.056 | –0.074 | –0.063 | –0.138* | –0.029 | –0.068 | –0.064 |
| Standard errors | (0.046) | (0.047) | (0.060) | (0.047) | (0.055) | (0.071) | (0.075) | (0.057) | (0.065) |
| C. Controlling for municipality and year fixed effects, municipality-specific trends, socio-economic/demographic variables | |||||||||
| Estimate | –0.063 | –0.081* | –0.050 | –0.065† | –0.065 | –0.147** | 0.000 | –0.070 | –0.064 |
| Standard errors | (0.042) | (0.041) | (0.054) | (0.041) | (0.052) | (0.066) | (0.061) | (0.058) | (0.060) |
| Individuals | 56,516 | 27,982 | 28,534 | 15,925 | 40,591 | 8,072 | 7,853 | 19,910 | 20,681 |
Table 4
Effects of the mother-tongue training reform on standardised grades in mathematics for the first- and second-generation immigrants from countries outside the EU, the EES, Greenland and the Faroe Islands – full sample.
| (1) | (2) | (3) | (4) | (5) | (6) | (7) | (8) | (9) | |||||||
|---|---|---|---|---|---|---|---|---|---|---|---|---|---|---|---|
| All | Boys | Girls | First-generation immigrants | Second-generation immigrants | Male first-generation immigrants | Female first-generation immigrants | Male second-generation immigrants | Female second-generation immigrants | |||||||
| A. Controlling for municipality and year fixed effects | |||||||||||||||
| Estimate | –0.027* | –0.034† | –0.021 | –0.077 | –0.039* | –0.007 | –0.138** | –0.069** | –0.014 | ||||||
| Standard errors | (0.013) | (0.020) | (0.021) | (0.041) | (0.022) | (0.053) | (0.061) | (0.031) | (0.024) | ||||||
| B. Controlling for municipality and year fixed effects, and municipality-specific trends | |||||||||||||||
| Estimate | –0.056 | –0.041 | –0.065 | –0.008 | –0.076* | –0.043 | –0.046 | –0.046 | –0.105** | ||||||
| Standard errors | (0.039) | (0.040) | (0.048) | (0.053) | (0.042) | (0.079) | (0.070) | (0.049) | (0.049) | ||||||
| C. Controlling for municipality and year fixed effects, municipality-specific trends, socio-economic/demographic variables | |||||||||||||||
| Estimate | –0.056 | –0.106*** | –0.061 | –0.006 | –0.079** | –0.049 | –0.065 | –0.095** | –0.106** | ||||||
| Standard errors | (0.034) | (0.038) | (0.043) | 0.053 | (0.038) | (0.084) | (0.068) | (0.040) | (0.057) | ||||||
| Individuals | 56,054 | 27,855 | 28,199 | 15,797 | 40,257 | 8,042 | 7,755 | 19,813 | 20,444 | ||||||
Table 5
Effects of the mother-tongue training reform on standardised grades in Danish. Groups based on father’s level of education – full sample.
| (1) | (2) | (3) | (4) | |
|---|---|---|---|---|
| Father’s Education | ||||
| Unknown | Primary | Secondary | Tertiary | |
| A. Controlling for municipality and year fixed effects | ||||
| Estimate | 0.058 | 0.046 | 0.092 | –0.033 |
| Standard errors | (0.047) | (0.039) | (0.022) | (0.041) |
| B. Controlling for municipality and year fixed effects, and municipality-specific trends | ||||
| Estimate | 0.072 | –0.082† | 0.024 | –0.207** |
| Standard errors | (0.112) | (0.049) | (0.041) | (0.066) |
| C. Controlling for municipality and year fixed effects, municipality-specific trends, and socio-economic/demographic variables | ||||
| Estimate | 0.065 | –0.084† | 0.029 | –0.199*** |
| Standard errors | (0.114) | (0.050) | (0.041) | (0.067) |
| Individuals | 5,739 | 16,149 | 20,257 | 14,718 |
[i] Standard errors in parentheses are clustered at the municipality level. Socio-economic variables include parental labour-market participation, parental age, sex, parental separation and the number of children in the family. † p < .1, * p < .05, ** p < .01, *** p < .001 (two-tailed test).
Table 6
Main results. Effects of the mother-tongue training reform on standardised grades in Danish for immigrants and the second-generation immigrants from countries outside the EU and the EES – municipality reform sample.13
| (1) | (2) | (3) | (4) | (5) | (6) | (7) | (8) | (9) | |
|---|---|---|---|---|---|---|---|---|---|
| All | Boys | Girls | First-generation immigrants | Second-generation immigrants | Male first-generation immigrants | Female first-generation immigrants | Male second-generation immigrants | Female second-generation immigrants | |
| Estimate | –0.035 | –0.034 | 0.013 | –0.054 | –0.043 | –0.162* | 0.061 | –0.082 | –0.001 |
| Standard errors | (0.056) | (0.048) | (0.078) | (0.047) | (0.061) | (0.089) | (0.057) | (0.071) | (0.079) |
| Individuals | 31,728 | 15,620 | 16,108 | 6,299 | 25,429 | 3,122 | 3,177 | 12,498 | 13,162 |
[i] Standard errors in parentheses are clustered at the municipality level. All models include municipality and year fixed effects and municipality-specific trends. Socio-economic variables include parental labour-market participation, parental age, parental education, parental separation and the number of children in the family. Control for gender is included in columns 1, 4 and 5. † p < .1, * p < .05, ** p < .01, *** p < .001 (two-tailed test).
Table 7
Placebo effects of the mother-tongue training reform on standardised grades in Danish for immigrants and the second-generation immigrants from the EU and the EES – full sample.
| (1) | (2) | (3) | (4) | (5) | (6) | (7) | (8) | (9) | |
|---|---|---|---|---|---|---|---|---|---|
| All | Boys | Girls | First-generation immigrants | Second-generation immigrants | Male first-generation immigrants | Female first-generation immigrants | Male second-generation immigrants | Female second-generation immigrants | |
| Estimate | 0.107 | 0.170 | 0.045 | 0.155 | –0.160 | 0.274 | 0.081 | –0.030 | –0.202 |
| Standard errors | (0.096) | (0.123) | (0.117) | (0.116) | (0.172) | (0.142) | (0.152) | (0.312) | (0.265) |
| Individuals | 8,735 | 4,375 | 4,360 | 7,083 | 1,652 | 3,557 | 3,526 | 818 | 834 |
[i] Standard errors in parentheses are clustered at the municipality level. All models include municipality and year fixed effects and municipality-specific trends. Socio-economic variables include parental labour-market participation, parental age, parental education, parental separation and the number of children in the family. Control for gender is included in columns 1, 4 and 5. † p < .1, * p < .05, ** p < .01, *** p < .001 (two-tailed test).
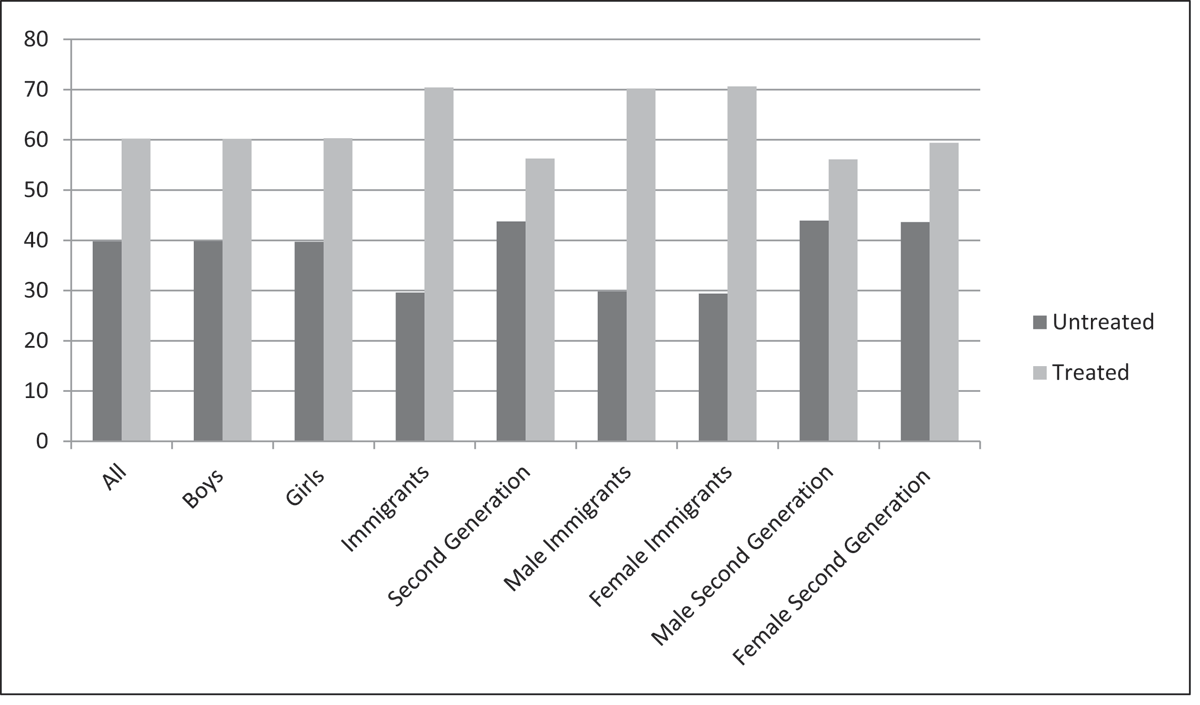
Figure A
Share of individuals residing in treated/untreated municipalities.
Table A
List of municipalities: Treated/untreated. Main sample and municipality reform sample.
| Main Sample | Municipality Reform Sample | ||
|---|---|---|---|
| Treated | Untreated | Treated | Untreated |
| Albertslund, Allerød, Bornholm, Brøndby, Dragør, Egedal, Fredensborg, Frederiksberg, Frederiksund, Furesø, Gentofte, Gribskov, Halsnæs, Helsingør, Hillerød, Hvidovre, Høje-Tåstrup, Ikast-Brande, Lyngby-Taarbæk, Tårnby, Herning, Favrskov, Holstebro, Horsens, Norddjur, Odder, Ringkøbing-Skjern, Silkeborg, Skanderborg, Skive, Syddjur, Viborg, Aarhus, Brønderslev, Hjørring, Læsø, Rebild, Thisted, Vesthimmerland, Aalborg, Greve, Lemvig, Guldborgsund, Kalundborg, Køge, Lejre, Lolland, Samsø, Næstved, Slagelse, Solrød, Sorø, Stevn, Assen, Billund, Esbjerg, Fåborg-Midtfyn, Kolding, Nyborg, Odense, Svendborg, Tønder, Varde, Vejen, Åbenrå, Faxe, Middelfart, Nordfyn, Vejle, Ærø (n = 70) | Copenhagen, Roskilde, Randers, Sønderborg, Ballerup, Gladsaxe, Frederikshavn, Ringsted (n = 8) | Albertslund, Allerød, Bornholm, Dragør, Frederiksberg, Helsingör, Hvidovre, Høje-Tåstrup, Lyngby-Taarbæk, Tårnby, Odder, Aarhus, Læsø, Greve, Solrød, Odense (n = 16) | Copenhagen, Ballerup, Gladsaxe, Ringsted (n = 4) |
[i] Danish municipalities not included in the analysis are the following: Herlev, Ishøj, Fredericia, Haderslev, Glostrup, Vallensbæk, Holbæk, Vordingborg, Fanø, Rudersdal, Hedensted, Mariagerfjord, Jammerbugt, Rødovre, Odsherred, Hørsholm, Kerteminde, Stevns, Morsø, Langeland (n = 20).
Table B
Grades ‘7-point scale’ and equivalent ETCS grade.
| Danish grade | Explanation of grade | Equivalent ETCS grade | Equivalent number in paper |
|---|---|---|---|
| 12 | Excellent performance | A | 5 |
| 10 | Very good performance | B | 4 |
| 7 | Good performance | C | 3 |
| 4 | Fair performance | D | 2 |
| 02 | Adequate performance | E | 1 |
| 00 | Inadequate performance | Fx | 0 |
| –3 | Unacceptable performance | F | 0 |
Table C
Effects of the mother-tongue training reform on standardised grades in mathematics. Groups based on father’s level of education – full sample.
| (1) | (2) | (3) | (4) | |
|---|---|---|---|---|
| Father’s education | ||||
| Unknown | Primary | Secondary | University | |
| A. Controlling for municipality and year fixed effects | ||||
| Estimate | –0.068 | –0.010 | 0.003 | –0.075** |
| Standard error | (0.044) | (0.025) | (0.022) | (0.030) |
| B. Controlling for municipality and year fixed effects, and municipality-specific trends | ||||
| Estimate | –0.012 | –0.020 | –0.012 | –0.195** |
| Standard error | (0.116) | (0.041) | (0.040) | (0.072) |
| C. Controlling for municipality and year fixed effects, municipality-specific trends, and socio-economic/demographic variables | ||||
| Estimate | –0.017 | –0.019 | –0.010 | –0.189** |
| Standard error | (0.117) | (0.042) | (0.040) | (0.073) |
| Individuals | 5,704 | 15,980 | 20,093 | 14,277 |