
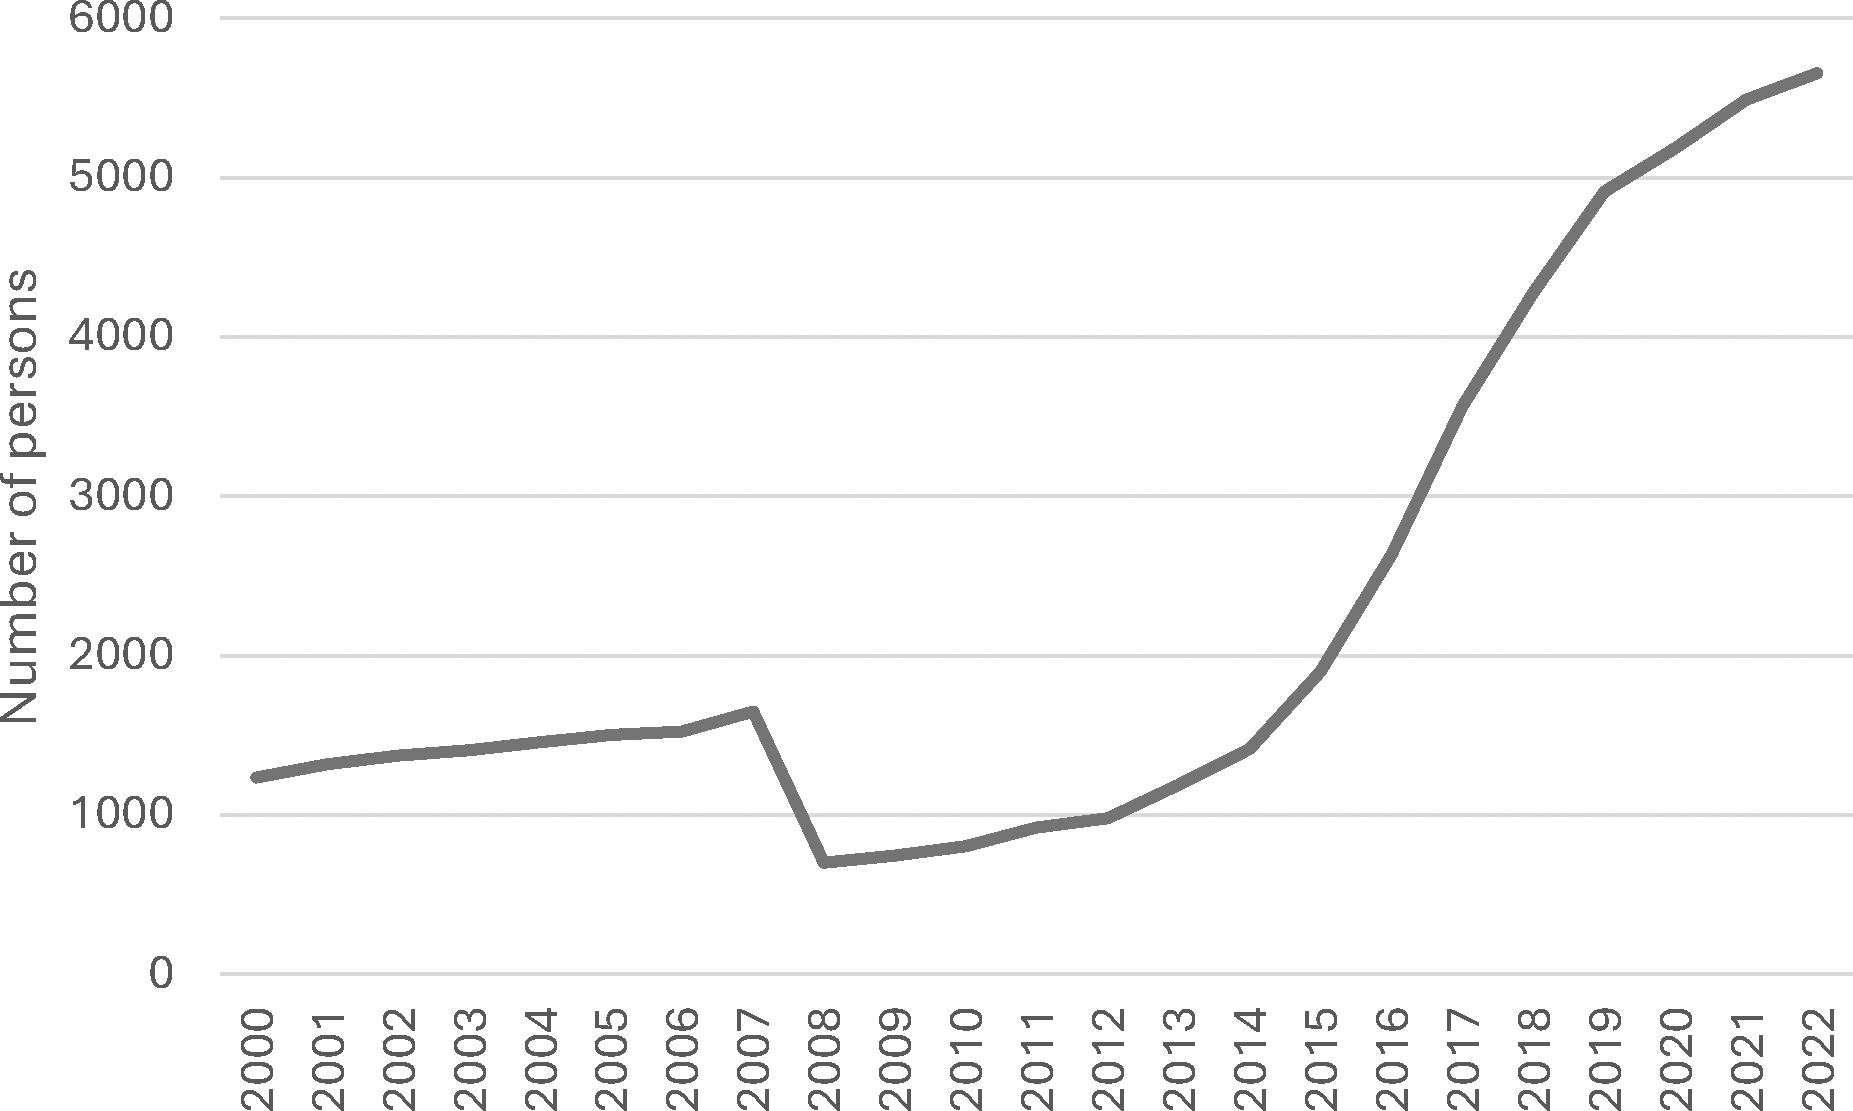
Figure 1
The number of Swedish citizens permanently residing in Portugal in 2000–2022.
Source: INE (Statistics Portugal).
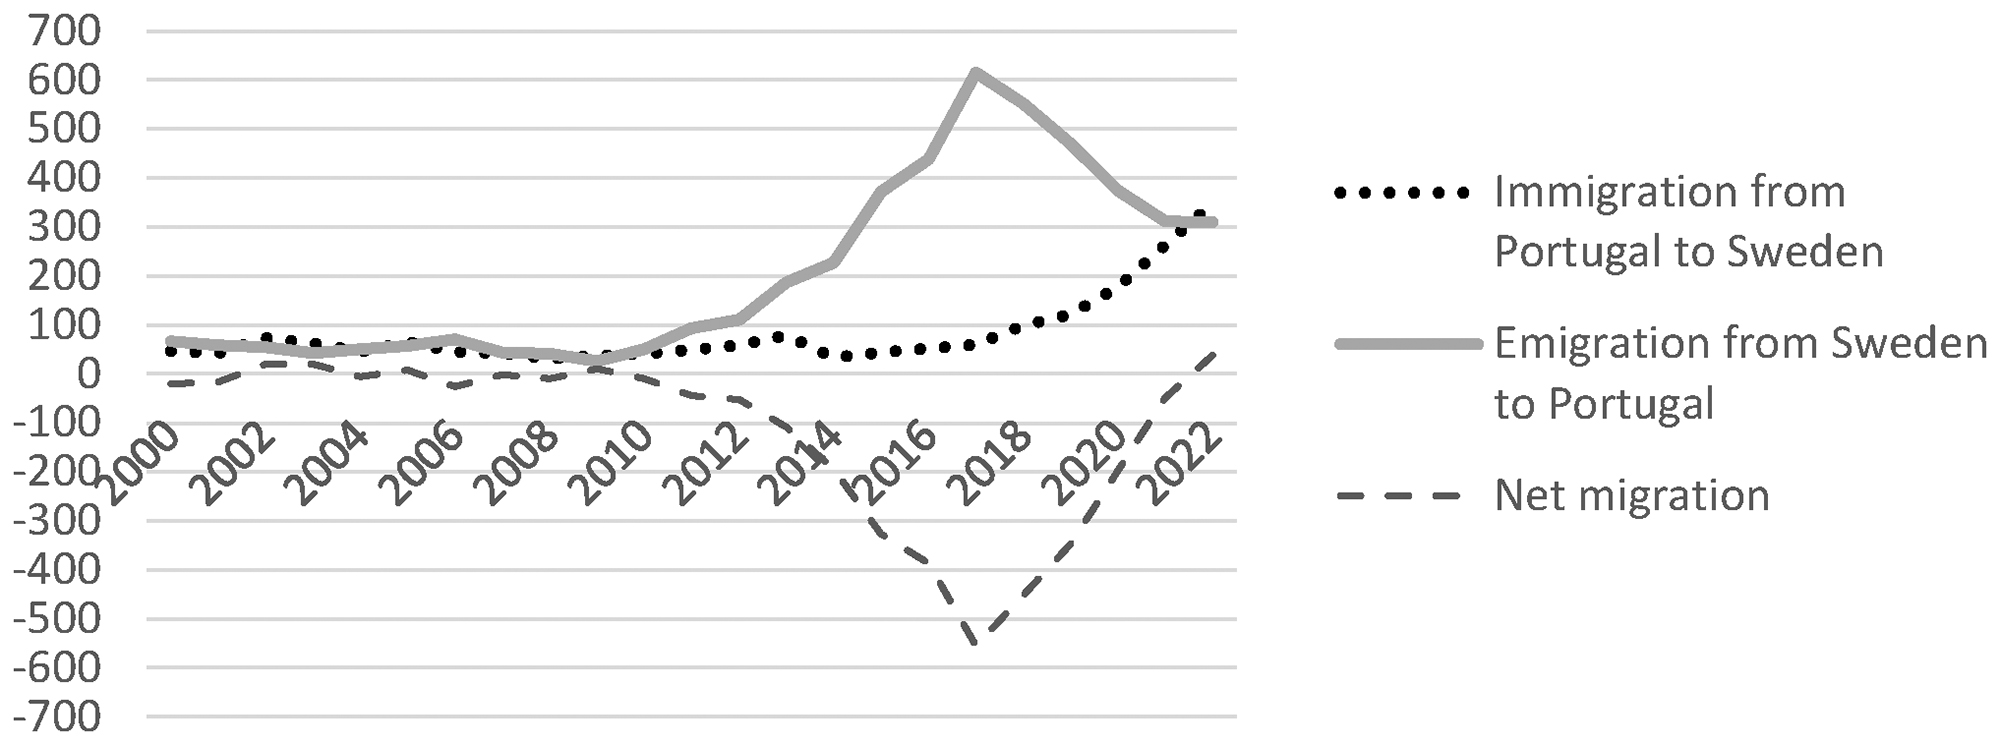
Figure 2
Migration flows from Sweden to Portugal during 2000–2022.
Source: Statistics Sweden.
Table 1
Sample descriptives.
| N | % | |
|---|---|---|
| Female | 183 | 44.9 |
| Older (64–87 years) | 226 | 56.1 |
| University education | 317 | 87.8 |
| Portuguese partner | 45 | 11.6 |
| Working | 65 | 13.3 |
| Arrived after 2010 | 307 | 78.9 |
| NHR status | 266 | 65.4 |
| Home ownership | 259 | 64.0 |
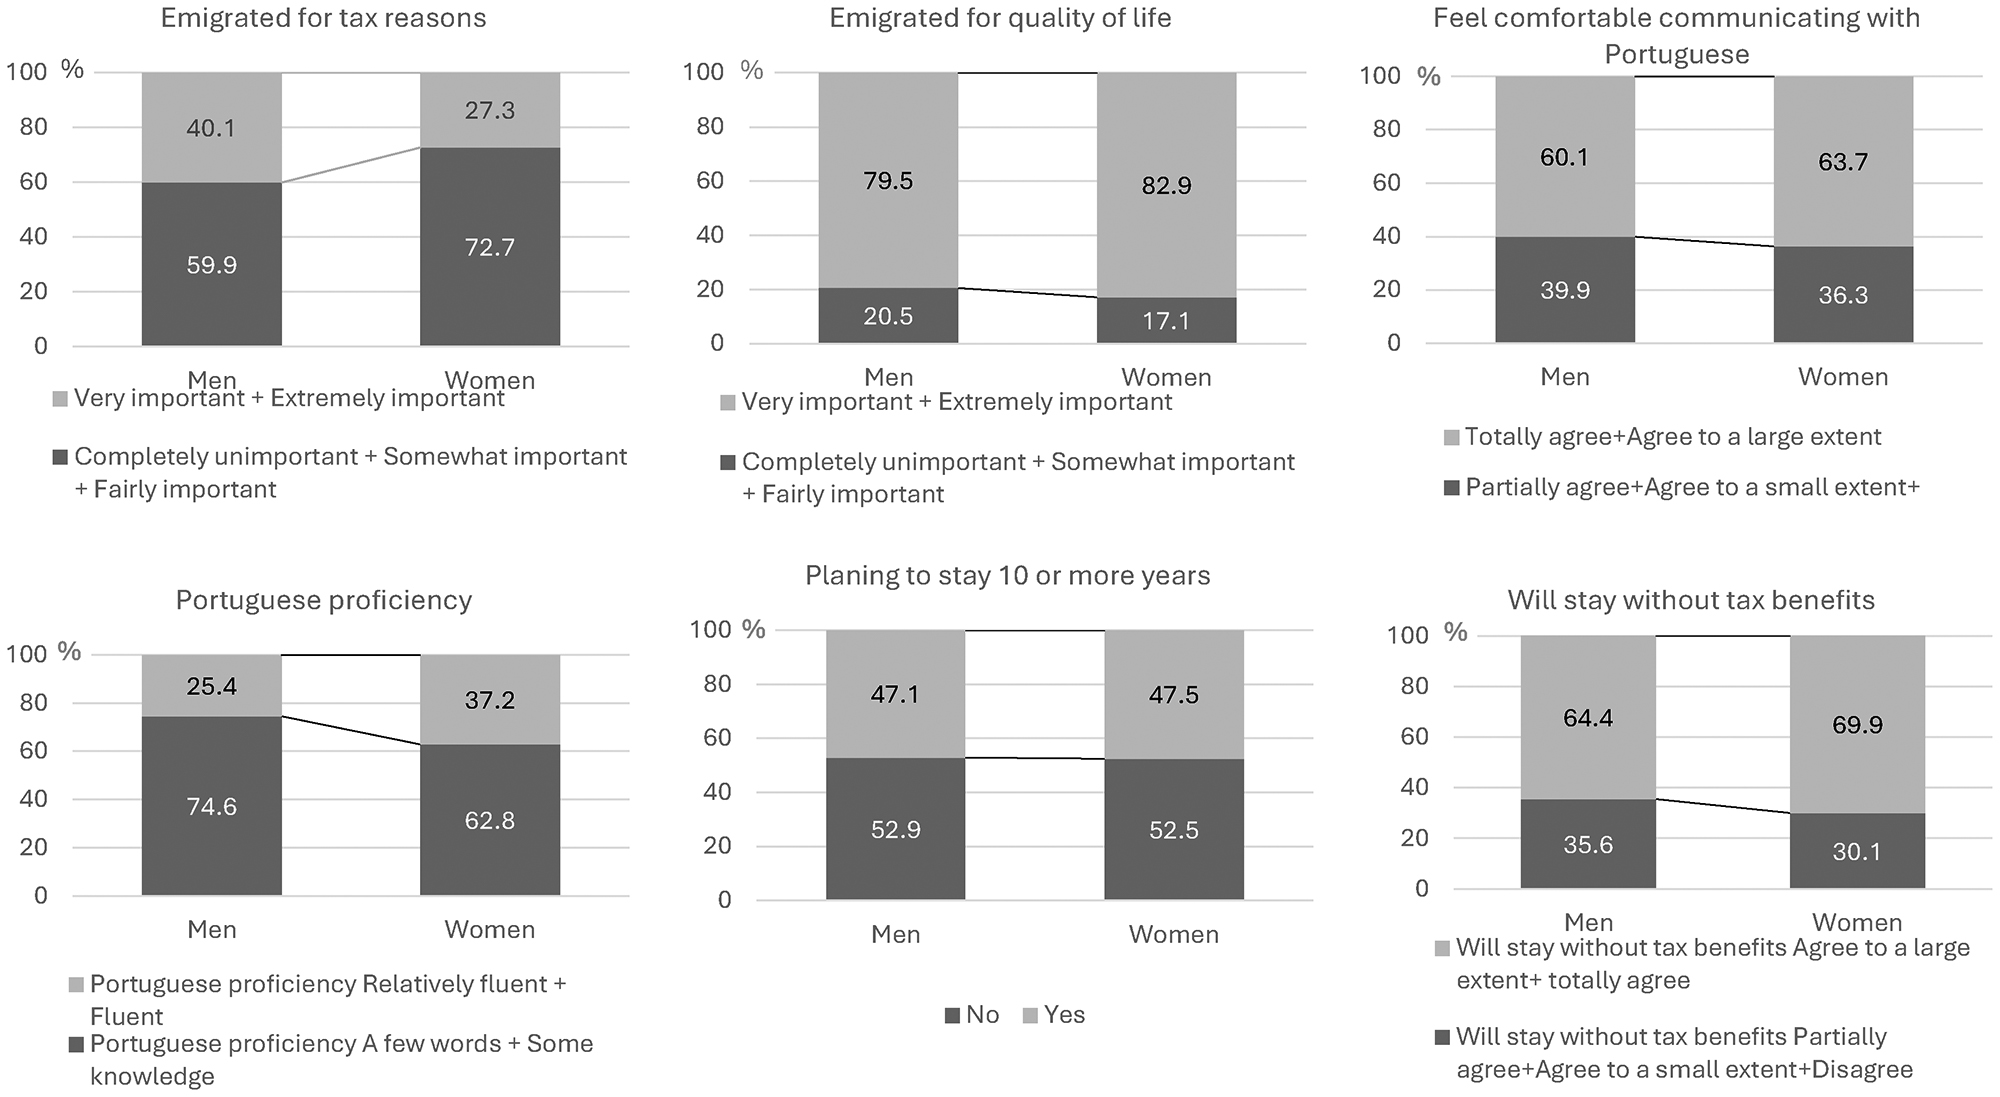
Figure 3
Dependent variables by gender.
Table 2
Regression coefficients and P‑values for the importance (Very important + Extremely important) to emigrate for tax reasons.
| MEN (N = 172) | WOMEN (N = 140) | |||
|---|---|---|---|---|
| PARAMETER | B | MARGINAL EFFECT | B | MARGINAL EFFECT |
| Intercept | −2.080*** | .. | −7.075 | .. |
| University degree | 0.406 | 0.138 | −0.109 | −0.035 |
| Older (64–87 years) | 0.204 | 0.069 | −0.331 | −0.106 |
| Arrived after 2010 | 0.563 | 0.192 | 5.738 | 0.000 |
| NHR status | 1.039** | 0.353 | 1.345*** | 0.430 |
| Likelihood ratio Chi‑squared P‑value | 0.000 | 0.000 | ||
[i] *** = P < 0.001.
[ii] ** = P < 0.01.
[iii] * = P < 0.05.
Table 3
Regression coefficients and P‑values for the importance (Very important + Extremely important) to emigrate for quality of life.
| MEN (N = 177) | WOMEN (N = 151) | |||
|---|---|---|---|---|
| PARAMETER | B | MARGINAL EFFECT | B | MARGINAL EFFECT |
| Intercept | 0.198 | 1.471** | ||
| University degree | −0.182 | −0.046 | −1.022* | −0.257 |
| Older (64–87 years) | 0.293 | 0.073 | 0.186 | 0.047 |
| Arrived after 2010 | 0.707* | 0.177 | 0.150 | 0.038 |
| NHR status | 0.150 | 0.038 | 0.294 | 0.074 |
| Likelihood ratio Chi‑squared P‑value | 0.028 | 0.080 | ||
[i] *** = P < 0.001.
[ii] ** = P < 0.01.
[iii] * = P < 0.05.
Table 4
Regression coefficients and P‑values for the comfortability in communicating with Portuguese (Totally agree + Agree to a large extent).
| MEN (N = 168) | WOMEN (N = 149) | |||
|---|---|---|---|---|
| PARAMETER | B | MARGINAL EFFECT | B | MARGINAL EFFECT |
| Intercept | −0.059 | 0.219 | ||
| University education | 0.159 | 0.060 | −0.079 | −0.024 |
| Home ownership | −0.168 | −0.064 | −0.530* | −0.162 |
| Portuguese partner | 6.599 | 0.000 | 0.637 | 0.195 |
| Younger (24–63 years) | 0.372 | 0.141 | 0.412 | 0.126 |
| Arrived before 2009 | 0.723 | 0.274 | 1.225** | 0.375 |
| No NHR status | 0.005 | 0.002 | 0.319 | 0.098 |
| Working | −0.549 | −0.208 | −0.485 | −0.148 |
| Likelihood ratio Chi‑squared P‑value | 0.004 | 0.000 | ||
[i] *** = P < 0.001.
[ii] ** = P < 0.01.
[iii] * = P < 0.05.
Table 5
Regression coefficients and P‑values for the Portuguese proficiency (Relatively fluent + Fluent).
| MEN (N = 170) | WOMEN (N = 171) | |||
|---|---|---|---|---|
| PARAMETER | B | MARGINAL EFFECT | B | MARGINAL EFFECT |
| Intercept | −1.929** | −1.145** | ||
| University degree | 0.904 | 0.193 | −0.108 | −0.021 |
| Have bought the home I live in | −0.193 | −0.041 | −0.231 | −0.045 |
| Portuguese partner | 1.124* | 0.240 | 1.377** | 0.269 |
| Younger (24–63 years) | 0.091 | 0.019 | 0.099 | 0.019 |
| Arrived before 2009 | 1.765*** | 0.376 | 1.483*** | 0.289 |
| No NHR status | −0.041 | −0.009 | 0.718* | 0.140 |
| Working | 0.558 | 0.119 | 0.564 | 0.110 |
| Likelihood ratio Chi‑squared P‑value | 0.000 | 0.000 | ||
[i] *** = P < 0.001.
[ii] ** = P < 0.01.
[iii] * = P < 0.05.
Table 6
Regression coefficients and P‑values for planning to stay 10 years or more.
| MEN (N = 170) | WOMEN (N = 151) | |||
|---|---|---|---|---|
| PARAMETER | B | MARGINAL EFFECT | B | MARGINAL EFFECT |
| Intercept | −0.818 | −0.845 | ||
| University degree | −0.117 | −0.041 | 0.356 | 0.130 |
| Pensioner | 0.029 | 0.010 | −0.074 | −0.027 |
| Have bought the home I live in | 0.858*** | 0.299 | 0.430 | 0.157 |
| Portuguese partner | 0.801 | 0.279 | −0.213 | −0.078 |
| Younger (24–63 years) | 0.342 | 0.119 | 0.720** | 0.263 |
| Arrived later (after 2010) | −0.352 | −0.123 | 0.020 | 0.007 |
| NHR status | 0.475 | 0.165 | −0.118 | −0.043 |
| Likelihood ratio Chi‑squared P‑value | 0.000 | 0.022 | ||
[i] *** = P < 0.001.
[ii] ** = P < 0.01.
[iii] * = P < 0.05.
Table 7
Regression coefficients and P‑values for will stay even without tax benefits (Agree to a large extent + Totally agree).
| MEN (N = 170) | WOMEN (N = 151) | |||
|---|---|---|---|---|
| PARAMETER | B | MARGINAL EFFECT | B | MARGINAL EFFECT |
| Intercept | −0.347 | 0.781 | ||
| University degree | −0.311 | −0.105 | −0.302 | −0.096 |
| Pensioner | 0.494* | 0.167 | 0.006 | 0.002 |
| Have bought the home I live in | 0.707* | 0.240 | 0.022 | 0.007 |
| Portuguese partner | 0.851 | 0.288 | 0.110 | 0.035 |
| Younger (24–63 years) | 0.227 | 0.077 | 0.336 | 0.107 |
| Arrived later (after 2010) | 0.156 | 0.053 | −0.168 | −0.054 |
| NHR status | −0.050 | −0.017 | 0.036 | 0.011 |
| Likelihood ratio Chi‑squared P‑value | 0.005 | 0.743 | ||
[i] *** = P < 0.001.
[ii] ** = P < 0.01.
[iii] * = P < 0.05.