
Table 1
Summary statistics of the dependent, independent, and control variables.
| VARIABLE | % | RANGE |
|---|---|---|
| Impressions of Christians: | ||
| Positive | 57.4 | 1–3 |
| Neutral (ref. category) | 35.4 | 1–3 |
| Negative | 7.2 | 1–3 |
| Impressions of Muslims: | ||
| Positive | 45.4 | 1–3 |
| Neutral (ref. category) | 37.6 | 1–3 |
| Negative | 17.0 | 1–3 |
| Impressions of nonbelievers: | ||
| Positive | 63.3 | 1–3 |
| Neutral (ref. category) | 34.2 | 1–3 |
| Negative | 2.5 | 1–3 |
| Impressions of Jews: | ||
| Positive | 49.8 | 1–3 |
| Neutral (ref. category) | 43.0 | 1–3 |
| Negative | 7.2 | 1–3 |
| Religious affiliation: | ||
| Christian | 49.8 | 1–0 |
| Muslim | 10.8 | 1–0 |
| Nonbeliever | 39.4 | 1–0 |
| Religious salience: | ||
| Low religious salience (ref. category) | 9.7 | 1–0 |
| High religious salience | 90.3 | 1–0 |
| Religious practice | ||
| Pray every day | 7.7 | 1–0 |
| Pray less frequent or never (ref. category) | 92.3 | 1–0 |
| Gender: | ||
| Male | 48.9 | 1–0 |
| Female (ref. category) | 51.1 | 1–0 |
| Parental education: | ||
| Lower compulsory (ref. category) | 8.6 | 1–3 |
| Upper secondary | 26.5 | 1–3 |
| University | 64.3 | 1–3 |
| Missing | 0.5 | . |
| Grade Point Average | ||
| Peer exposure: | ||
| Proportion of Christian peers in school cohort (%) | .44 (.002) | .11–.63 |
| Proportion of Muslim peers in school cohort (%) | .10 (.002) | 0–.72 |
| Proportion of nonbeliever peers in school cohort (%) | .35 (.001) | .07–.54 |
| Observations | 4968 | |
| No of schools | 58 |
Table 2
Impressions of Christians, Muslims, nonbelievers, and Jews in the Christian, Muslim, and nonbeliever subsamples.
| GROUP | PERCENTAGE | ||
|---|---|---|---|
| POSITIVE | NEUTRAL | NEGATIVE | |
| Christian (N = 2,475) | |||
| Impressions of Christians | 71.0 | 27.4 | 1.7 |
| Impressions of Muslims | 47.2 | 34.7 | 18.1 |
| Impressions of nonbelievers | 62.3 | 34.4 | 3.3 |
| Impressions of Jews | 59.0 | 36.8 | 4.2 |
| Muslim (N = 535) | |||
| Impressions of Christians | 68.7 | 28.0 | 3.4 |
| Impressions of Muslims | 83.0 | 15.3 | 1.7 |
| Impressions of nonbelievers | 61.9 | 32.7 | 5.4 |
| Impressions of Jews | 54.1 | 33.0 | 12.9 |
| Nonbeliever (N = 1,958) | |||
| Impressions of Christians | 36.8 | 48.0 | 15.3 |
| Impressions of Muslims | 32.3 | 47.8 | 19.9 |
| Impressions of nonbelievers | 64.9 | 34.4 | 0.7 |
| Impressions of Jews | 36.9 | 53.7 | 9.4 |
Table 3
Average marginal effects on the probability of evaluating Muslims, Christians, Jews, and nonbelievers positively or negatively: Multinomial logistic regression.
| IMPRESSION OF MUSLIMS | IMPRESSION OF CHRISTIANS | IMPRESSION OF JEWS | IMPRESSION OF NONBELIEVERS | |||||
|---|---|---|---|---|---|---|---|---|
| POSITIVE | NEGATIVE | POSITIVE | NEGATIVE | POSITIVE | NEGATIVE | POSITIVE | NEGATIVE | |
| Christian (vs. nonreligious) | 0.126*** (0.015) | −0.009 (0.013) | — | — | 0.205*** (0.015) | −0.044*** (0.006) | — | — |
| Muslim (vs. nonreligious) | — | — | 0.302*** (0.037) | −0.105*** (0.018) | 0.120*** (0.034) | −0.003 (0.010) | — | — |
| Christian (vs. Muslim) | — | — | — | — | — | — | 0.012 (0.025) | 0.009 (0.006) |
| High (vs. low) religious salience | 0.120*** (0.046) | 0.041 (0.035) | −0.001 (0.054) | 0.028 (0.038) | 0.100*** (0.035) | 0.016 (0.015) | −0.007 (0.035) | 0.054*** (0.020) |
| Religious practice (pray every day) | 0.078* (0.040) | −0.041 (0.032) | 0.008 (0.057) | 0.001 (0.044) | 0.036 (0.035) | 0.011 (0.014) | −0.007 (0.030) | 0.025* (0.014) |
| Proportion of target group in school cohort | 0.357*** (0.088) | −0.336*** (0.095) | −0.001 (0.001) | 0.001 (0.001) | — | — | −0.270*** (0.089) | 0.056* (0.031) |
| N | 4,433 | 2,493 | 4,968 | 3,010 | ||||
[i] Note: With controls for gender, parental education, and grade point average; robust standard errors are adjusted for clustering in parentheses.
[ii] *p< 0.05, **p < 0.01, ***p < 0.001.
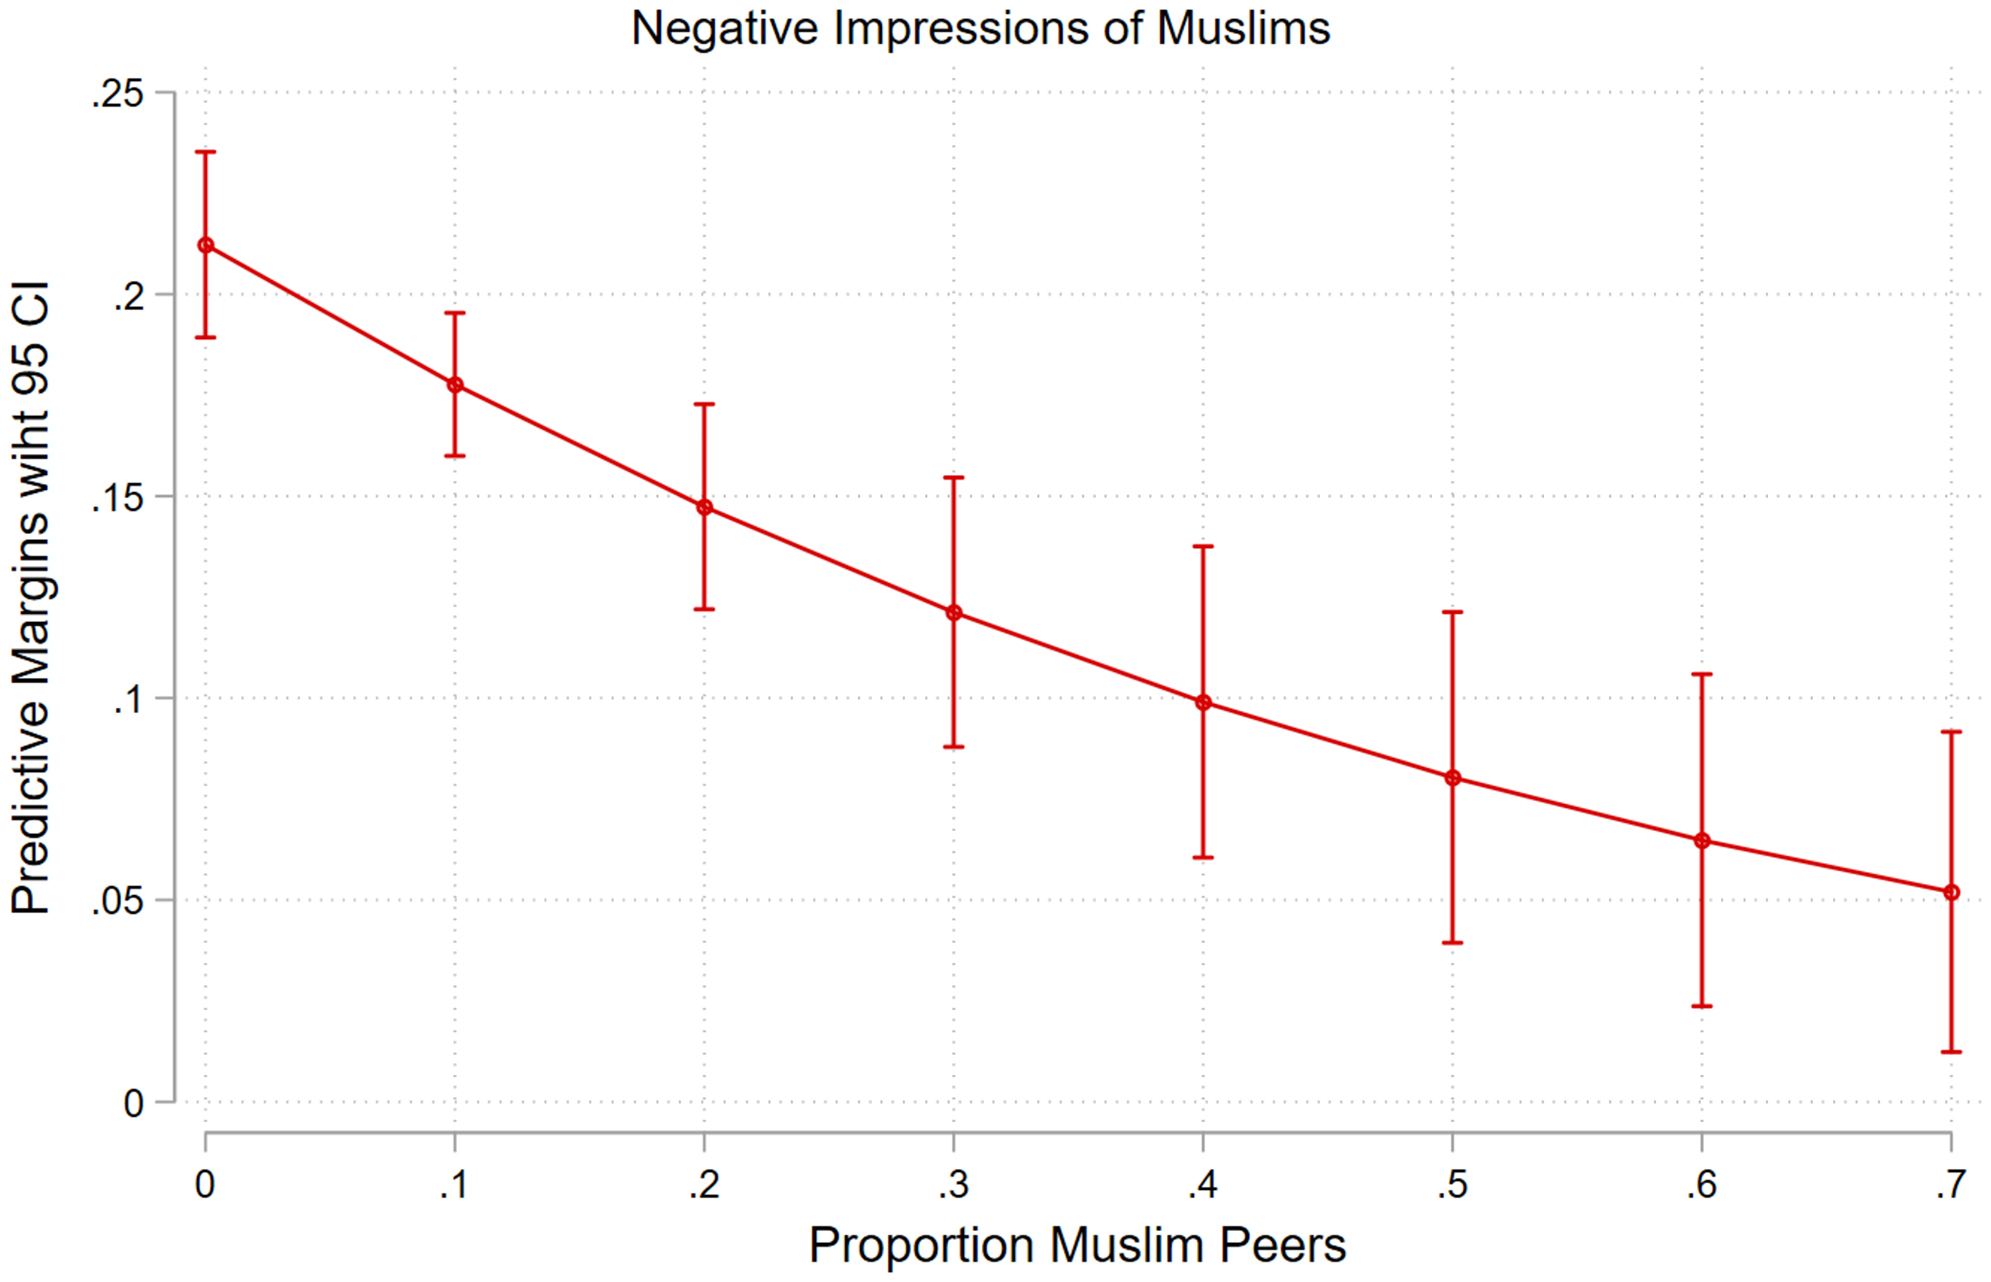
Figure 1
The predicted probability of a student expressing a negative impression of Muslims according to the relative proportion of Muslim peers in school.
Notes: Remaining control variables (gender, parental education, and grade point average) are held at their means.
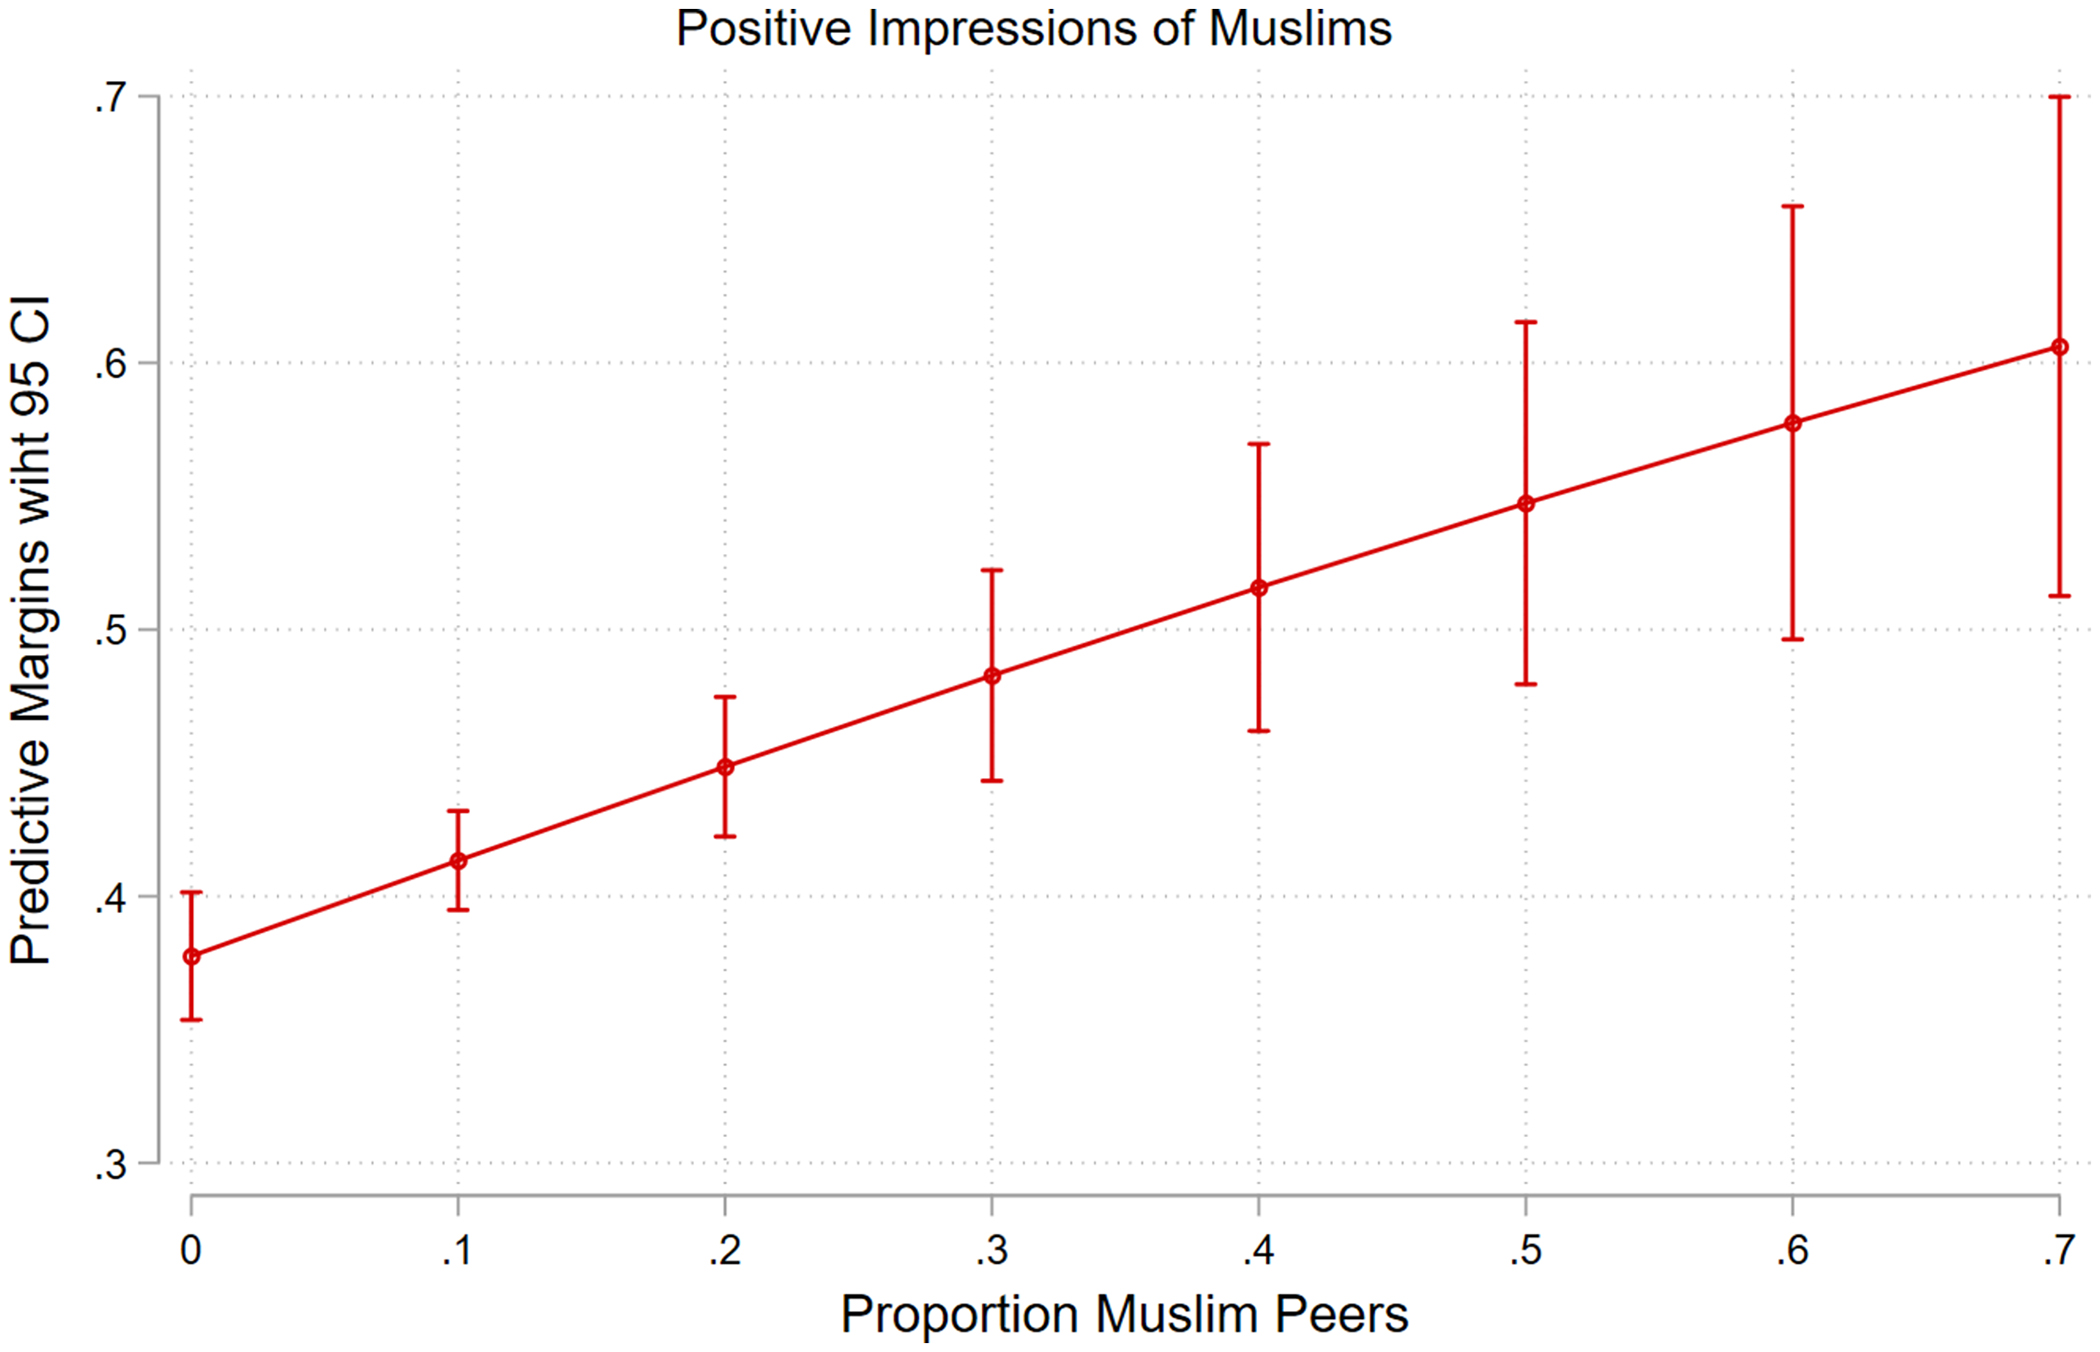
Figure 2
The predicted probability of a student expressing a positive impression of Muslims according to the relative proportion of Muslim peers in school.
Notes: Remaining control variables (gender, parental education, and grade point average) are held at their means.
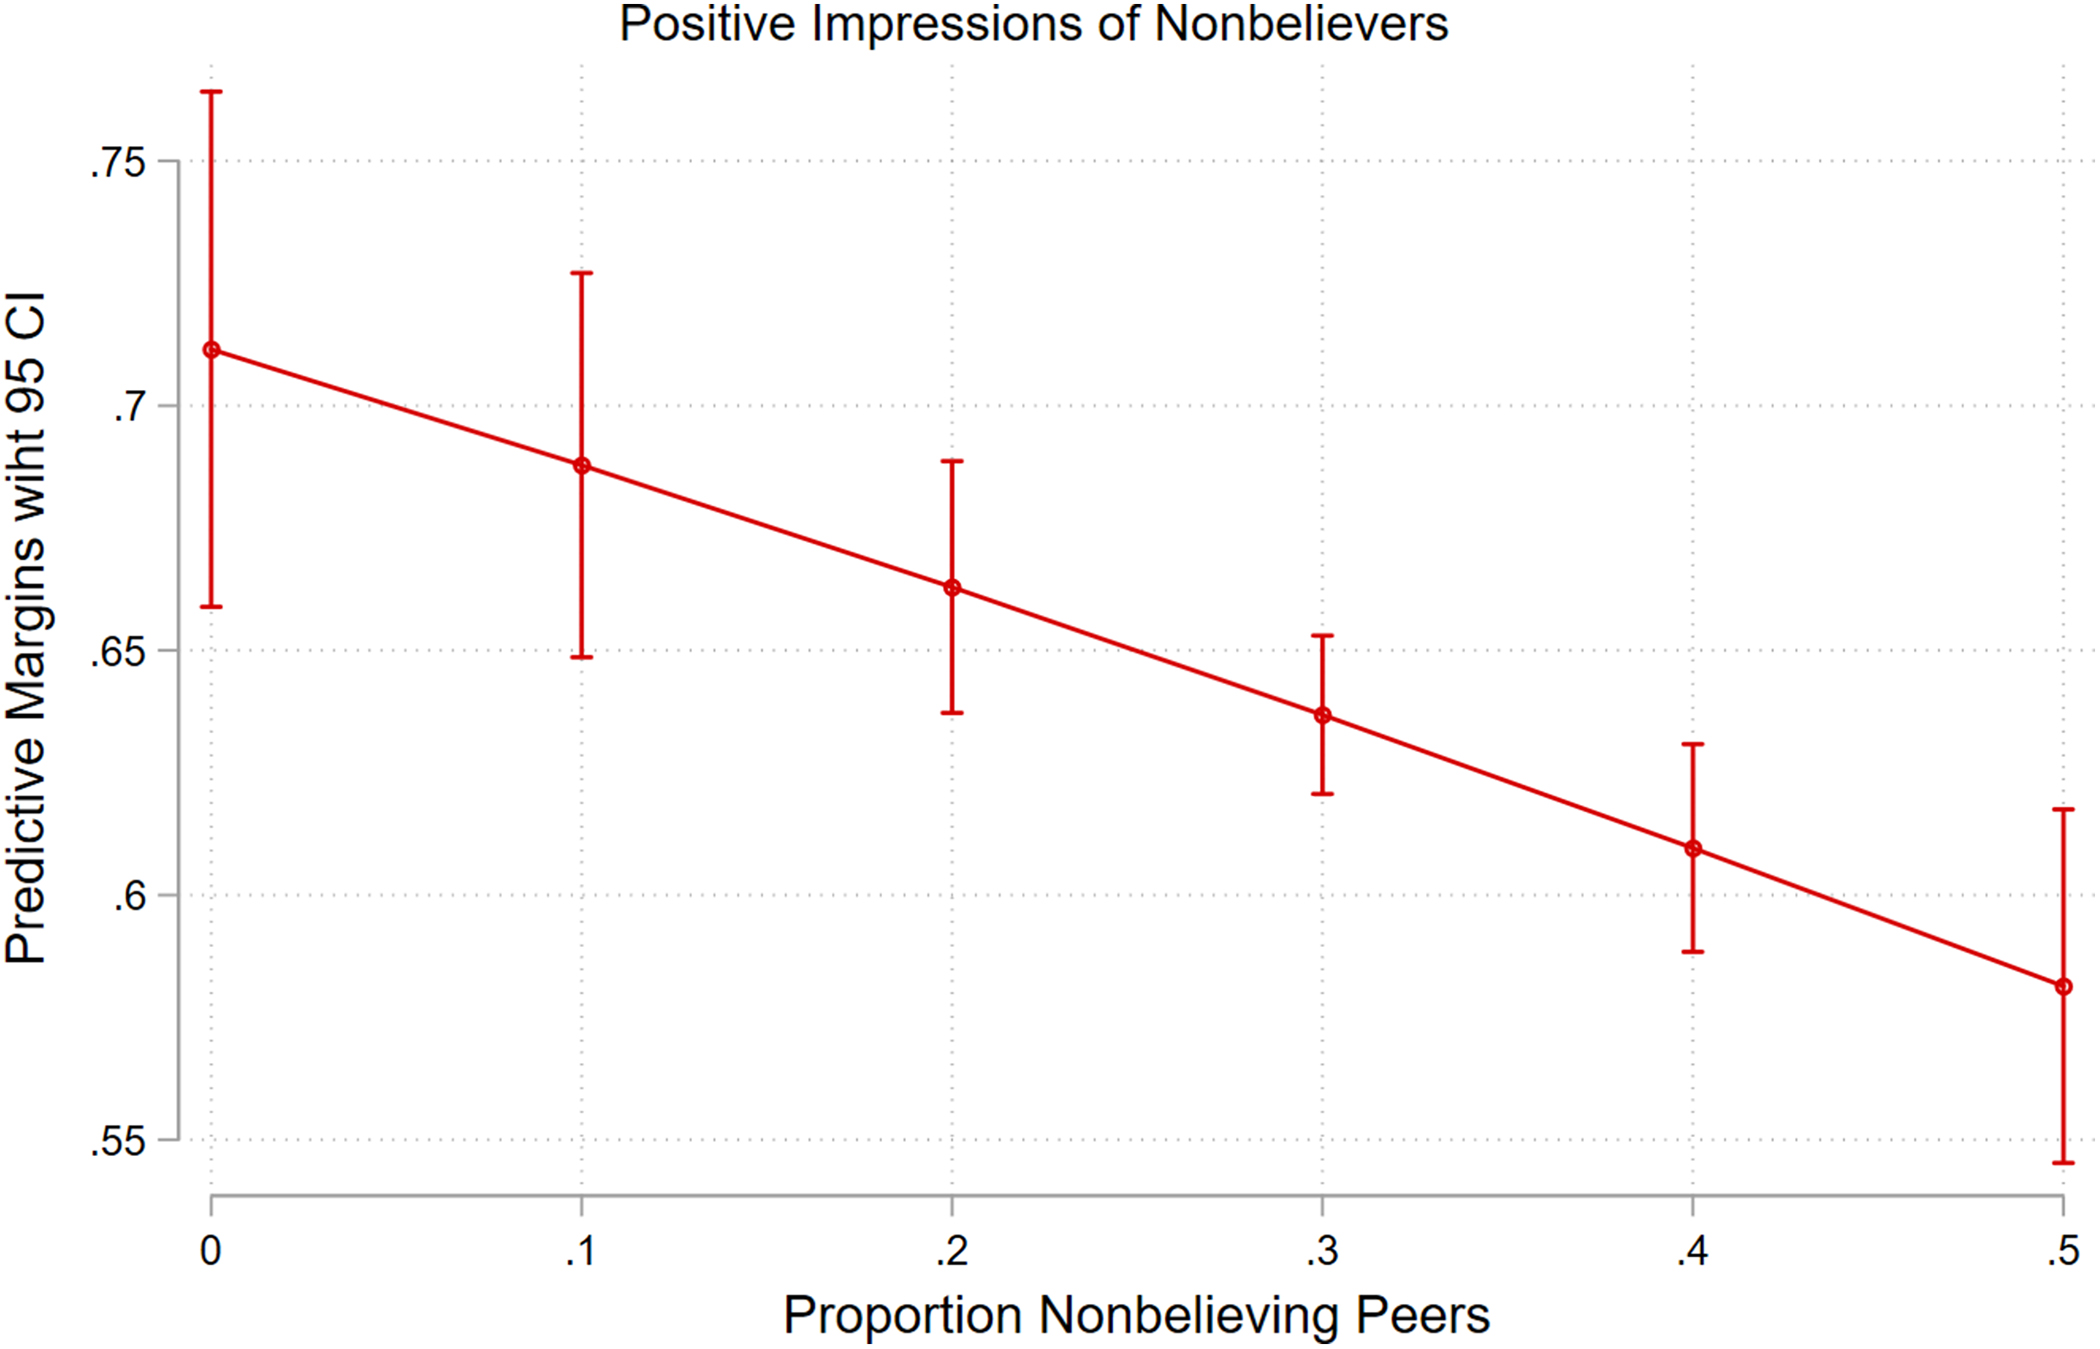
Figure 3
The predicted probability of a student expressing a positive impression of nonbelievers according to the relative proportion of nonbeliever peers in school.
Notes: Remaining control variables (gender, parental education, and grade point average) are held at their means.
Table 4
Average marginal effects with controls for remaining attitude variables on the probability of evaluating Muslims, Christians, Jews, and nonbelievers positively or negatively: Multinomial logistic regression.
| GROUP | IMPRESSIONS OF MUSLIMS | IMPRESSIONS OF CHRISTIANS | IMPRESSIONS OF JEWS | IMPRESSIONS OF NONBELIEVERS | ||||
|---|---|---|---|---|---|---|---|---|
| POSITIVE | NEGATIVE | POSITIVE | NEGATIVE | POSITIVE | NEGATIVE | POSITIVE | NEGATIVE | |
| Christian (vs. nonreligious) | −0.059*** (0.016) | 0.085*** (0.025) | — | — | 0.056 (0.038) | −0.003 (0.007) | — | — |
| Muslim (vs. nonreligious) | — | — | 0.343*** (0.065) | −0.132*** (0.034) | −0.389*** (0.043) | 0.124*** (0.042) | — | — |
| Christian (vs. Muslim) | — | — | — | — | — | — | 0.114** (0.046) | 0.011 (0.008) |
| High (vs. low) religious salience | 0.032 (0.045) | −0.017 (0.052) | −0.168** (0.069) | 0.002 (0.043) | 0.006 (0.055) | 0.005 (0.010) | −0.137*** (0.040) | 0.068*** (0.022) |
| Religious practice (pray every day) | 0.069 (0.052) | −0.081 (0.058) | 0.041 (0.099) | −0.041 (0.052) | −0.041 (0.049) | 0.011 (0.013) | −0.101*** (0.038) | 0.035* (0.018) |
| Proportion of target group in school cohort | 0.265** (0.113) | −0.347** (0.137) | −0.001 (0.002) | −0.000 (0.001) | — | — | −0.134 (0.123) | 0.054 (0.037) |
| N | 4,433 | 2,493 | 4,968 | 3,010 | ||||
[i] Note: With controls for gender, parental education, and grade point average; robust standard errors are adjusted for clustering in parentheses.
[ii] *p< 0.05, **p < 0.01, ***p < 0.001.