
Table I
Primer sequences and expected amplicon sizes used for molecular confirmation of Listeria monocytogenes.
| Gene | Primer | Size | Reference |
|---|---|---|---|
| hly | F: ACGCAGTAAATACATTAGTG | 372 | Cao et al. 2018 |
| R: AATAAACTTGACGGCCATAC | |||
| iap | F: TTTGCTAAAGCGGGAATCTC | 205 | Cao et al. 2018 |
| R: AGCCGTGGATGTTATCGTAT |
Table II
Target and housekeeping gene primers and their product sizes used in gene expression experiments.
| Gene | Primer sequence | Size | Reference |
|---|---|---|---|
| sigB | F: GCCGCTTACCAAGAAAATGG R: AATATTTTCGGGCGATGGAC | 91 | Poimenidou et al. 2023 |
| agrA | F: GCAGCCGGACATGAATGG R: AACCACGCGGATCAAACTTC | 62 | Liu et al. 2021 |
| agrB | F: CGGCAGACACAGAAAGTTTG R: TGCGAATGGTATTAGCAACG | 116 | Wiktorczyk-Kapischke et al. 2023 |
| prfA | F: CAATGGGATCCACAAGAATAT R: GATAAAGCCAGACATTATAACGAAAGC | 132 | Kazmierczak et al. 2006 |
| 16S rRNA | F: GGAGCATGTGGTTTAATTCG R: CCAACTAAATGCTGGCAACT | 199 | Roy et al. 2023 |
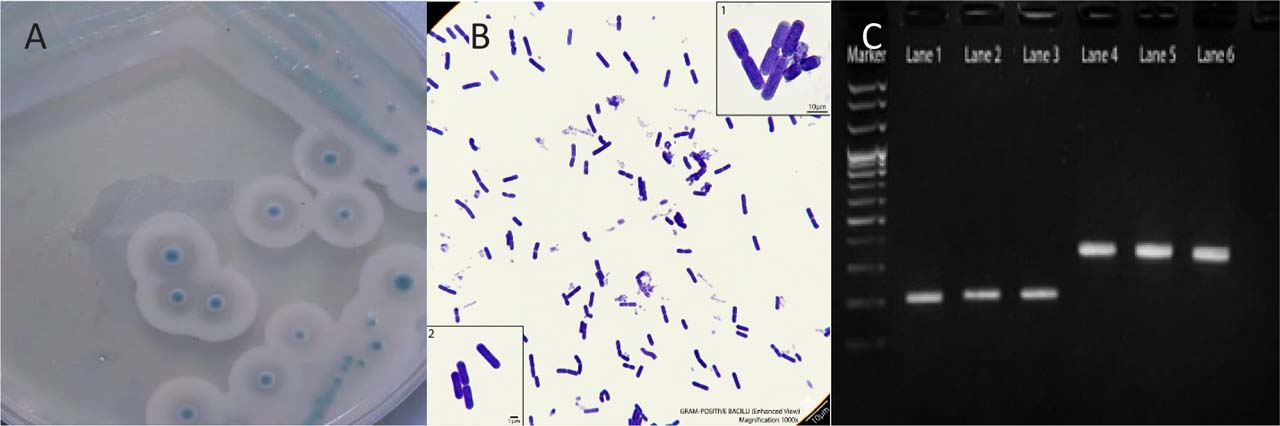
Fig. 1.
Phenotypic and molecular identification of Listeria monocytogenes. (A) Typical L. monocytogenes colonies on Listeria CHROMagar, appearing as small blue colonies surrounded by a white halo. (B) Microscopic examination showing Gram-positive coccobacilli. (C) PCR amplification of L. monocytogenes: lane M, molecular size marker; lanes 1–3, hly gene (372 bp); and lanes 4–6, iap gene (205 bp). PCR products were separated on a 1.5% agarose gel.
Table III
Distribution of Listeria monocytogenes in different local food samples.
| Sample type | No. of samples | No. of positive samples for L. monocytogenes | % of positive samples for L. monocytogenes |
|---|---|---|---|
| Local chicken meat | 70 | 1 | 1.4 |
| Frozen chicken meat | 88 | 5 | 5.68 |
| Minced meat | 80 | 2 | 2.5 |
| Lettuce | 77 | 4 | 5.1 |
| Root beet | 87 | 5 | 5.7 |
| Celery | 84 | 2 | 2.38 |
| Local cheese | 30 | 0 | 0 |
| Radish | 76 | 3 | 3.95 |
| Leeks | 80 | 4 | 5 |
| Watercress | 66 | 1 | 1.5 |
| Garden cress | 40 | 2 | 5 |
| Total | 778 | 29 | 3.7 |
Table IV
Antibiotic susce ptibility test of 29 Listeria monocytogenes isolates.
| Antibiotics | Dose µg/disk | Sensitivity of the isolates (No.) | Resistant strains (%) | ||
|---|---|---|---|---|---|
| Sensitive | Intermediate | Resistant | |||
| Ampicillin | 10 | 29 | 0 | 0 | 0% |
| Gentamicin | 10 | 27 | 2 | 0 | 0% |
| Tetracycline | 30 | 14 | 6 | 9 | 31% |
| Co-trimoxazole | 25 | 27 | 0 | 2 | 6.9% |
| Vancomycin | 30 | 29 | 0 | 0 | 0% |
| Ciprofloxacin | 5 | 24 | 1 | 4 | 13.8% |
| Penicillin | 10 | 29 | 0 | 0 | 0% |
| Erythromycin | 15 | 16 | 1 | 12 | 41.4% |
| Imipenem | 10 | 29 | 0 | 0 | 0% |
| Chloramphenicol | 30 | 28 | 1 | 0 | 0% |
Table V
Biofilm formation abilities of Listeria monocytogenes isolates.
| Degree of biofilm | No. of isolates | Percentage (%) |
|---|---|---|
| Weak | 6 | 21 |
| Moderate | 16 | 55 |
| Strong | 7 | 24 |
| Total | 29 | 100 |
Table VI
Chemical composition of clove oil extract determined by GC–MS
| NO. | Retention Time | Area (%) | Name |
|---|---|---|---|
| 1 | 20.167 | 94.97 | Eugenol |
| 2 | 22.217 | 0.56 | Caryophyllene |
| 3 | 23.050 | 0.05 | Isoeugenol, TMS derivative |
| 4 | 23.175 | 0.11 | Alpha -Caryophyllene |
| 5 | 24.475 | 3.89 | Phenol, 2-methoxy-4-(1-propenyl)- |
| 6 | 27.375 | 0.41 | Caryophyllene oxide |
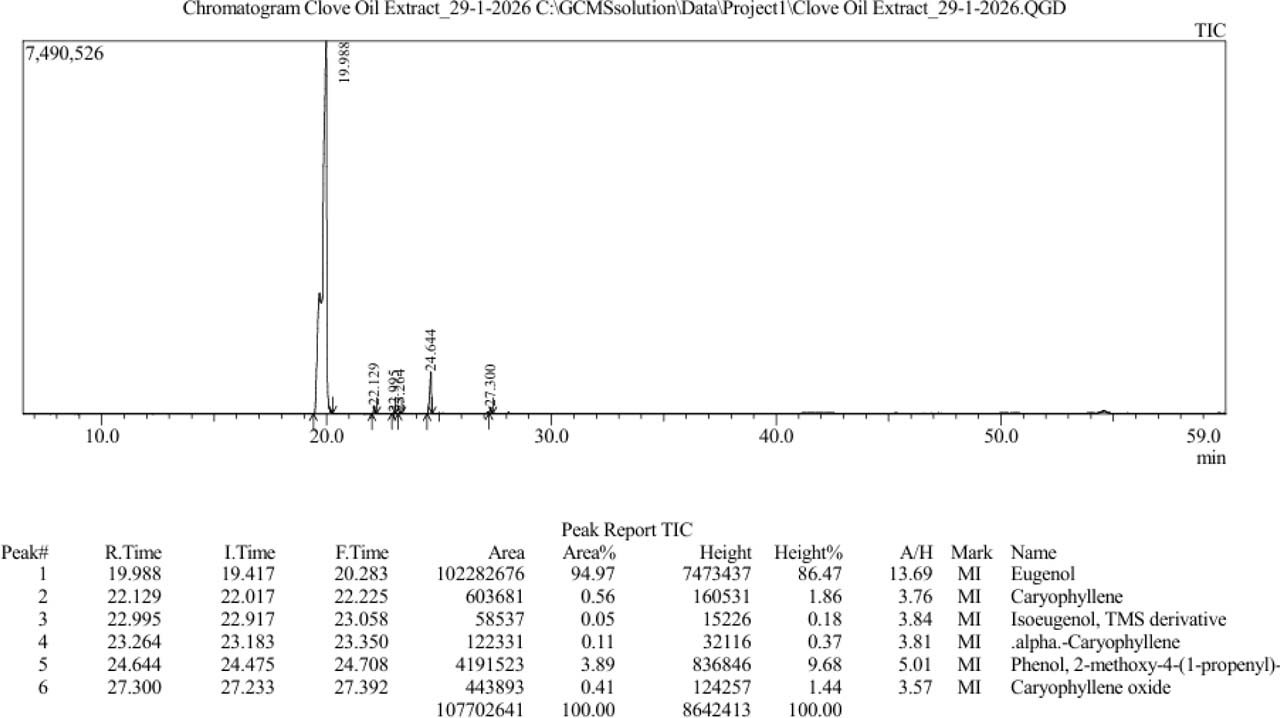
Fig. 2.
Analytical parameters, identification, and quantification of clove oil extract by GC mass.
Table VII
The Minimum Inhibitory Concentrations and Sub-MICs of quercetin and Clove oil against two isolates of Listeria monocytogenes.
| Antibacterial chemical | Bacterial isolates | MIC (mg/ml) | SUB-MIC (mg/ml) |
|---|---|---|---|
| Quercetin | LM1 | 0.45 | 0.225 |
| LM2 | 0.45 | 0.225 | |
| Clove oil | LM1 | 0.4 | 0.2 |
| LM2 | 0.4 | 0.2 |
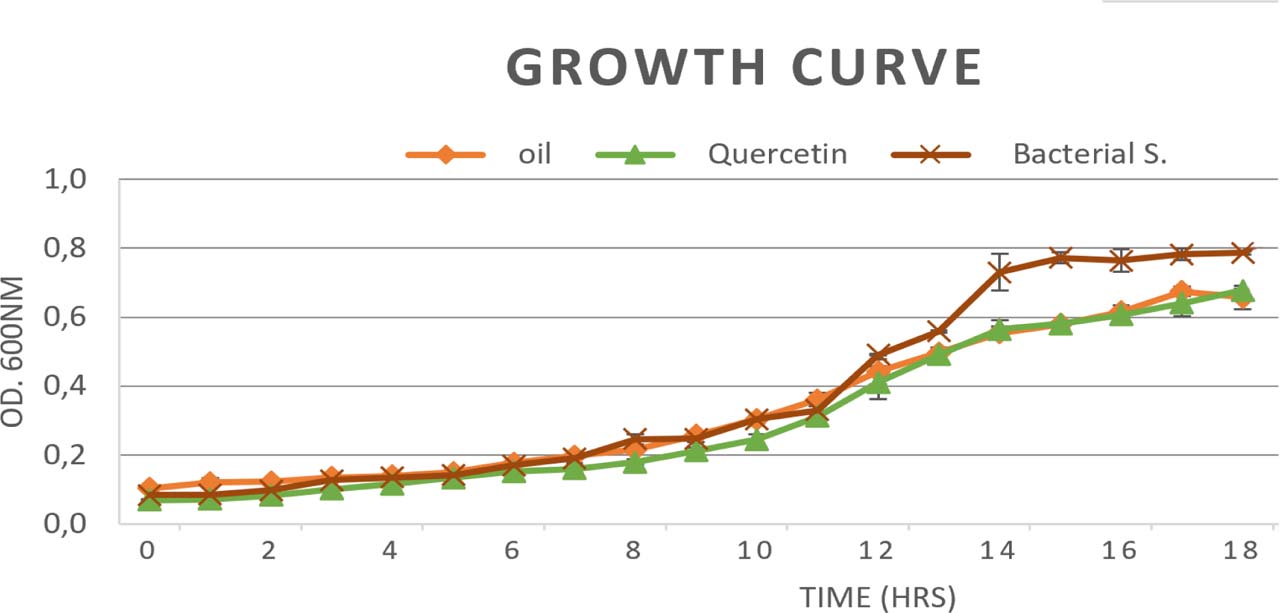
Fig. 3.
Growth curves of Listeria monocytogenes isolates cultured with or without sub-MIC concentrations of clove oil and quercetin for 18 h. Data points represent the means of three biological replicates.
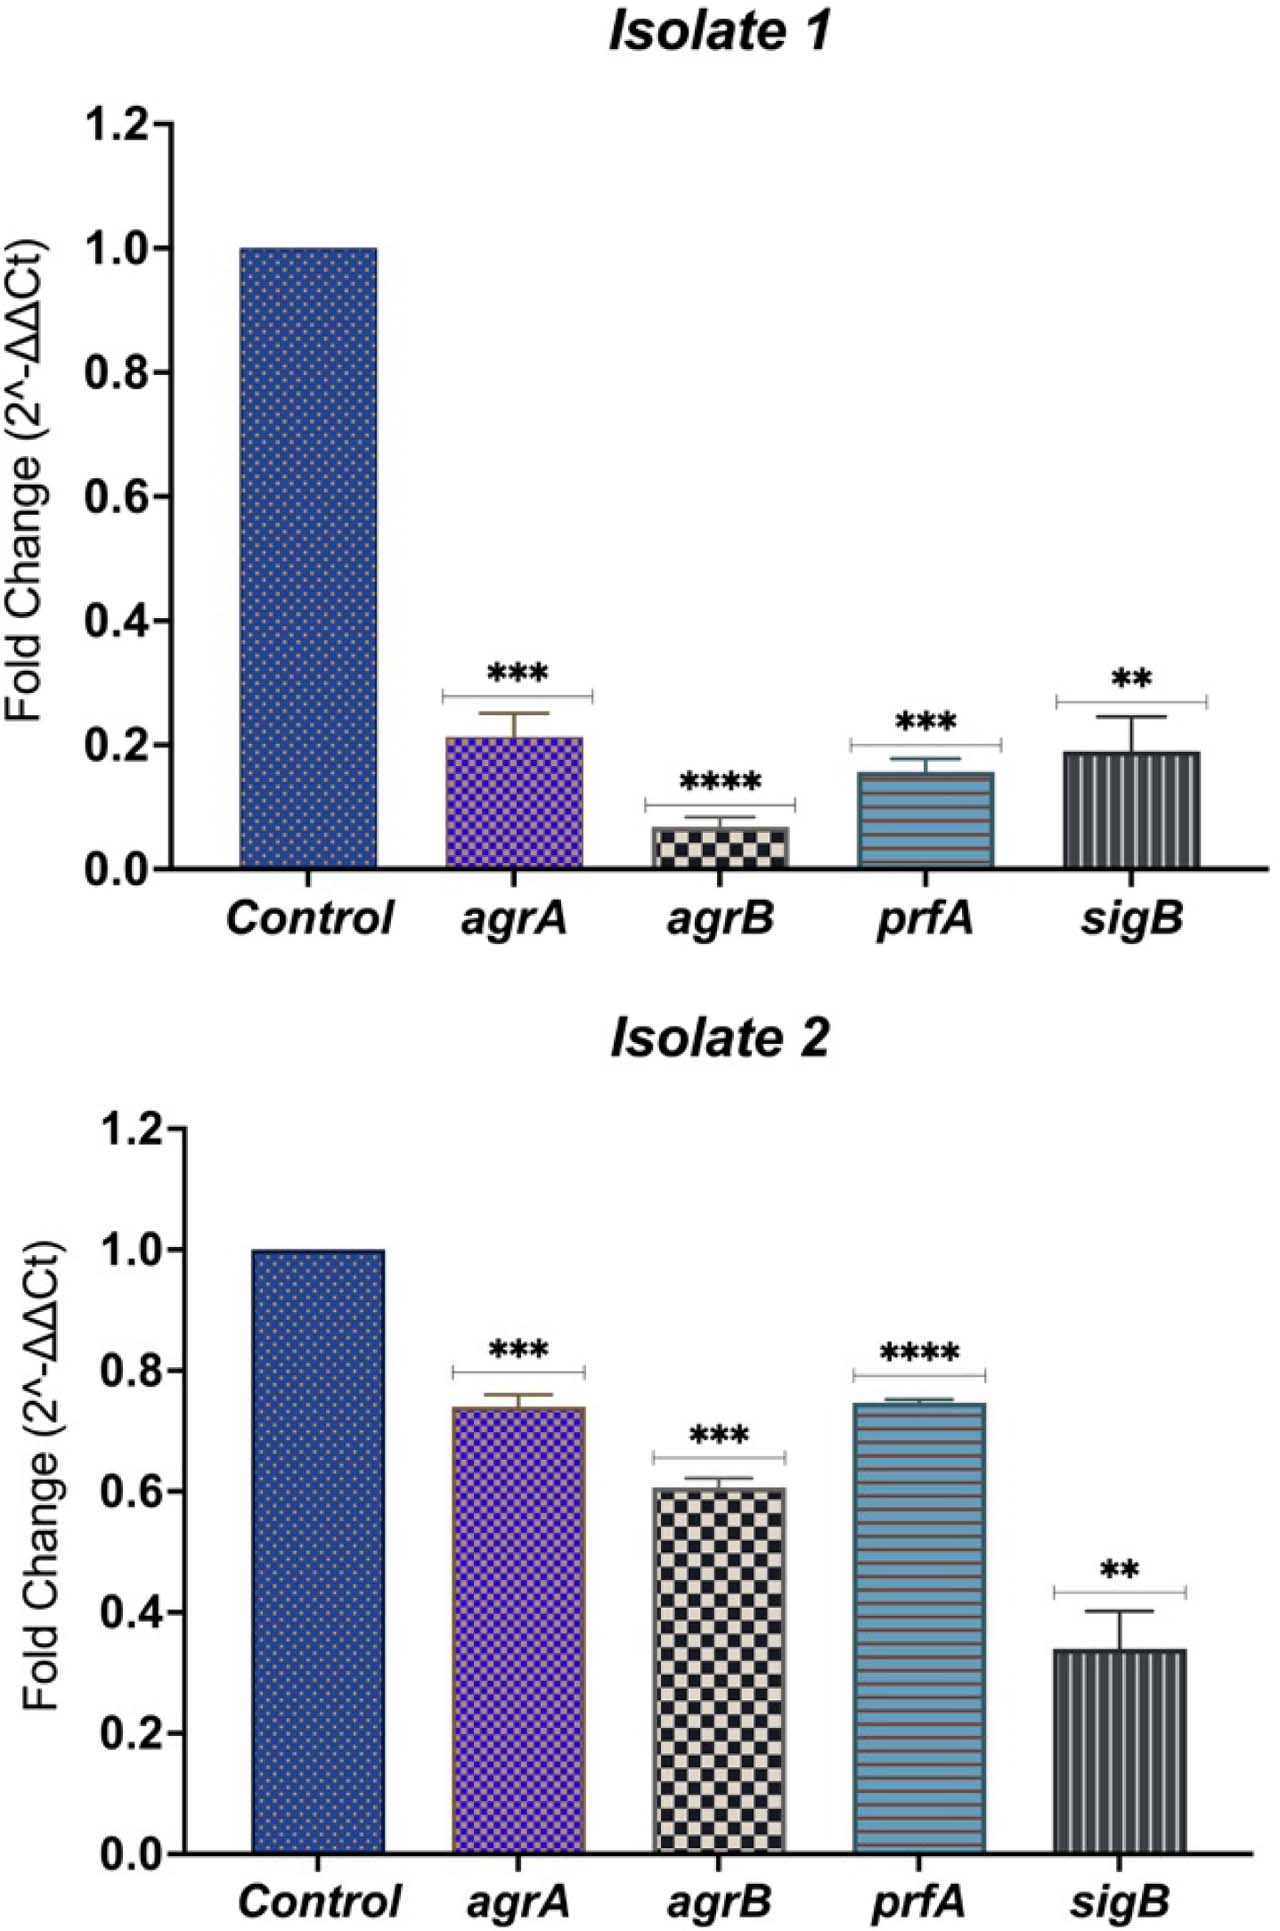
Fig. 4.
Effect of clove oil on the relative expression of agrA, agrB, prfA, and sigB in Listeria monocytogenes isolates LM1 (A) and LM2 (B). Gene expression was normalized to the 16S rRNA reference gene and calculated using the 2−ΔΔCt method relative to the untreated control. Bars represent the mean ± SD of three biological replicates.
Table VIII
Relative gene expression (agrA, agrB, prfA, and sigB) in Listeria monocytogenes isolates treated with sub-MIC clove oil.
| Isolate No. | Gene | Fold change | Regulation |
|---|---|---|---|
| LM1 | agrA | 0.21 | down-regulated |
| agrB | 0.07 | down-regulated | |
| prfA | 0.15 | down-regulated | |
| sigB | 0.19 | down-regulated | |
| LM2 | agrA | 0.74 | down-regulated |
| agrB | 0.61 | down-regulated | |
| prfA | 0.74 | down-regulated | |
| sigB | 0.37 | down-regulated |
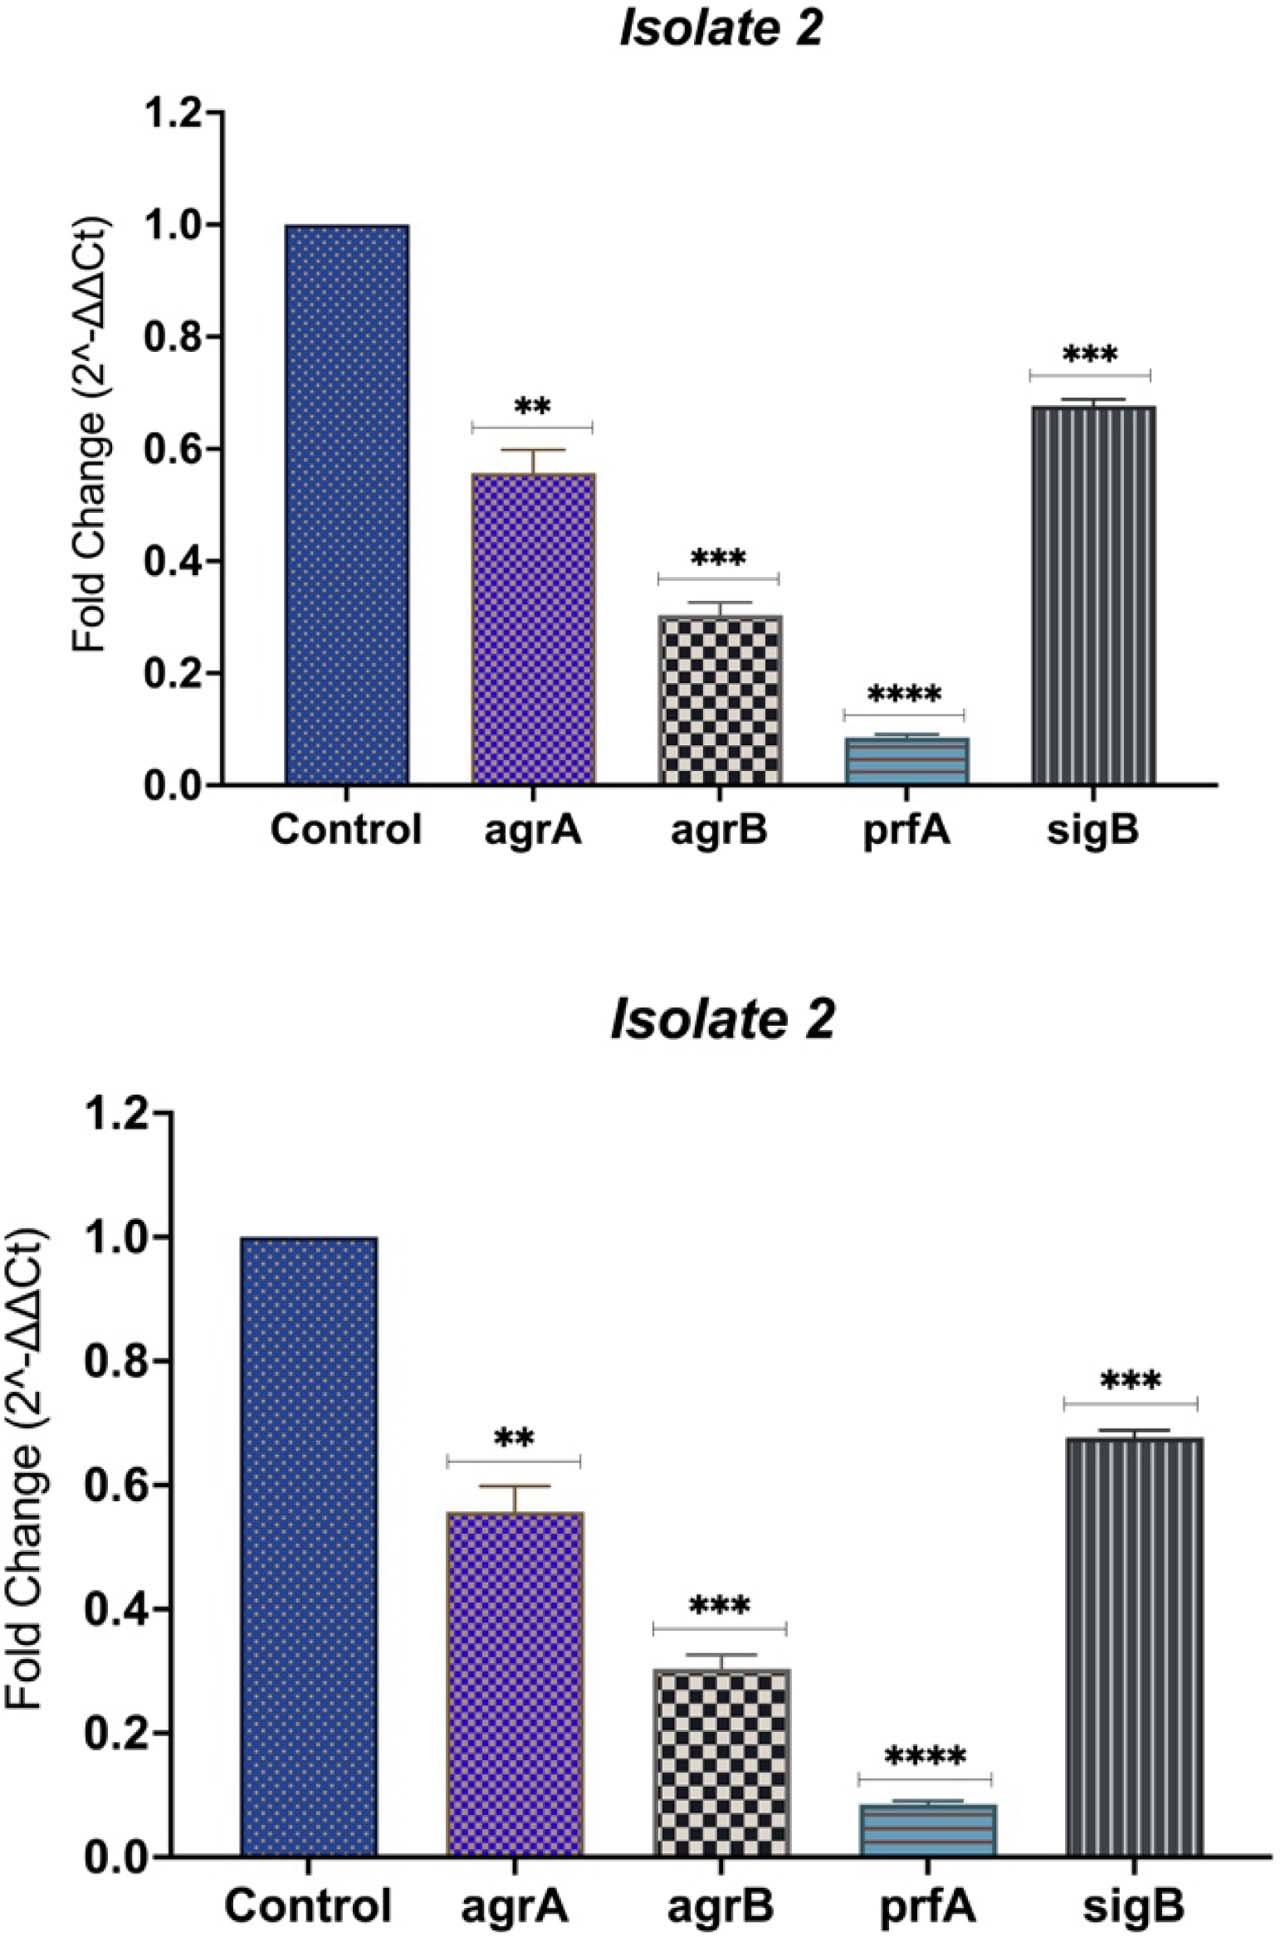
Fig. 5.
Effect of quercetin on regulatory gene expression in Listeria monocytogenes isolates. Relative expression levels of agrA, agrB, prfA, and sigB following quercetin treatment are shown for (A) isolate 1 and (B) isolate 2. Gene expression was normalized to the 16S rRNA reference gene and calculated using the 2−ΔΔCt method, relative to the corresponding untreated control. Bars represent the mean ± SD of three independent biological replicates. Asterisks indicate statistically significant differences compared with the untreated control (p < 0.05, *p < 0.01, **p < 0.001, ***p < 0.0001).
Table IX
Relative gene expression (agrA, agrB, prfA, and sigB) in Listeria monocytogenes isolates treated with sub-MIC quercetin.
| Isolate No. | Gene | Fold Change | Regulation |
|---|---|---|---|
| LM1 | agrA | 0.07 | downregulated |
| agrB | 0.08 | downregulated | |
| prfA | 0.16 | downregulated | |
| sigB | 0.24 | downregulated | |
| LM2 | agrA | 0.3 | downregulated |
| agrB | 0.56 | downregulated | |
| prfA | 0.06 | downregulated | |
| sigB | 0.24 | downregulated |