
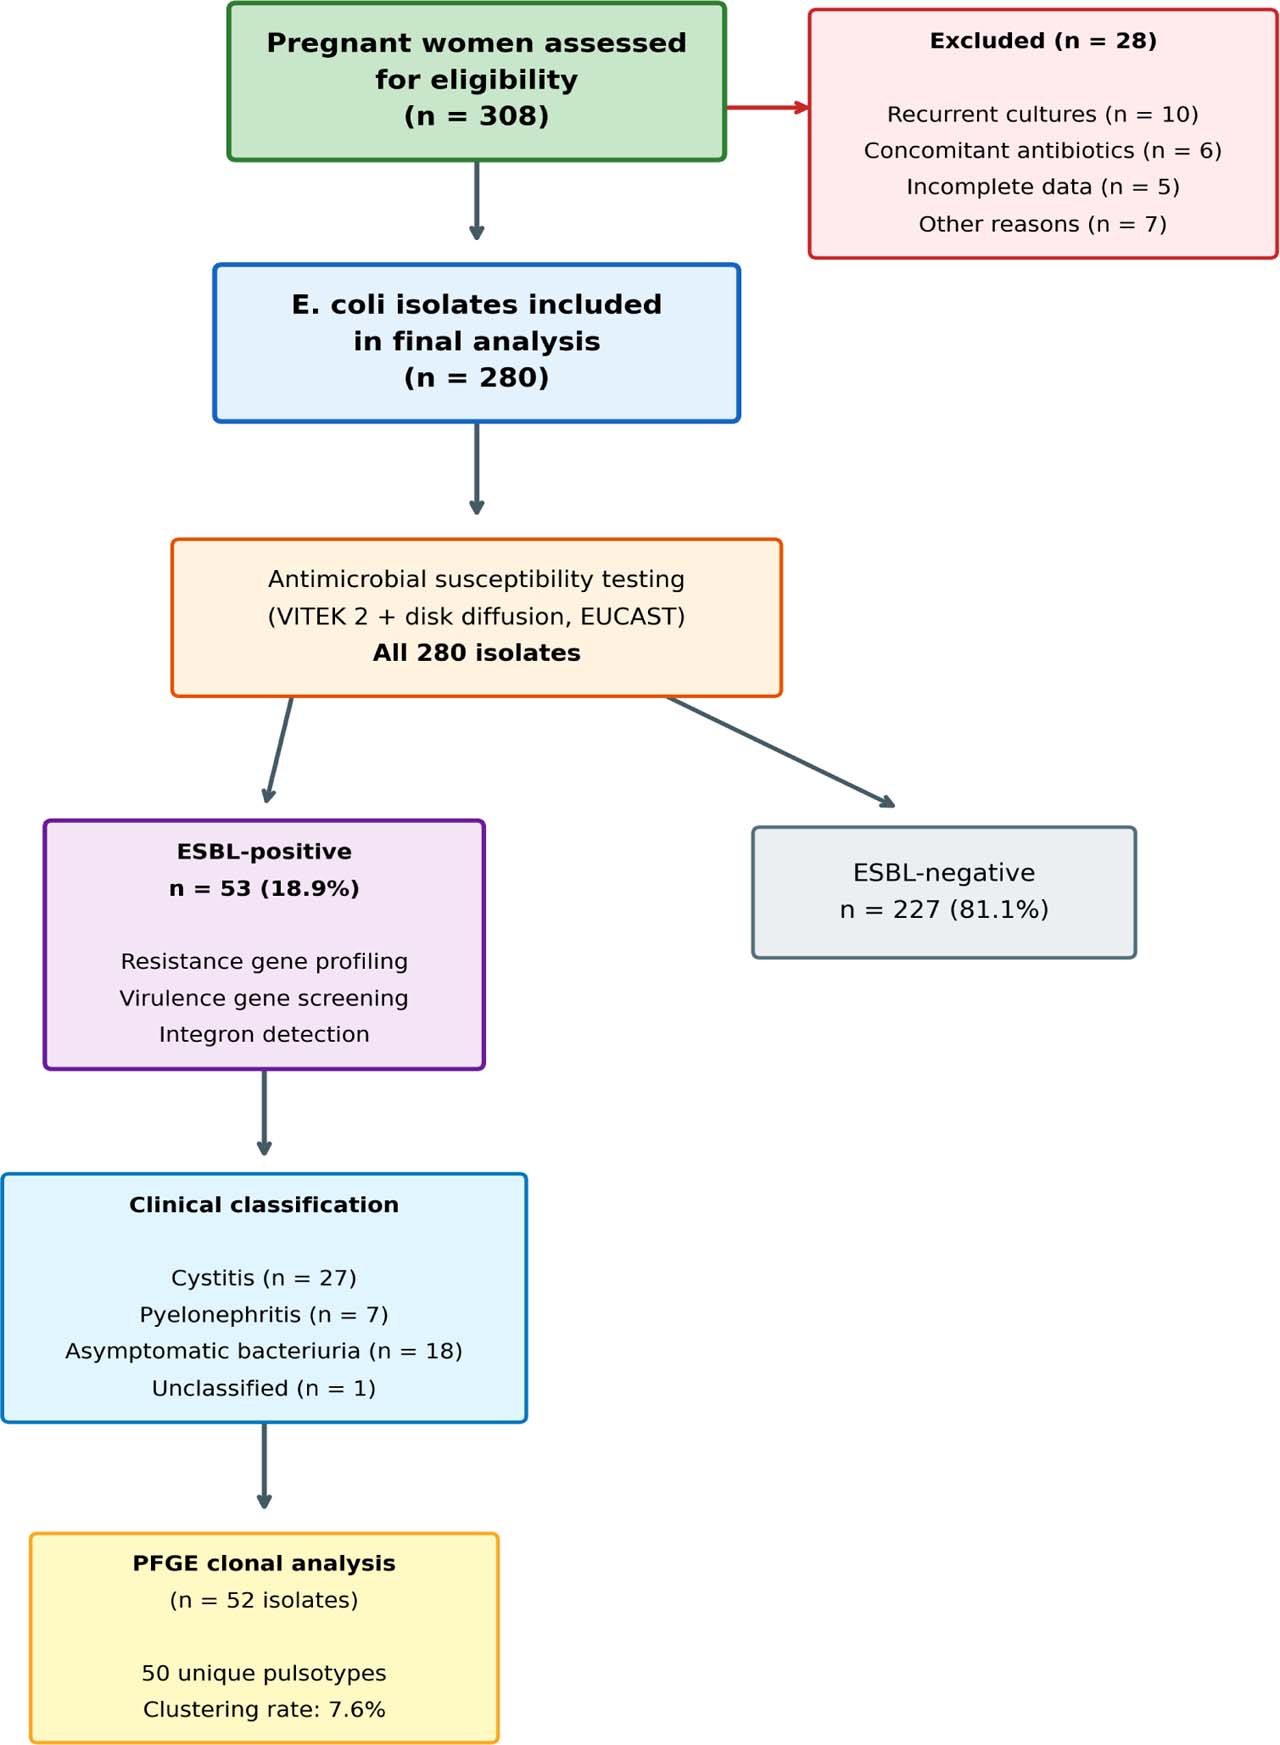
Fig. 1.
Study flow diagram showing enrollment, exclusions, and classification of 280 E. coli isolates from pregnant women with urinary tract infections. ASB, asymptomatic bacteriuria.
Table I
Primer sequences for antimicrobial resistance genes and integron gene cassettes.
| Primer | Sequence (5’-3’) | Amplicon (bp) | Tm | Ref |
|---|---|---|---|---|
| blaTEM-F | AGTATTCAACATTTYCGTGT | 847 | 56°C | Copur Cicek et al. 2013 |
| blaTEM-R | TAATCAGTGAGGCACCTATCTC | |||
| blaSHV-F | ATGCGTTATATTCGCCTGTG | 843 | 55°C | Copur Cicek et al. 2013 |
| blaSHV-R | TTAGCGTTGCCAGTGCTC | |||
| blaCTX-M1-F | GCGTGATACCACTTCACCTC | 260 | 55°C | Copur Cicek et al. 2013 |
| blaCTX-M1-R | TGAAGTAAGTGACCAGAATC | |||
| blaCTX-M2-F | TGATACCACCACGCCGCTC | 341 | 55°C | Copur Cicek et al. 2013 |
| blaCTX-M2-R | TATTGCATCAGAAACCGTGGG | |||
| blaIMP-F | CATGGTTTGGTGGTTCTTGT | 488 | 56°C | Copur Cicek et al. 2016 |
| blaIMP-R | ATAATTTGGCGGACTTTGGC | |||
| blaNDM-F | GAGATTGCCGAGCGACTTG | 497 | 57°C | Copur Cicek et al. 2016 |
| blaNDM-R | CGAATGTCTGGCAGCACACTT | |||
| blaVEB-F | ATTTCCCGATGCAAAGCGT | 542 | 55°C | Copur Cicek et al. 2016 |
| blaVEB-R | TTATTCCGGAAGTCCCTGT | |||
| blaVIM-F | ATTGGTCTATTTGACCGCGTC | 780 | 58°C | Copur Cicek et al. 2016 |
| blaVIM-R | TGCTACTCAACGACTGAGCG | |||
| blaPER-2-F | ATGAATGTCATCACAAAATG | 860 | 45°C | Copur Cicek et al. 2016 |
| blaPER-2-R | ATAATAGCTTCATTGGTTC | |||
| blaGES-F | ATGCGCTTCATTCACGCAC | 863 | 56°C | Copur Cicek et al. 2016 |
| blaGES-R | CTATTTGTCCGTGCTCAGGA | |||
| blaKPC-F | ATGTCACTGTATCGCCGTCT | 893 | 55°C | Copur Cicek et al. 2016 |
| blaKPC-R | TTTTCAGAGCCTTACTGCCC | |||
| intI-F | GGTCAAGGATCTGGATTTGG | 500 | 57°C | Machado et al. 2005 |
| intI-R | ACATGCGTGTAAATCATCGTC | |||
| intII-F | CACGGATATGCGACAAAAAGGT | 740 | 57°C | Machado et al. 2005 |
| intII-R | GTAGCAAACGAGTGACGAAATG | |||
| 5’-CS | GGCATCCAAGCAGCAAG | Variable | 55°C | Machado et al. 2005 |
| 3’-CS | AAGCAGACTTGACCTGA |
Table II
Primer sequences for uropathogenic virulence genes.
| Gene | Primer Sequence (5’-3’) | Amplicon (bp) | Tm | Ref |
|---|---|---|---|---|
| pap | F: GCAACAGCAACGCTGGTTGCATCAT | 336 | 63°C | (Arisoy et al. 2006) |
| R: AGAGAGAGCCACTCTTATACGGACA | ||||
| sfa | F: CTCCGGAGAACTGGGTGCATCTTAC | 410 | 63°C | (Arisoy et al. 2006) |
| R: CGGAGGAGTAATTACAAACCTGGCA | ||||
| cnf | F: AAGATGGAGTTTCCTATGCAGGAG | 498 | 63°C | (Arisoy et al. 2006) |
| R: CATTCAGAGTCCTGCCCTCATTATT | ||||
| aer | F: TACCGGATTGTCATATGCAGACCGT | 602 | 63°C | (Arisoy et al. 2006) |
| R: AATATCTTCCTCCAGTCCGGAGAAG | ||||
| afa | F: CGGCTTTTCTGCTGAACTGGCAGGC | 672 | 63°C | (Arisoy et al. 2006) |
| R: CCGTCAGCCCCCACGGCAGACC | ||||
| hly | F: AACAAGGATAAGCACTGTTCTGGCT | 1177 | 63°C | (Arisoy et al. 2006) |
| R: ACCATATAAGCGGTCATTCCCGTCA |
Table III
Antimicrobial resistance profiles: overall and stratified by ESBL status.
| Antibiotic | All (n=280) % | ESBL+ (n=53) % | ESBL− (n=227) % | p-value |
|---|---|---|---|---|
| Ampicillin | 75.3 | 100 | 69.6 | <0.001 |
| Amoxicillin-clavulanic acid | 43.9 | 50.9 | 42.3 | 0.323 |
| Cefuroxime | 24.6 | 100 | 7.0 | <0.001 |
| Cefotaxime | 20.7 | 100 | 2.2 | <0.001 |
| Ceftazidime | 19.2 | 100 | 0.4 | <0.001 |
| Ceftriaxone | 18.2 | 96.2 | 0.0 | <0.001 |
| Cefepime | 16.0 | 84.9 | 0.0 | <0.001 |
| Piperacillin-tazobactam | 9.3 | 47.2 | 0.4 | <0.001 |
| TMP-SMX | 26.4 | 67.9 | 16.7 | <0.001 |
| Ciprofloxacin | 34.2 | 52.8 | 30.0 | 0.003 |
| Nitrofurantoin | 3.2 | 17.0 | 0.0 | <0.001 |
| Fosfomycin | 2.1 | 9.4 | 0.4 | 0.001 |
| Gentamicin | 1.8 | 5.7 | 0.9 | 0.048 |
| Amikacin | 1.1 | 3.8 | 0.4 | 0.093 |
| Imipenem | 0 | 0 | 0 | -- |
| Meropenem | 0 | 0 | 0 | -- |
Table IV
Distribution of resistance genes and integron elements (n = 53).
| Gene / Element | n / 53 | % |
|---|---|---|
| blaCTX-M1 | 29 | 54.7 |
| blaCTX-M2 | 15 | 28.3 |
| blaTEM | 8 | 15.0 |
| blaSHV | 5 | 9.4 |
| intI (Class 1) | 20 | 37.7 |
| intII (Class 2) | 1 | 1.9 |
| 5’-CS / 3’-CS | 10 | 18.9 |
| hep51/hep74 | 0 | 0 |
Table V
Virulence genes stratified by clinical presentation (n = 52 classified + 1 unclassified).
| Gene | Total (n=53) | % | Cystitis (n=27) | Pyelonephritis (n=7) | ASB (n=18) | Unclassified (n=1) |
|---|---|---|---|---|---|---|
| aer | 20 | 37.7 | 13 (48.1) | 4 (57.1) | 3 (16.7) | 0 |
| sfa | 12 | 22.6 | 7 (25.9) | 4 (57.1) | 1 (5.6) | 0 |
| afa | 9 | 16.9 | 6 (22.2) | 3 (42.8) | 0 | 0 |
| pap | 9 | 16.9 | 7 (25.9) | 2 (28.5) | 0 | 0 |
| cnf | 1 | 1.9 | 0 | 0 | 1 (5.6) | 0 |
| hly | 0 | 0 | 0 | 0 | 0 | 0 |
Table VI
Virulence gene combinations among ESBL-positive isolates (n = 53).
| Gene combination | n | % |
|---|---|---|
| sfa + aer | 5 | 9.4 |
| sfa + pap | 5 | 9.4 |
| sfa + pap + aer | 1 | 1.9 |
| sfa + aer + cnf | 1 | 1.9 |
| afa only | 9 | 17.0 |
| No virulence gene | 17 | 32.1 |
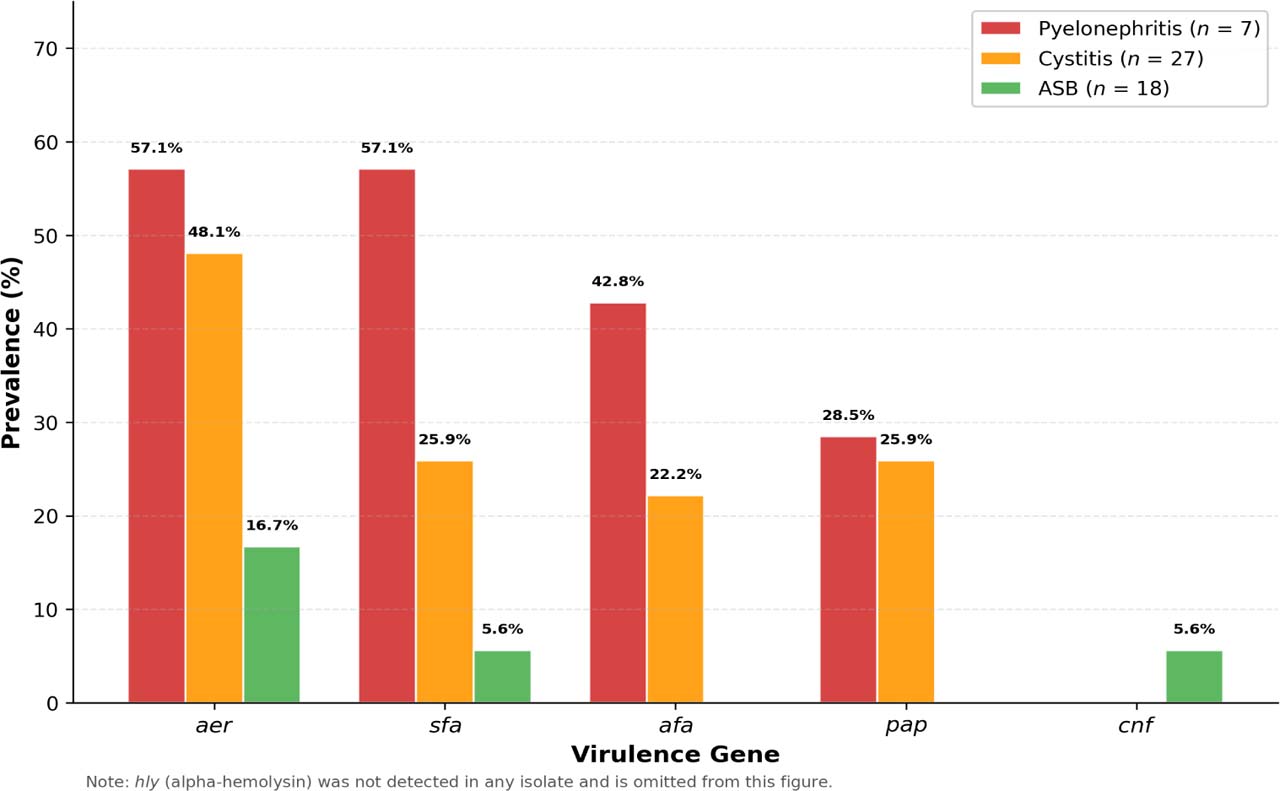
Fig. 2.
Virulence gene prevalence by clinical category. Note the consistently higher detection rates in pyelonephritis (n = 7) compared with cystitis (n = 27) and ASB (n = 18). hly was not detected and is omitted.
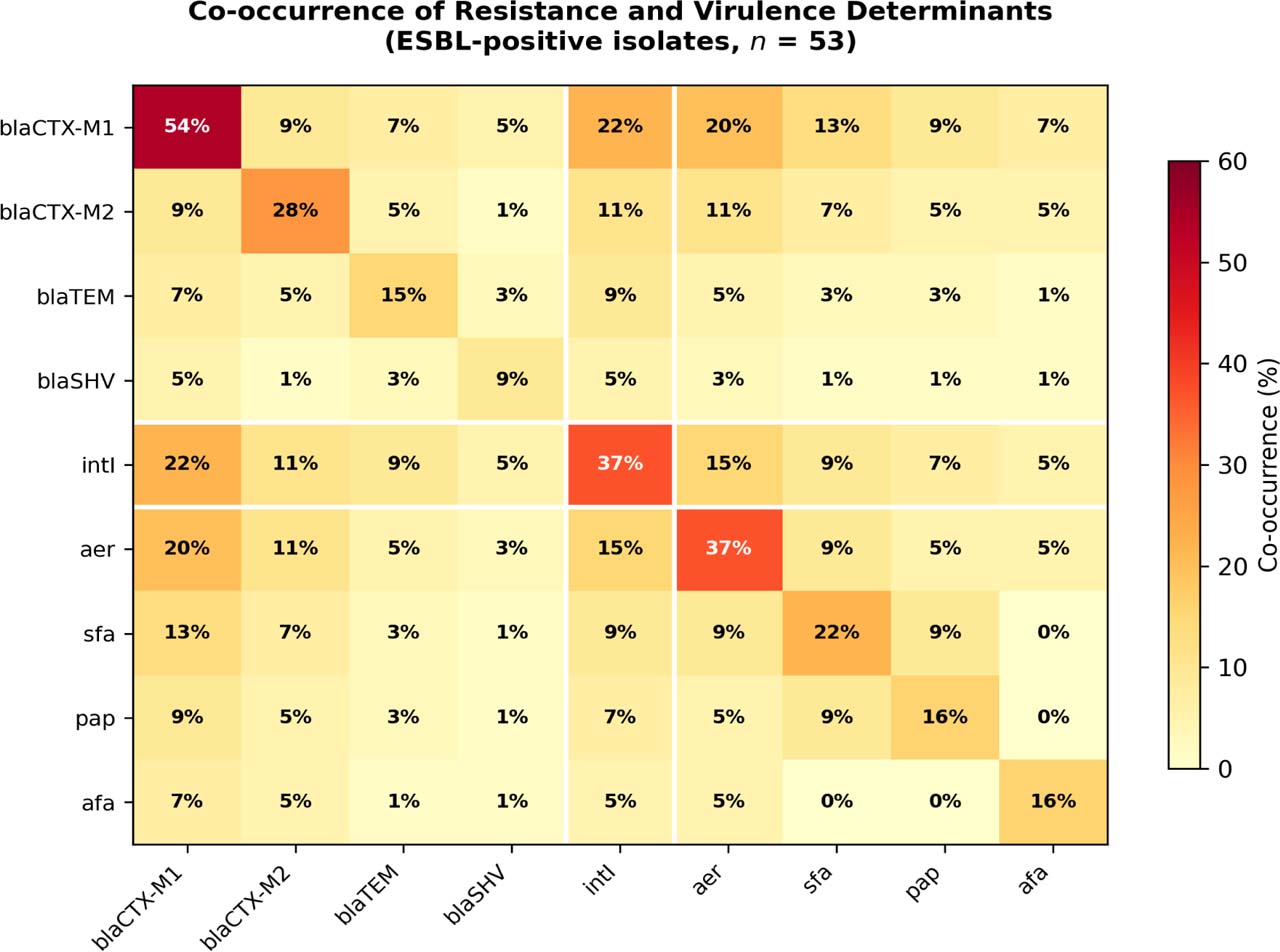
Fig. 3.
Heatmap showing co-occurrence of resistance genes, integron elements, and virulence factors among 53 ESBL-positive isolates. Values represent the percentage of isolates carrying both determinants simultaneously.
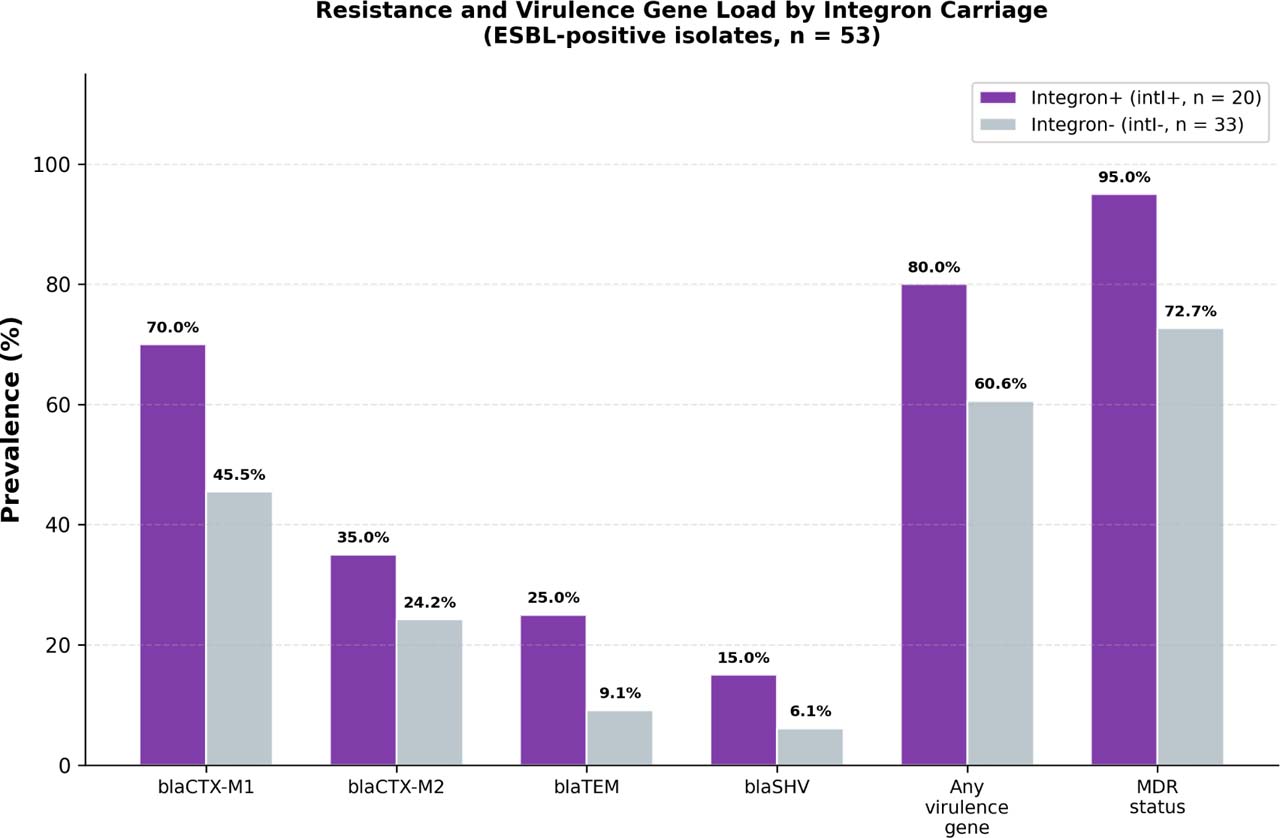
Fig. 4.
Comparison of resistance gene prevalence, virulence gene carriage, and MDR status between integron-positive (intI+, n = 20) and integron-negative (intI-, n = 33) ESBL-producing E. coli isolates. Integron-carrying isolates showed consistently higher gene loads across all categories.