
Table I
Taxonomic and sampling information of six medicinal plants.
| Plant number | Chinese Pinyin name | Latin name | Family | Genus |
|---|---|---|---|---|
| M1 | Zisu | Perilla frutescens (L.) Britt. | Lamiaceae | Perilla |
| M2 | Sangye | Folium Mori | Moraceae | Morus |
| M3 | Qinghao | Artemisia Annua L. | Asteraceae | Artemisia |
| M4 | Pipaye | Eriobotrya japonica (Thunb.) Lindl. | Rosaceae | Eriobotrya |
| M5 | Guizhi | Cinnamomi Ramulus | Lauraceae | Cinnamomum |
| M6 | Gancao | Glycyrrhiza uralensis Fisch. | Fabaceae | Glycyrrhiza |
Table II
Annotated statistics of sample species.
| Sample ID | Superkingdom | Phylum | Class | Order | Family | Genus | Species |
|---|---|---|---|---|---|---|---|
| M3-2 | 1030 | 1018 | 1016 | 987 | 929 | 661 | 208 |
| M6-4 | 842 | 835 | 831 | 812 | 757 | 519 | 170 |
| M2-2 | 274 | 274 | 274 | 271 | 257 | 207 | 26 |
| M2-4 | 215 | 214 | 213 | 205 | 197 | 150 | 34 |
| M1-3 | 189 | 189 | 187 | 184 | 176 | 153 | 16 |
| M4-5 | 109 | 109 | 109 | 108 | 104 | 85 | 11 |
| M4-4 | 96 | 96 | 96 | 95 | 87 | 76 | 16 |
| M6-5 | 104 | 103 | 102 | 98 | 90 | 69 | 14 |
| M6-3 | 81 | 81 | 81 | 80 | 75 | 64 | 11 |
| M4-3 | 60 | 60 | 60 | 58 | 54 | 51 | 4 |
| M3-4 | 54 | 53 | 53 | 53 | 46 | 39 | 5 |
| M5-4 | 39 | 39 | 38 | 38 | 34 | 28 | 2 |
| M2-3 | 34 | 34 | 34 | 33 | 29 | 24 | 5 |
| M3-3 | 20 | 20 | 20 | 19 | 14 | 13 | 3 |
| M5-3 | 17 | 17 | 17 | 17 | 13 | 10 | 0 |
| M1-4 | 15 | 15 | 15 | 15 | 12 | 10 | 1 |
| Total | 3179 | 3157 | 3146 | 3073 | 2874 | 2159 | 526 |
[i] Note: In the sample ID, the numbers M1 to M6 represent Perilla frutescens (L.) Britt., Folium Mori, Artemisia Annua L., Eriobotrya japonica (Thunb.) Lindl., Cinnamomi Ramulus, Glycyrrhiza uralensis Fisch., and the numbers -1 to -5 represent roots, stems, leaves, fruits, and flowers, respectively.
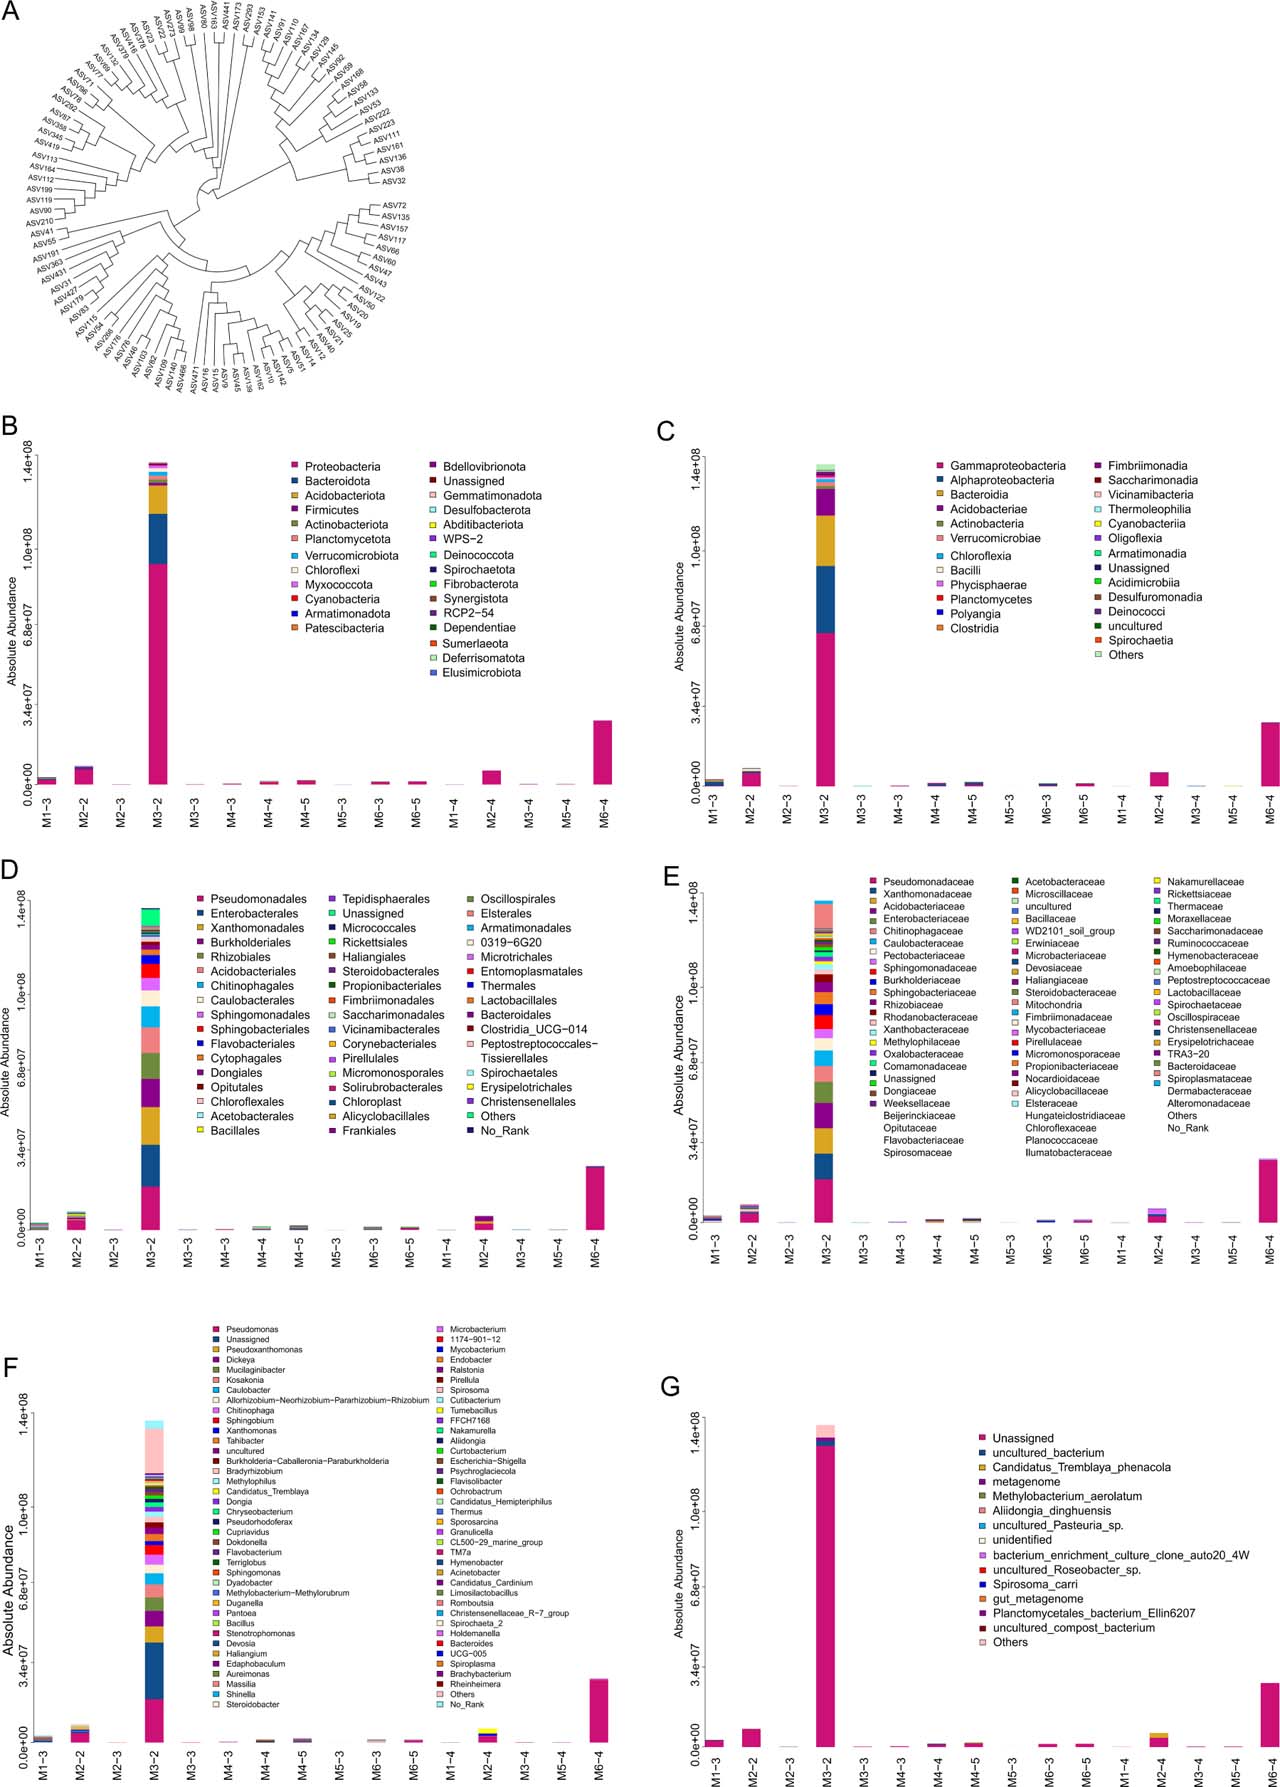
Fig. 1.
Analysis of endophytic bacterial community composition in six plant species.
(A) Phylogenetic tree of species based on the 100 ASV/OTU representative sequences with the highest abundance. Each branch in the evolutionary tree represents an ASV/OTU, and the length of the branch is the evolutionary distance between two ASVs. ASV/OTU on the same branch indicates that the evolutionary relationship is close. (B) Species distribution map at phylum level. (C) Species distribution map at class level. (D) Species distribution map at order level. (E) Species distribution map at family level. (F) Species distribution map genus level. (G) Species distribution map at species level.
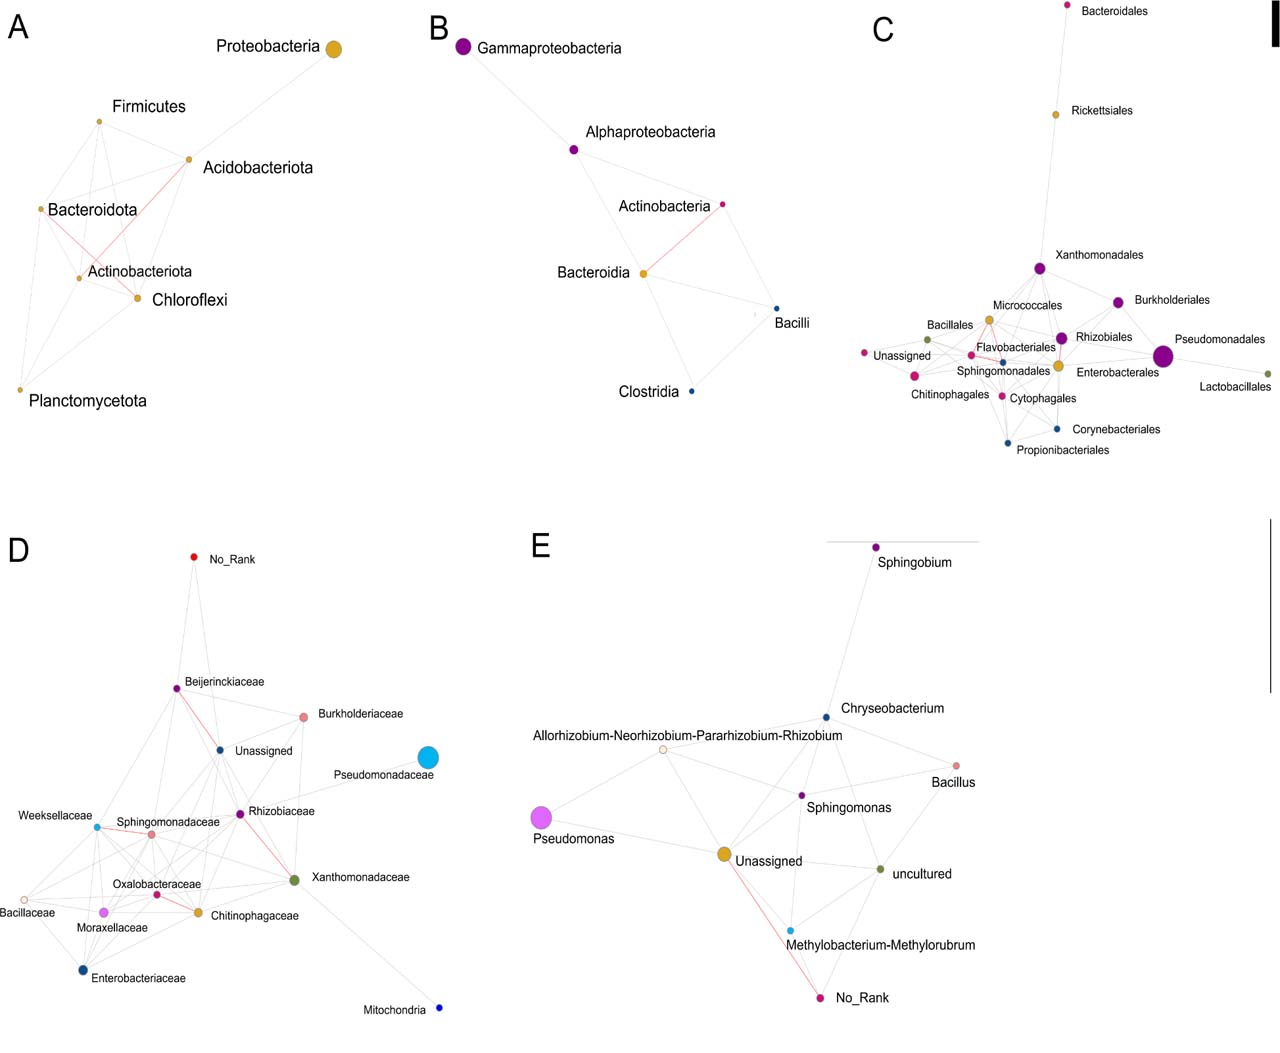
Fig. 2.
Map of dominant species network.
(A) phylum. (B) class. (C) order. (D) family. (E) genus. Each dot represents a species, the dot size is positively correlated with abundance, and different colours represent different species. The red line represents a strong positive correlation rho ≥ 0.6, the green line represents a strong negative correlation rho ≤ 0.6, and the grey line represents a weak correlation |rho| <0.6; Color-coded comments at the previous level.
Table III
Alpha diversity index.
| Samples | Observed | Chaol | Ace | Shannon | Simpson | Coverage |
|---|---|---|---|---|---|---|
| M3-2 | 1030 | 1037.03 | 1035.75 | 4.59 | 0.03 | 0.9998514 |
| M1-3 | 842 | 845.08 | 845.54 | 5.73 | 0.01 | 0.9994599 |
| M6-3 | 274 | 275.00 | 275.21 | 3.85 | 0.05 | 0.9999742 |
| M2-2 | 215 | 215.50 | 216.39 | 3.02 | 0.21 | 0.9995731 |
| M6-5 | 189 | 189.86 | 190.27 | 2.00 | 0.35 | 0.9999581 |
| M1-4 | 109 | 120.00 | 120.22 | 4.15 | 0.03 | 0.9995688 |
| M4-5 | 96 | 107.00 | 107.00 | 2.91 | 0.11 | 1.0000000 |
| M3-4 | 104 | 104.09 | 104.46 | 3.94 | 0.04 | 0.9985643 |
| M4-4 | 81 | 85.00 | 85.00 | 3.09 | 0.08 | 1.0000000 |
| M6-4 | 60 | 60.00 | 60.00 | 1.02 | 0.52 | 1.0000000 |
| M3-3 | 54 | 54.00 | 54.00 | 3.32 | 0.06 | 1.0000000 |
| M4-3 | 39 | 40.50 | 39.85 | 1.71 | 0.38 | 0.9980814 |
| M2-3 | 34 | 34.14 | 34.67 | 2.31 | 0.18 | 0.9973048 |
| M5-4 | 20 | 20.00 | 20.00 | 2.75 | 0.08 | 1.0000000 |
| M5-3 | 17 | 17.00 | 17.00 | 2.51 | 0.10 | 1.0000000 |
| M2-4 | 15 | 15.00 | 15.34 | 1.62 | 0.25 | 0.9993060 |
[i] Note: In the sample ID, the numbers M1 to M6 represent Perilla frutescens (L.) Britt., Folium Mori, Artemisia Annua L., Eriobotrya japonica (Thunb.) Lindl., Cinnamomi Ramulus, Glycyrrhiza uralensis Fisch., and the numbers -1 to -5 represent roots, stems, leaves, fruits, and flowers, respectively.
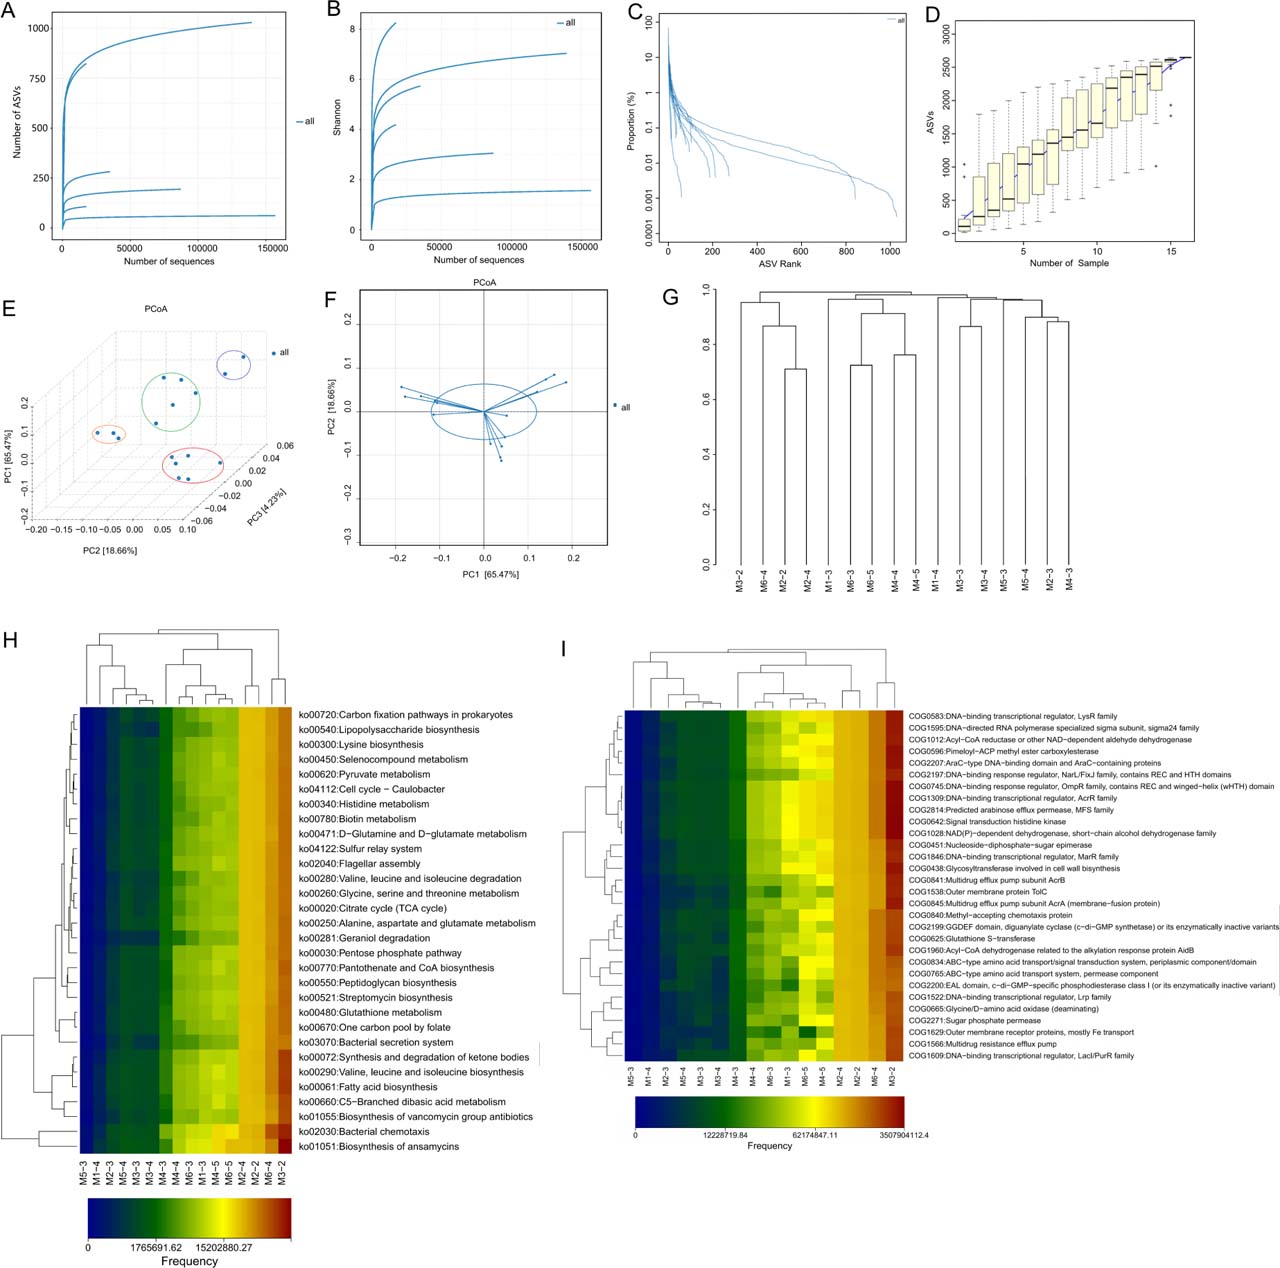
Fig. 3.
Microbiome and Metabolic Analysis Profiles.
(A) Dilution curve. (B) Shannon index curve. (C) Rank-abundance curve. (D) Species accumulation curve. (E and F) PCoA 3D diagram. (G) Multi-sample similarity tree. (H) Heat map of KEGG metabolic pathway difference analysis in each sample. (I) Thermal map of COG functional categories difference analysis for each sample.
Figure 4 Preparation of plate for the test of antibacterial activity of some strains. (A) Strains N513 and M6304. (B) Strain N5125.
Table IV
Bacteriostatic activity of purified strains and 16S identification results.
| Pathogenic bacteria | N513 | M6304 | N5125 | N5124 | N5117 | N5116 | N5133 | N5113 | N143-1 | N5112 | N515 |
|---|---|---|---|---|---|---|---|---|---|---|---|
| Foc1 | ++ | + | − | + | ++ | − | +++ | − | ++ | − | ++ |
| Foc4 | + | + | − | + | ++ | − | ++ | − | +++ | − | − |
| Pearl plum botryosphaeria dothidea | ++ | + | ++ | + | ++ | ++ | ++ | +++ | +++ | ++ | − |
| Citrus japonica Thunb. botryosphaeria dothidea | + | + | ++ | + | ++ | ++ | + | +++ | +++ | ++ | − |
| Alternaria alternata | +++ | + | ++ | ++ | − | ++ | +++ | ++ | +++ | − | |
| Pearl plum anthrax | + | + | ++ | ++ | − | ++ | + | ++ | +++ | + | − |
| Banana anthrax | − | − | ++ | − | ++ | ++ | − | ++ | − | + | − |
| Mango anthrax | + | + | ++ | ++ | − | + | + | + | +++ | ++ | − |
| Fusarium oxysporum | + | − | + | + | +++ | − | + | − | ++ | − | − |
| Fusarium fujikuroi | − | − | − | − | ++ | − | − | − | ++ | − | − |
| Fusarium solani | − | − | − | − | − | − | − | − | − | − | |
| Bacillus subtilis | + | − | ++ | +++ | ++ | + | + | +++ | − | − | − |
| Bacterium paratyphosum B | − | − | − | − | − | − | − | ++ | − | − | − |
| Typhoid bacillus | − | − | − | − | − | − | − | − | + | − | |
| Staphylococcus aureus | + | − | + | + | ++ | + | − | + | + | − | − |
| Staphylococcus aureus (methicillin-resistant) | + | − | + | − | +++ | + | +++ | − | ++ | − | − |
| Pseudomonas aeruginosa | + | − | − | − | − | − | − | − | − | − | + |
| Escherichia coli | + | − | ++ | +++ | ++ | + | + | + | − | − | − |
| Candida albicans | − | + | ++ | − | − | + | − | +++ | − | − | − |
| Inhibitory quantity | 13 | 13 | 12 | 11 | 11 | 11 | 11 | 11 | 10 | 7 | 2 |
| A strong positive number | 1 | 0 | 0 | 2 | 2 | 0 | 2 | 4 | 5 | 1 | 0 |
| Streptomyces telluris | Streptomyces racemochromogenes | Streptomyces globosus | Streptomyces spectabilis | Streptomyces spectabilis | Streptomyces globosus | Streptomyces telluris | Streptomyces globosus | Bacillus altitudinis | Streptomyces goshikiensis | Streptomyces telluris |
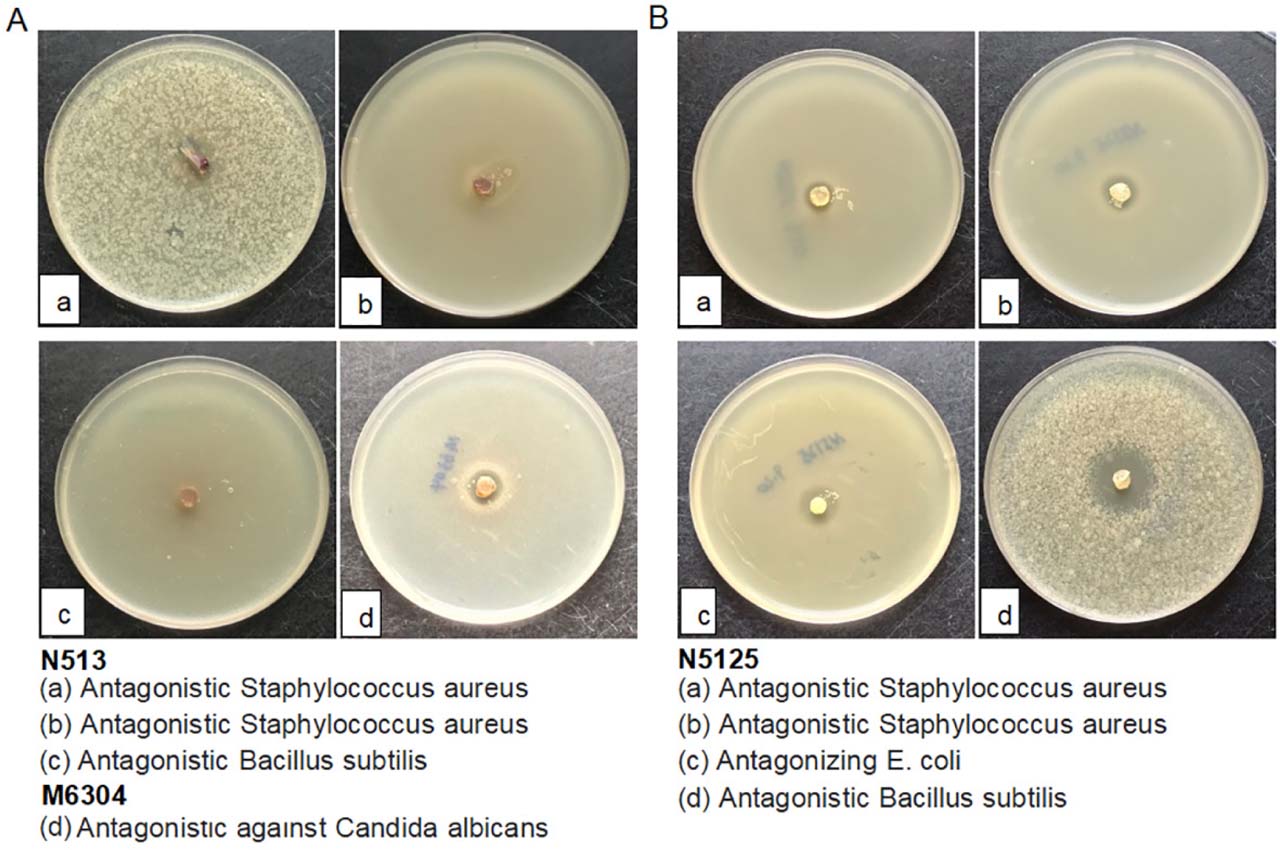
Figure 4
Preparation of plate for the test of antibacterial activity of some strains. (A) Strains N513 and M6304. (B) Strain N5125.
Table V
Correlation between metabolites and pathogenic bacteria.
| Metabolite | Pathogen | ρ | P value | FDR |
|---|---|---|---|---|
| N-Acetyl-L-glutamine | Botryosphaeria dothidea (in relation to kumquat) | 0.944250 | 0.000004 | 0.000069 |
| N6-Acetyl-L-lysine | Botryosphaeria dothidea (in relation to kumquat) | 0.899815 | 0.000067 | 0.001207 |
| (3R)-beta-Leucine | Candida albicans | 0.857618 | 0.000361 | 0.006499 |
| 5-Acetamidovalerate | Methicillin-resistant Staphylococcus aureus (MRSA) | 0.846711 | 0.000512 | 0.009221 |
| Leucine | Candida albicans | 0.845869 | 0.000526 | 0.009463 |
| Agmatine | Colletotrichum rnusae (causing banana anthracnose) | 0.839719 | 0.000632 | 0.011383 |
| 2-Furoate | Fusarium oxysporum f. sp. cubense race 1 (causing banana wilt) | 0.836569 | 0.000693 | 0.012476 |
| 6-Hydroxyhexanoic acid | Colletotrichum gloeosporioides (in relation to Zhenzhu plum causing anthracnose) | 0.833162 | 0.000764 | 0.013748 |
| p-Hydroxyphenylacetic acid | Botryosphaeria dothidea (in relation to kumquat) | 0.833162 | 0.000764 | 0.013748 |
| D-Alanyl-D-alanine | Colletotrichum rnusae (causing banana anthracnose) | 0.824452 | 0.000970 | 0.017459 |