
Introduction
Medicinal plants are abundant in various chemical components with natural pharmacological activities and can be utilized to treat and alleviate numerous diseases (Luthra and Roy 2022). For instance, Zisu (Perilla frutescens (L.) Britt.), Sangye (Folium Mori), Huang-huahao (Artemisia Annua L.), Pipaye (Eriobotrya japonica (Thunb.) Lindl.), Guizhi (Cinnamomi Ramulus), and Gancao (Glycyrrhiza uralensis Fisch.) have all been reported to have anti-inflammatory and antibacterial biological activities and have significant application potential in the intervention of respiratory system diseases, infectious diseases, and inflammation-related diseases (Jia et al. 2023; Karoutzou and Skaltsounis 2026; Thacharoen et al. 2025; Zhang et al. 2023; Zhou et al. 2019). These plants also represent different taxonomic origins and medicinal functions, providing a broad and representative basis for investigating endophytic bacterial diversity and bioactive potential. In recent years, increasing attention has been paid to endophytic bacteria associated with medicinal plants, and a wide diversity of bacteria has been isolated from different host species, highlighting their potential as important sources of bioactive metabolites.
An endophyte refers to fungi or bacteria that colonize plant tissues and organs at certain or all stages (Li et al. 2023). They can produce the same or similar compounds and new secondary metabolites as the host. These substances exhibit rich diversity and play a role in promoting host plant growth, resisting diseases and pests, and degrading toxic and harmful compounds. Many researchers have isolated endophytes from the roots, stems, leaves, and other tissues of medicinal plants that can produce the same or similar medicinal active ingredients as the host (Maehara et al. 2023; Muthukrishnan et al. 2022). Endophytic bacteria and their secondary metabolites are of great significance for the discovery of new antibiotics, anti-cancer drugs, and many alternative drugs effective against human, animal, or plant diseases (Kandasamy and Kathirvel 2023). Therefore, studying the types of endophytic bacteria in medicinal plants, screening for secondary metabolites with pharmacological activity, and further elucidating their synthesis pathways and regulatory mechanisms are of great value for large-scale fermentation production of medicinal active substances by endophytic bacteria and for overcoming the original limitations of medicinal plants.
The living space of endophytic bacteria is stable, enabling them to divide, reproduce, and transmit independently. The active ingredients produced by endophytic bacteria show excellent development value in the fields of medicine, agriculture, and industrial fermentation. In recent years, the topic of endophytic bacteria in medicinal plants has received considerable attention. However, previous studies have predominantly focused on endophytic fungi, while investigations on endophytic bacteria have largely been limited to isolation and taxonomic diversity profiling (Waqar et al. 2024). Although numerous studies have reported the presence and diversity of endophytic bacteria in medicinal plants, quantitative characterization of their community structure (e.g., absolute abundance) and the integration of metabolomic data with functional antimicrobial activity remain relatively scarce. Consequently, the functional roles of these bacterial communities and their contributions to bioactive metabolite production are still not fully understood.
Based on this, this study isolated the endophytic bacteria from six types of traditional Chinese medicinal plants with anti-inflammatory effects (Perilla frutescens (L.) Britt., Folium Mori, Artemisia Annua L., Eriobotrya japonica (Thunb.) Lindl., Cinnamomi Ramulus, Glycyrrhiza uralensis Fisch.) and conducted high-throughput sequencing, antibacterial activity detection, and strain identification. These host plants differ markedly in their phytochemical profiles and ecological niches, which may impose distinct selective pressures on their associated endophytic bacterial communities. We hypothesize that such host-specific chemical environments, particularly those enriched in bioactive and anti-inflammatory compounds, can shape the diversity and functional potential of endophytic bacteria, including their capacity to produce antimicrobial metabolites. By integrating microbial diversity analysis with functional and metabolomic characterization, this study aims to explore the relationship between host plant chemistry and endophyte-associated antimicrobial potential, thereby providing insights into the ecological basis of endophyte-derived bioactive compounds.
Experimental
Materials and Methods
Experimental materials and instruments
In August 2023, six medicinal plant species, including Zisu (Perilla frutescens (L.) Britt.), Sangye (Folium Mori), Qinghao (Artemisia Annua L.), Pipaye (Eriobotrya japonica (Thunb.) Lindl.), Guizhi (Cinnamomi Ramulus), Gancao (Glycyrrhiza uralensis Fisch.), were collected and designated as (M1, M2, M3, M4, M5, M6), and their plant tissues, including roots, stems, leaves, fruits, and flowers were further sampled and labeled as (-1, -2, -3, -4, -5). The picked plants were fresh, mature, healthy, and free from diseases. Subsequently, they were kept fresh and processed within 48 h. Not all plant tissue types were collected from each plant species; instead, tissues were selected based on their medicinal relevance. Each tissue type was treated as an independent sample, resulting in a total of 16 samples across the six plant species.
Drugs and reagents
Nineteen common pathogenic bacteria, such as FOC1 of Banana wilt, FOC4 of banana wilt, and Coelomium gluconoides of pearl plum (Guangdong Provincial Microbial Culture Preservation Center). 75% ethanol, 0.1% mercuric chloride solution, and 10% sodium hypochlorite solution (Wuhan Xinzhongke Chemical Co., LTD.). Bacterial genome DNA extraction kit (Tiangen Biochemical Technology Co., LTD.). Disposable needle filter (0.22 μm, 13mm, for water, Filer Technology Co., LTD.). Biochemical incubator (BSP-250, Shanghai Bosun Industrial Co., LTD., Medical Equipment Factory). Vertical pressure steam sterilizer (BKQ-Z30I, Boke Biotechnology Co., LTD.). Spectrophotometer (UV-1800 type, Mepida Instrument Co., LTD.). Constant temperature shaking table (BTY-170ASH, YingZhida Instrument Co., LTD.). A high-speed refrigerated centrifuge (TGL16A, Yancheng Kite Experimental Instrument Co., LTD.) was also utilized in the previous experiment.
Isolation of endophytic bacteria from plants
Endophytic bacteria were isolated from six medicinal plant species using a surface sterilization–based tissue segment method with minor optimization according to previous reports (Srivastava and Chaturvedi 2022). All procedures were performed under aseptic conditions in a laminar flow hood. Sterile instruments including scissors, scalpels, forceps, and glassware were used throughout the experiment.
Plant samples were first washed thoroughly under running tap water to remove surface soil and debris, and visibly damaged tissues were discarded. Subsequently, plant materials (flowers, stems, leaves, and roots) were cut into approximately 0.5 cm × 0.5 cm segments. Surface sterilization was performed sequentially as follows: tissues were immersed in 75% ethanol for 3 min and rinsed three times with sterile distilled water. Soft tissues (flowers, stems, and leaves) were then treated with 10% sodium hypochlorite for 3 min, while woody root tissues were treated with 0.1% mercuric chloride for 30 s. The shorter exposure time for woody root tissues was selected to balance effective removal of surface-associated microorganisms with the preservation of internal tissue integrity and viability of endophytic bacteria, as prolonged exposure to mercuric chloride may penetrate dense tissues and reduce endophyte recovery. All samples were finally rinsed three times with sterile distilled water to remove residual sterilizing agents. The effectiveness of surface sterilization was confirmed using the imprinting method, in which sterilized tissue segments were pressed onto Luria–Bertani (LB) agar plates. The absence of microbial growth on imprint plates after incubation indicated successful removal of epiphytic microorganisms. In addition, sterilized plant tissues were incubated in sterile water with gentle shaking for 3 h as an additional sterility control. The absence of microbial growth in the incubation medium further confirmed the effectiveness of surface sterilization. To ensure that the sterilization procedure did not excessively compromise internal tissue viability, the emergence of endophytic bacterial colonies from sterilized segments during subsequent incubation was used as an indirect indicator of tissue integrity and endophyte survival.
For endophytic bacterial isolation, sterilized tissue segments were aseptically placed onto LB agar plates and incubated at 37°C for 48 h. Emerging colonies were selected based on morphological differences and further purified by repeated streaking on LB agar plates. Pure isolates were then transferred into LB broth and cultured at 37°C for 48 h for subsequent experiments.
Absolute quantitative sequencing of Accu16STM bacteria
The method in the bacterial DNA extraction kit was followed to extract the DNA. Using the extracted DNA template, we commissioned Genesky Biotechnologies Inc., Shanghai, to carry out absolute quantitative sequencing of Accu16STM bacteria previously.
The method for detecting the extracted genomic DNA was as follows. (1) Genomic DNA integrity was detected by agarose gel electrophoresis: visible electrophoresis bands without obvious degradation; (2) Qubit quantitative detection of genomic DNA quality: the concentration was standardized to 10 ng/μl, and the total amount was ≥500 ng; (3) Sample PCR preamplification test (e.g V4, V5): For the sample DNA template (standardized) in the absence of spik-in internal reference DNA, high-fidelity PCR pre-amplification was carried out on the sample detection area, and standard bacterial genomic DNA mix was used as a positive control. The amplified products were detected by agarose gel electrophoresis (Wittmeier and Hummel 2022), and the samples with qualified DNA quality control and successful PCR amplification were considered qualified. Amplification primers were determined according to the selected detection area, and the specific sequence was as follows:
Primer F = Illumina adapter sequence 1+ GTGCCAGCMGCCGCGG
Primer R = Illumina adapter sequence 2+ CCGTCAATTCMTTTRAGTTT
Adapter sequence1 = CTGTCTCTTATACACATCTCCGAGCCCACGAGAC
Adapter sequence2 = CTGTCTCTTATACACATCTGACGCTGCCGACGA
Sample DNA (the concentration was uniformly standardized to 10 ng/μl, and the total amount was ≥500 ng) and spik-in internal reference DNA were added into the same PCR amplification system as PCR amplification templates. For the amplification of the target region of the sample, an appropriate proportion of spik-IN internal reference DNA was added to each sample, and positive control samples were set up.
The analysis indexes mainly included:
(1) Species annotation and taxonomic analysis (Jabborova et al. 2026), encompassing the characterization of microbial community composition, species abundance, and community structure at the phylum, class, order, family, genus, and species levels;
(2) Diversity analysis, including alpha diversity indices and beta diversity assessment across samples;
(3) Functional gene prediction analysis (Hajieghrari and Niazi 2023), including phylogenetic tree construction and functional gene composition profiling.
Determination, screening, and identification of the bacteriostatic activity of strains
We inoculated the isolated endophytic bacterial strains into LB medium and cultured them at 37°C and 200 r/min for 24 h to obtain the fermentation liquid of the bacteria for testing. Then we centrifuged (conditions: 4°C, 10000 r/min, 10 min) the fermentation solution and filtered the supernatant with a 0.22 μm filter on a super-clean bench to obtain a sterile fermentation filtrate. To further exclude strain-independent inhibitory effects, the cell-free fermentation filtrate of Escherichia coli K-12 (a non-antibacterial reference strain) was prepared under identical culture conditions and included as an additional negative biological control. The pH of all sterile fermentation filtrates was measured prior to antibacterial assays to exclude the potential influence of acidity on bacterial growth, and no significant differences were observed among samples.
A total of 19 pathogenic microorganisms, including Fusarium oxysporum f. sp. cubense Race 1 (FOC1), Fusarium oxysporum f. sp. cubense Tropical Race 4 (FOC4), Botryosphaeria dothidea (from Prunus salicina), B. dothidea (from Fortunella margarita), Alternaria alternata, Colletotrichum gloeosporioides (from Prunus salicina), Colletotrichum musae, Colletotrichum gloeosporioides (from mango), Fusarium oxysporum, Fusarium fujikuroi, Fusarium solani, Bacillus subtilis, Salmonella enterica subsp. enterica serovar Paratyphi B, Salmonella enterica subsp. enterica serovar Typhi, Staphylococcus aureus, Methicillin-resistant Staphylococcus aureus (MRSA), Pseudomonas aeruginosa, Escherichia coli, and Candida albicans were used as indicator strains. For antibacterial assays, 3 ml of LB broth containing 1% (v/v) pathogen inoculum was supplemented with 300 μl of sterile fermentation filtrate (treatment group). For the negative control, an equal volume of sterile LB medium was added instead of fermentation filtrate. All assays were performed in triplicate. Cultures were incubated at 37°C with shaking at 200 rpm for 18 h, and microbial growth was quantified by measuring optical density at 600 nm (OD600). The antibacterial activity was calculated as follows: antibacterial rate (%) = (A0 − A1) / A0 × 100 (Liu et al. 2023), where A0 represents the OD600 of the control group and A1 represents that of the treatment group.
For fungal pathogens and C. albicans, growth inhibition was preliminarily evaluated under similar liquid culture conditions by monitoring changes in optical density. However, it should be noted that this approach provides only an initial indication of antifungal activity and does not represent a standardized quantitative method such as radial growth inhibition assays on potato dextrose agar (PDA) or dry mycelial weight determination. Therefore, the antifungal results in this study should be interpreted as preliminary screening outcomes.
An antibacterial rate of ˂ 50% was evaluated as negative (denoted as “-”). ≥ 50% was evaluated as antibacterial positive, with 50% to 75% marked as “+” (positive), > 75% to ˂90% marked as “++” (medium positive), and ≥ 90% marked as “+++” (strong positive). Finally, 16S rRNA gene sequencing was used for bacterial identification. Fungal isolates were identified based on sequencing of the internal transcribed spacer (ITS) region, which is the standard molecular marker for fungal taxonomy.
Analysis of antibacterial substances in the metabolites of purified strain fermentation supernatant
Fifty milliliters of fermentation supernatant from purified strains were subjected to sample pretreatment using a C18 solid-phase extraction (SPE) column (500 mg/3 ml). The column was first activated and equilibrated, and the sample was loaded at a flow rate of 5 ml/min. The column was subsequently washed with 5 ml of ultrapure water and 5 ml of 5% methanol aqueous solution to remove polar impurities. Target metabolites were then eluted with 5 ml methanol. The eluates were collected and evaporated to dryness under a gentle nitrogen stream at 40°C. The dried residues were reconstituted in 1 ml methanol–water (1:1, v/v), filtered through a 0.22 μm membrane filter, and transferred to autosampler vials for further analysis.
Metabolite profiling was performed using ultra-high-performance liquid chromatography coupled with mass spectrometry (UPLC–MS). The analysis was performed using an Orbitrap Exploris 120 UHPLC–Q-Orbitrap mass spectrometer (Thermo Fisher Scientific, USA). HPLC–Q-Orbitrap MS/MS analysis was performed using an ultra-high-performance liquid chromatography system coupled with a high-resolution Orbitrap mass spectrometer. Chromatographic separation was achieved on a Waters ACQUITY UPLC HSS T3 column (2.1 mm × 100 mm, 1.8 μm). The mobile phase consisted of solvent A (acetonitrile containing 0.1% formic acid) and solvent B (water containing 0.1% formic acid). The gradient elution program was set as follows: 0–2 min, 5% A; 2–42 min, 5–95% A; 42–47 min, 95% A; 47–47.1 min, 95–5% A; and 47.1–50 min, 5% A for re-equilibration. The flow rate was maintained at 0.3 ml/min, the column temperature was set at 35°C, and the injection volume was 5 μl. Mass spectrometric detection was carried out using an electrospray ionization (ESI) source operating in both positive (+3.5 kV) and negative (−2.5 kV) ion modes. The capillary temperature was set at 320°C, and the auxiliary gas heater temperature was 350°C. The sheath gas and auxiliary gas flow rates were 35.51 l/min and 10.54 l/min, respectively. Data were acquired in Full MS/dd-MS2 mode, with a resolution of 70,000 for full scan MS and 17,500 for MS/MS. The scan range was set from m/z 100 to 1500, with maximum injection times of 100 ms for Full MS and 50 ms for MS/MS. The acquired data was processed using Xcalibur software. Compound identification was performed by comparing the obtained spectra with databases including mzVault, mzCloud, ChemSpider, and MassList.
Statistical analysis
For the correlation analysis between metabolites of purified strains and pathogenic bacteria and fungi, the standardized metabolite abundances (using the Z-score method) and antibacterial scores (scored on a 0-3 scale) of pathogenic bacteria were integrated. Spearman’s rank correlation analysis was employed to evaluate the associations between metabolites and pathogenic bacteria. After calculating the correlation coefficient (ρ) and P-value for each pair, the Benjamini-Hochberg method was used to correct for false positives in multiple tests (with a false discovery rate, FDR < 0.1). The screening criteria for antibacterial metabolites were set as an uncorrected P-value < 0.001 and ρ > 0.5.
Results
Analysis of endophytic bacterial community composition in six plant species
Statistics on species annotation at each taxonomic level based on the classification table of ASV/OTU absolute copy number
The classification and sampling information of the six medicinal plants are shown in Table I. The number of species types in each class (superkingdom, phylum, class, order, family, genus, species) of M3-2, M6-4, and M2-2 samples was relatively higher (Table II). Phylogenetic trees are trees that indicate evolutionary relationships between species thought to share a common ancestor, where each node represents the closest common ancestor of its branches, and the length of the line segments between nodes corresponds to evolutionary distances, based on the 100 ASV/OTU representative sequences with the highest abundance (Fig. 1A).
Table I
Taxonomic and sampling information of six medicinal plants.
| Plant number | Chinese Pinyin name | Latin name | Family | Genus |
|---|---|---|---|---|
| M1 | Zisu | Perilla frutescens (L.) Britt. | Lamiaceae | Perilla |
| M2 | Sangye | Folium Mori | Moraceae | Morus |
| M3 | Qinghao | Artemisia Annua L. | Asteraceae | Artemisia |
| M4 | Pipaye | Eriobotrya japonica (Thunb.) Lindl. | Rosaceae | Eriobotrya |
| M5 | Guizhi | Cinnamomi Ramulus | Lauraceae | Cinnamomum |
| M6 | Gancao | Glycyrrhiza uralensis Fisch. | Fabaceae | Glycyrrhiza |
Table II
Annotated statistics of sample species.
| Sample ID | Superkingdom | Phylum | Class | Order | Family | Genus | Species |
|---|---|---|---|---|---|---|---|
| M3-2 | 1030 | 1018 | 1016 | 987 | 929 | 661 | 208 |
| M6-4 | 842 | 835 | 831 | 812 | 757 | 519 | 170 |
| M2-2 | 274 | 274 | 274 | 271 | 257 | 207 | 26 |
| M2-4 | 215 | 214 | 213 | 205 | 197 | 150 | 34 |
| M1-3 | 189 | 189 | 187 | 184 | 176 | 153 | 16 |
| M4-5 | 109 | 109 | 109 | 108 | 104 | 85 | 11 |
| M4-4 | 96 | 96 | 96 | 95 | 87 | 76 | 16 |
| M6-5 | 104 | 103 | 102 | 98 | 90 | 69 | 14 |
| M6-3 | 81 | 81 | 81 | 80 | 75 | 64 | 11 |
| M4-3 | 60 | 60 | 60 | 58 | 54 | 51 | 4 |
| M3-4 | 54 | 53 | 53 | 53 | 46 | 39 | 5 |
| M5-4 | 39 | 39 | 38 | 38 | 34 | 28 | 2 |
| M2-3 | 34 | 34 | 34 | 33 | 29 | 24 | 5 |
| M3-3 | 20 | 20 | 20 | 19 | 14 | 13 | 3 |
| M5-3 | 17 | 17 | 17 | 17 | 13 | 10 | 0 |
| M1-4 | 15 | 15 | 15 | 15 | 12 | 10 | 1 |
| Total | 3179 | 3157 | 3146 | 3073 | 2874 | 2159 | 526 |
[i] Note: In the sample ID, the numbers M1 to M6 represent Perilla frutescens (L.) Britt., Folium Mori, Artemisia Annua L., Eriobotrya japonica (Thunb.) Lindl., Cinnamomi Ramulus, Glycyrrhiza uralensis Fisch., and the numbers -1 to -5 represent roots, stems, leaves, fruits, and flowers, respectively.
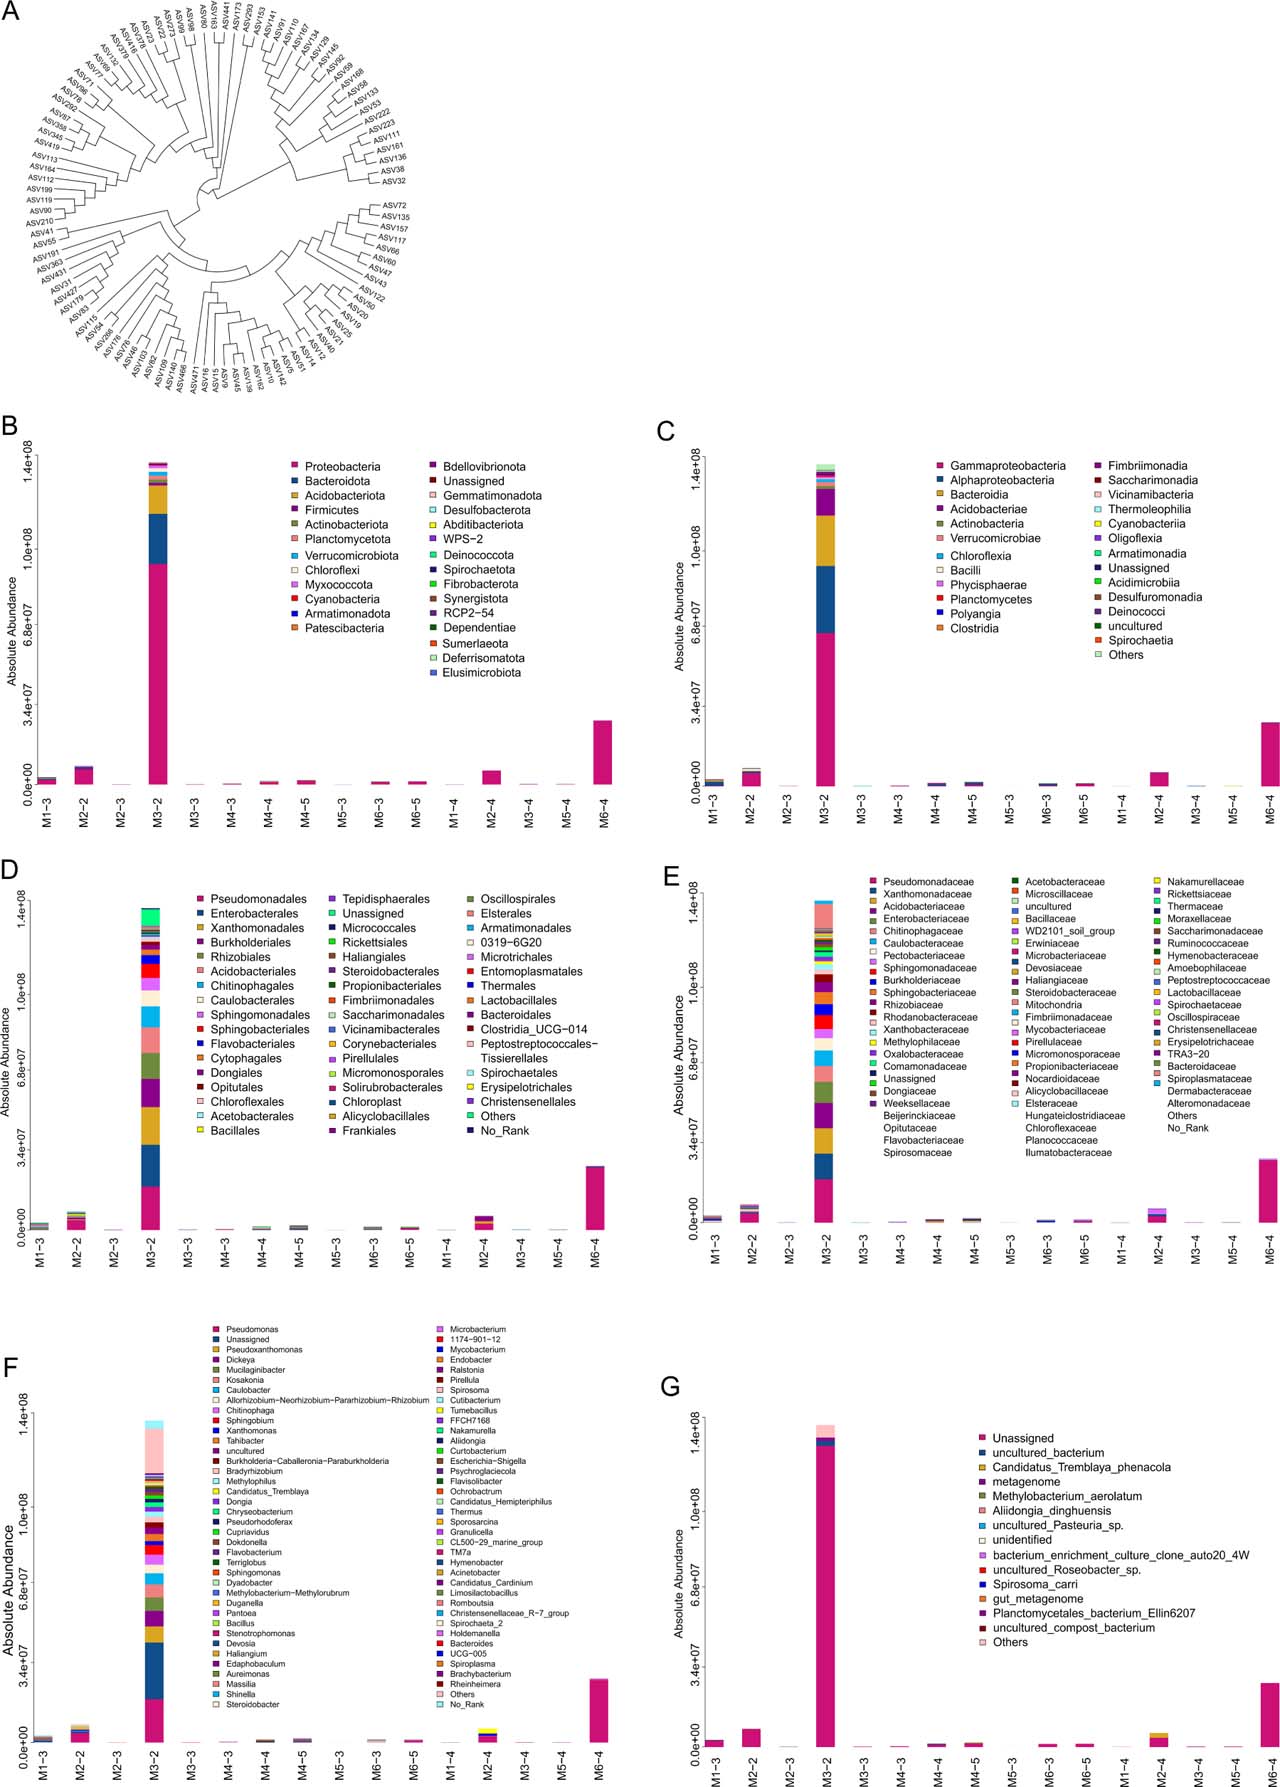
Fig. 1.
Analysis of endophytic bacterial community composition in six plant species.
(A) Phylogenetic tree of species based on the 100 ASV/OTU representative sequences with the highest abundance. Each branch in the evolutionary tree represents an ASV/OTU, and the length of the branch is the evolutionary distance between two ASVs. ASV/OTU on the same branch indicates that the evolutionary relationship is close. (B) Species distribution map at phylum level. (C) Species distribution map at class level. (D) Species distribution map at order level. (E) Species distribution map at family level. (F) Species distribution map genus level. (G) Species distribution map at species level.
Species distribution at each taxonomic level
In the 16 samples, at the phylum level, the most abundant taxon was Proteobacteria, with a maximum relative abundance of 61.14% (Fig. 1B). At the class level, Gammaproteobacteria showed the highest abundance, reaching 66.75% (Fig. 1C). At the order level, Pseudomonadales was the dominant group, accounting for up to 50.20% (Fig.1D). At the family level, Pseudomonadaceae exhibited the highest abundance, with a maximum relative abundance of 50.26% (Fig. 1E). At the genus level, Pseudomonas spp. was the most abundant taxon, reaching 50.26% (Fig. 1F) and 73.01% in another sample (Fig. 1G).
Methodological validation of endophytic bacterial isolation
The bacteria in this study were isolated as “endophytes” following a widely accepted surface sterilization protocol for medicinal plant endophytes (Zhang et al. 2022), with methodological details supplemented herein to confirm they are not epiphytic contaminants. Surface sterilization procedure was as follows: fresh aerial tissues (stems and leaves) were washed with tap water to remove surface dust, then treated sequentially with 75% ethanol (v/v) for 3 min (to disrupt lipid membranes of surface microbes), 10% NaClO (v/v) for 3 min (to eliminate residual surface bacteria), and three washes with sterile deionized water (each 2 min, to remove disinfectants).
To check the sterility, the final rinse water (100 μl) was spread on LB solid medium and incubated at 37°C for 48 h; no bacterial colonies were observed (consistent with the negative control of sterile water), indicating effective elimination of surface microbes.
Network map analysis of dominant species of endophytic bacteria in six plant species
Select species that appeared in at least 60% of the samples. Calculate the Spearman’s correlation coefficient between the species. Select related species with P < 0.05. Select the first 200 species from the largest to the smallest according to |rho|. Limit the number of network connection edges (correlations) to < 1000 to construct the association network (Fig. 2). At the phylum level, the dominant bacterial taxa were Proteobacteria (Fig. 2A). At the class level, Gammaproteobacteria was predominant (Figure 2B). At the order level, the main taxa included Pseudomonadales, Rhizobiales, and Xanthomonadales (Fig. 2C). At the family level, Pseudomonadaceae was the most abundant taxon (Fig. 2D). At the genus level, dominant taxa included Pseudomonas (Fig. 2E).
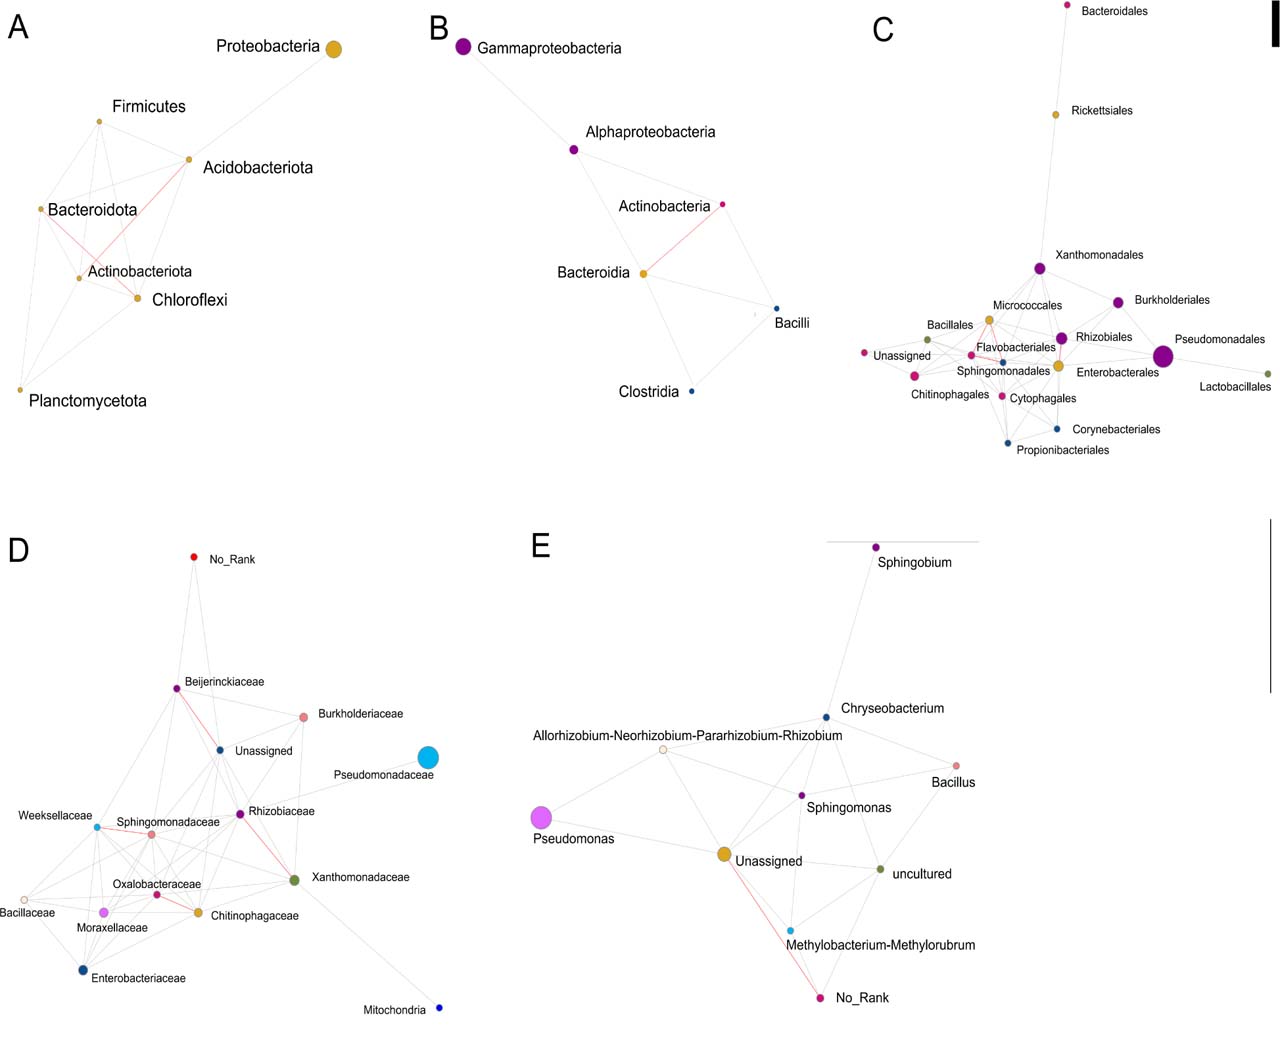
Fig. 2.
Map of dominant species network.
(A) phylum. (B) class. (C) order. (D) family. (E) genus. Each dot represents a species, the dot size is positively correlated with abundance, and different colours represent different species. The red line represents a strong positive correlation rho ≥ 0.6, the green line represents a strong negative correlation rho ≤ 0.6, and the grey line represents a weak correlation |rho| <0.6; Color-coded comments at the previous level.
α diversity analysis of endophytic bacteria in six plant species
α diversity index
α diversity was measured by Chao1, Ace, Shannon, and Simpson to reflect species abundance and diversity within a single sample. The Chao1 and Ace indices reflect species abundance. The Shannon and Simpson indices are used to measure species diversity, which is affected by species abundance and species evenness in the community. In the case of the same species abundance, the greater the evenness within the community, the greater the group diversity. The larger the Shannon index and Simpson index, the higher the species diversity in the sample.
Chao1, Ace, and Shannon of samples M1-3, M3-2, and M6-3 were the highest, indicating that the species richness of these three samples was greater than that of the other samples. The coverage of the 16 samples was close to 100%, indicating that the results of this experiment are genuine and reliable (Table III).
Table III
Alpha diversity index.
| Samples | Observed | Chaol | Ace | Shannon | Simpson | Coverage |
|---|---|---|---|---|---|---|
| M3-2 | 1030 | 1037.03 | 1035.75 | 4.59 | 0.03 | 0.9998514 |
| M1-3 | 842 | 845.08 | 845.54 | 5.73 | 0.01 | 0.9994599 |
| M6-3 | 274 | 275.00 | 275.21 | 3.85 | 0.05 | 0.9999742 |
| M2-2 | 215 | 215.50 | 216.39 | 3.02 | 0.21 | 0.9995731 |
| M6-5 | 189 | 189.86 | 190.27 | 2.00 | 0.35 | 0.9999581 |
| M1-4 | 109 | 120.00 | 120.22 | 4.15 | 0.03 | 0.9995688 |
| M4-5 | 96 | 107.00 | 107.00 | 2.91 | 0.11 | 1.0000000 |
| M3-4 | 104 | 104.09 | 104.46 | 3.94 | 0.04 | 0.9985643 |
| M4-4 | 81 | 85.00 | 85.00 | 3.09 | 0.08 | 1.0000000 |
| M6-4 | 60 | 60.00 | 60.00 | 1.02 | 0.52 | 1.0000000 |
| M3-3 | 54 | 54.00 | 54.00 | 3.32 | 0.06 | 1.0000000 |
| M4-3 | 39 | 40.50 | 39.85 | 1.71 | 0.38 | 0.9980814 |
| M2-3 | 34 | 34.14 | 34.67 | 2.31 | 0.18 | 0.9973048 |
| M5-4 | 20 | 20.00 | 20.00 | 2.75 | 0.08 | 1.0000000 |
| M5-3 | 17 | 17.00 | 17.00 | 2.51 | 0.10 | 1.0000000 |
| M2-4 | 15 | 15.00 | 15.34 | 1.62 | 0.25 | 0.9993060 |
[i] Note: In the sample ID, the numbers M1 to M6 represent Perilla frutescens (L.) Britt., Folium Mori, Artemisia Annua L., Eriobotrya japonica (Thunb.) Lindl., Cinnamomi Ramulus, Glycyrrhiza uralensis Fisch., and the numbers -1 to -5 represent roots, stems, leaves, fruits, and flowers, respectively.
Curve analysis
The dilution curve is to randomly extract a certain number of sequences from the sample and count the number of species represented by these sequences. The curve is constructed based on the number of sequences and the number of species to verify whether the sequencing quantity is sufficient to meet the species diversity in the sample. The dilution curve of each sample flattened out when the number of species approached a certain value, suggesting that the sequencing quantity was sufficient to meet the species diversity in each sample (Fig. 3A). The Shannon index curve reflects the microbial diversity of samples at different sequencing quantities. When the curve is flat, the number of characteristic species remains stable with increasing sequencing quantities, indicating that the sequencing data is large enough. The curves for all samples tended to be flat, indicating that the sequencing quantity was sufficient and the sequencing results were reliable (Fig. 3B).
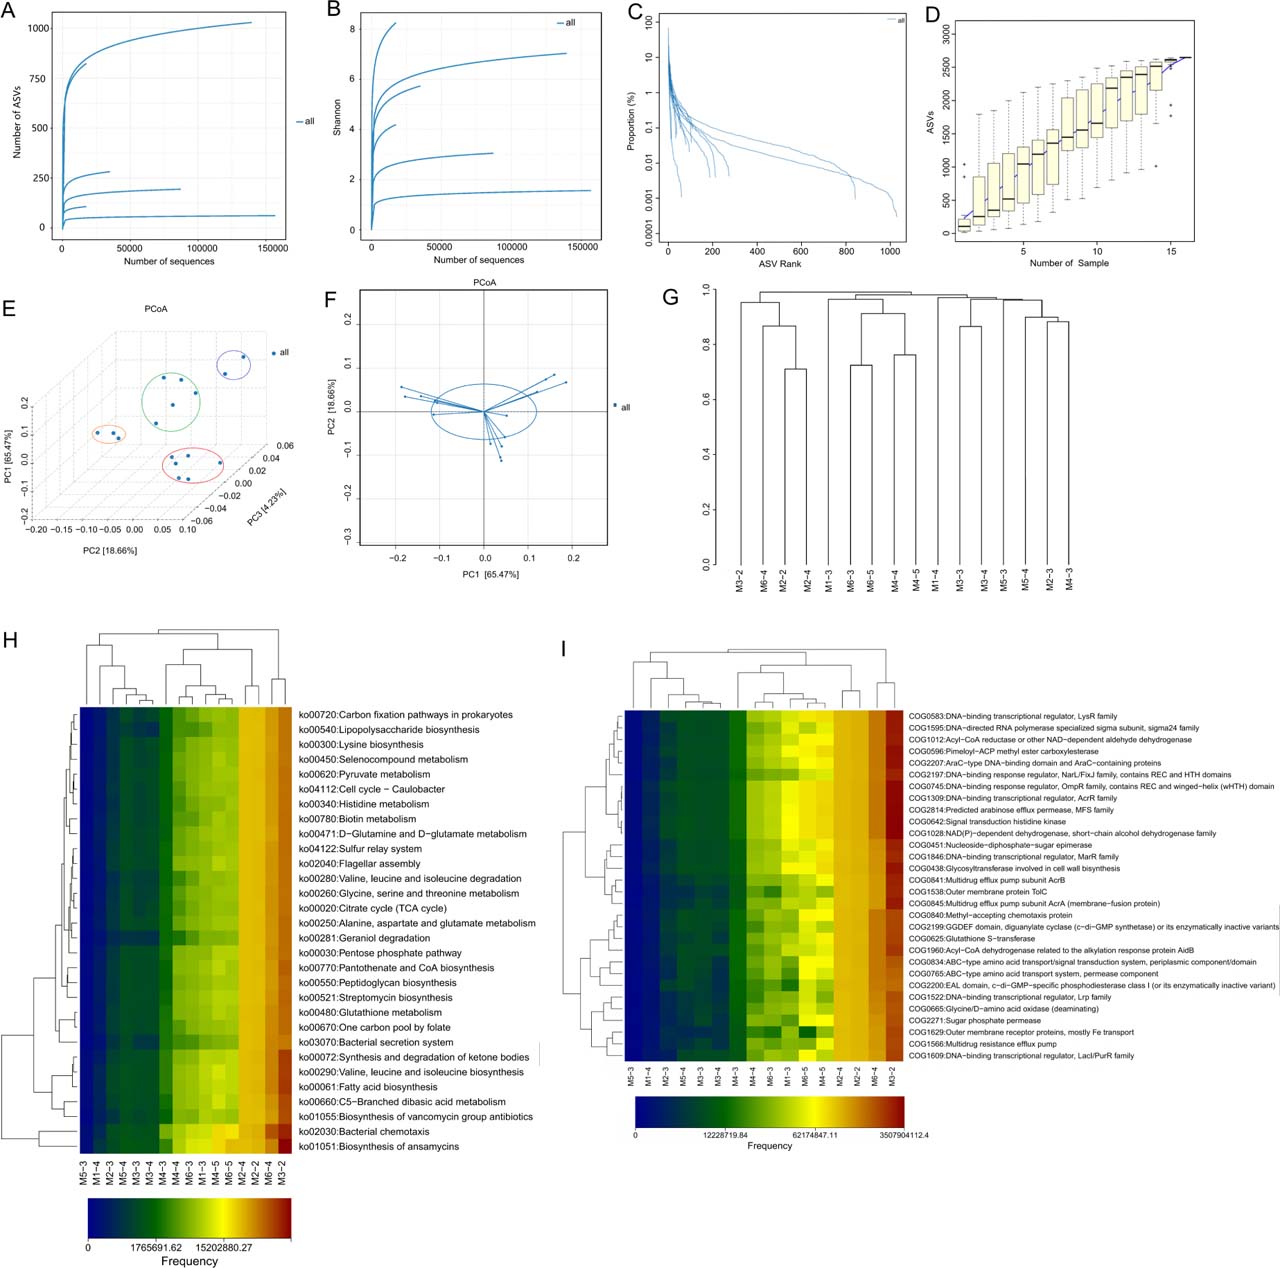
Fig. 3.
Microbiome and Metabolic Analysis Profiles.
(A) Dilution curve. (B) Shannon index curve. (C) Rank-abundance curve. (D) Species accumulation curve. (E and F) PCoA 3D diagram. (G) Multi-sample similarity tree. (H) Heat map of KEGG metabolic pathway difference analysis in each sample. (I) Thermal map of COG functional categories difference analysis for each sample.
Figure 4 Preparation of plate for the test of antibacterial activity of some strains. (A) Strains N513 and M6304. (B) Strain N5125.
The rank-abundance curve can elucidate both species abundance and species evenness in diversity. From the horizontal direction, the width of the curve reflects species abundance, and the larger the range of the curve on the horizontal axis, the higher the species abundance. The smoothness of the curve reflects the homogeneity of species in the sample; that is, the gentler the curve is, the more evenly distributed the species are. The curves of the samples M3-2 and M1-3 are wide and gentle, indicating that the species composition uniformity and abundance in this sample are high, while the curves of the other samples are narrow and steep, indicating that the species uniformity and abundance in these samples are relatively low (Fig. 3C).
The species accumulation curve is a graph to represent the diversity of species in a biological community, describing the relationship between the number of species discovered within a certain period and the number of samples during the study. Its shape reflects the diversity (richness) and evenness of species diversity, with a slow ascent in the curve indicating lower species diversity and a rapid rise indicating higher species diversity. In this study, the species accumulation curve exhibited a straight rise, indicating a high species diversity (Fig. 3D).
β diversity analysis of endophytic bacteria in six plant species
PCoA analysis
Principal coordinates analysis (PCoA) extracts the most crucial elements and structures from multidimensional data by ordering a series of eigenvalues and eigenvectors. The closer the distance between samples, the more similar the species composition structure. Thus, samples with high community structure similarity tend to cluster together, while samples with significant community differences will be far apart.
PCoA can effectively separate different samples on a coordinate map, revealing the influence of geographical factors on microbial composition. M5-4 and M3-3 samples cluster together, the M6-3, M1-4, M3-4, M5-3, and M3-2 samples cluster together, the M4-5, M4-4, and M1-3 samples cluster together, and the M6-4, M2-4, M4-3, M2-3, M6-5, and M2-2 samples cluster together (Fig. 3E AND F). This suggests that the community differences between these mutually aggregated samples are small.
Multi-sample similarity tree
The multi-sample similarity tree plots describe and compare similarity and difference relationships between multiple samples using a tree structure, where the tree length represents the distance between the samples. Among the 16 samples, the relationship between M2-2 and M2-4, M6-3 and M6-5, and M4-4 and M4-5 is the closest (Fig. 3G).
Functional prediction analysis of endophytic bacteria in six plant species.
KEGG function prediction
180 KEGG metabolic pathways were obtained from 16 samples through gene annotation. The relatively high abundance of these pathways includes Bacterial chemotaxis, Biosynthesis of ansamycins, Fatty acid biosynthesis, Synthesis and degradation of ketone bodies, Valine, leucine and isoleucine biosynthesis, etc. (Table S1, Fig. 3H).
COG functional categories analysis
COG is a prokaryotic homologous protein cluster database, a common functional classification database of prokaryotic proteins. We obtained 1490 COG functional annotations from 16 samples. The relatively abundant functions include signal transduction histidine kinase, NAD(P)-dependent dehydrogenase, short-chain alcohol dehydrogenase family, Predicted arabinose efflux permease, MFS family, DNA-binding response regulator, OmpR family containing a REC and winged-helix (wHTH) domain, etc. (Table S2, Fig. 3I).
Antibacterial activity and identification of purified strains
Forty-four purified strains were isolated, among which 11 exhibited antibacterial activity against various pathogenic microorganisms at different levels. These active strains were identified by 16S rRNA gene sequencing as belonging to Streptomyces telluris, Streptomyces globosus, Streptomyces spectabilis, Streptomyces racemochromogenes, Streptomyces goshikiensis, and Bacillus altitudinis. Notably, multiple isolates were assigned to Streptomyces telluris (n=3) and S. globosus (n=3). Among them, B. altitudinis and S. globosus exhibited strong inhibitory activity against multiple pathogenic strains (Table IV). Figure 4 illustrates representative plate assays for the antibacterial activity of selected endophytic bacterial strains.
Table IV
Bacteriostatic activity of purified strains and 16S identification results.
| Pathogenic bacteria | N513 | M6304 | N5125 | N5124 | N5117 | N5116 | N5133 | N5113 | N143-1 | N5112 | N515 |
|---|---|---|---|---|---|---|---|---|---|---|---|
| Foc1 | ++ | + | − | + | ++ | − | +++ | − | ++ | − | ++ |
| Foc4 | + | + | − | + | ++ | − | ++ | − | +++ | − | − |
| Pearl plum botryosphaeria dothidea | ++ | + | ++ | + | ++ | ++ | ++ | +++ | +++ | ++ | − |
| Citrus japonica Thunb. botryosphaeria dothidea | + | + | ++ | + | ++ | ++ | + | +++ | +++ | ++ | − |
| Alternaria alternata | +++ | + | ++ | ++ | − | ++ | +++ | ++ | +++ | − | |
| Pearl plum anthrax | + | + | ++ | ++ | − | ++ | + | ++ | +++ | + | − |
| Banana anthrax | − | − | ++ | − | ++ | ++ | − | ++ | − | + | − |
| Mango anthrax | + | + | ++ | ++ | − | + | + | + | +++ | ++ | − |
| Fusarium oxysporum | + | − | + | + | +++ | − | + | − | ++ | − | − |
| Fusarium fujikuroi | − | − | − | − | ++ | − | − | − | ++ | − | − |
| Fusarium solani | − | − | − | − | − | − | − | − | − | − | |
| Bacillus subtilis | + | − | ++ | +++ | ++ | + | + | +++ | − | − | − |
| Bacterium paratyphosum B | − | − | − | − | − | − | − | ++ | − | − | − |
| Typhoid bacillus | − | − | − | − | − | − | − | − | + | − | |
| Staphylococcus aureus | + | − | + | + | ++ | + | − | + | + | − | − |
| Staphylococcus aureus (methicillin-resistant) | + | − | + | − | +++ | + | +++ | − | ++ | − | − |
| Pseudomonas aeruginosa | + | − | − | − | − | − | − | − | − | − | + |
| Escherichia coli | + | − | ++ | +++ | ++ | + | + | + | − | − | − |
| Candida albicans | − | + | ++ | − | − | + | − | +++ | − | − | − |
| Inhibitory quantity | 13 | 13 | 12 | 11 | 11 | 11 | 11 | 11 | 10 | 7 | 2 |
| A strong positive number | 1 | 0 | 0 | 2 | 2 | 0 | 2 | 4 | 5 | 1 | 0 |
| Streptomyces telluris | Streptomyces racemochromogenes | Streptomyces globosus | Streptomyces spectabilis | Streptomyces spectabilis | Streptomyces globosus | Streptomyces telluris | Streptomyces globosus | Bacillus altitudinis | Streptomyces goshikiensis | Streptomyces telluris |
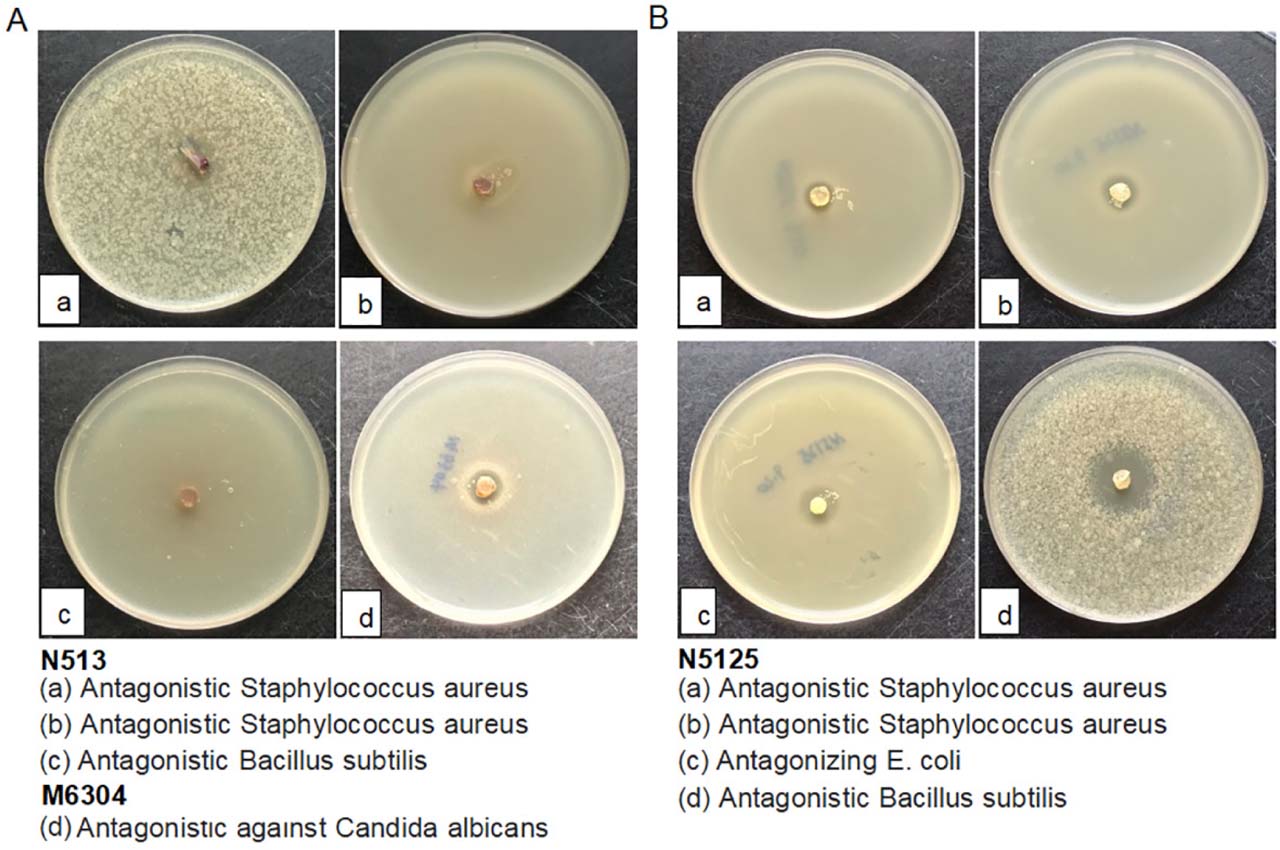
Figure 4
Preparation of plate for the test of antibacterial activity of some strains. (A) Strains N513 and M6304. (B) Strain N5125.
The antimicrobial and metabolic traits of the isolated bacteria indicate potential beneficial roles in their plant hosts, a key aspect of plant-bacteria associations.
Eleven strains with antimicrobial activity, including B. altitudinis and S. globosus, inhibited plant pathogens such as B. dothidea (causing kumquat canker) and the opportunistic pathogen C. albicans. Such activity suggests these strains could potentially mediate plant defense against pathogens.
Analysis of potential bioactive metabolites in the fermentation supernatant of purified strains
A total of 141 candidate metabolites potentially associated with antimicrobial activity were identified in the fermentation supernatant of the purified strains. Through further strict screening (with the screening criteria being an uncorrected P-value < 0.001 and ρ > 0.5), ten key candidate metabolites strongly correlated with antimicrobial activity were identified, including N-Acetyl-L-glutamine, N6-Acetyl-L-lysine, (3R)-beta-Leucine, 5-Acetamidovalerate, Leucine, Agmatine, 2-Furoate, 6-Hydroxyhexanoic acid, p-Hydroxyphenylacetic acid, and D-Alanyl-D-alanine. The associations between these metabolites and pathogenic bacteria are presented in Table V. Notably, N-Acetyl-L-glutamine showed a strong positive correlation with B. dothidea (ρ = 0.944, P < 0.001), suggesting a potential association with antimicrobial activity against this pathogen. Similarly, N6-Acetyl-L-lysine exhibited a high correlation with B. dothidea (ρ = 0.900, P < 0.001). In addition, (3R)-β-Leucine was strongly correlated with C. albicans (ρ = 0.858, P < 0.001). These results indicate that the identified metabolites are potentially involved in antimicrobial activity, although further experimental validation is required to confirm their specific biological functions.
Table V
Correlation between metabolites and pathogenic bacteria.
| Metabolite | Pathogen | ρ | P value | FDR |
|---|---|---|---|---|
| N-Acetyl-L-glutamine | Botryosphaeria dothidea (in relation to kumquat) | 0.944250 | 0.000004 | 0.000069 |
| N6-Acetyl-L-lysine | Botryosphaeria dothidea (in relation to kumquat) | 0.899815 | 0.000067 | 0.001207 |
| (3R)-beta-Leucine | Candida albicans | 0.857618 | 0.000361 | 0.006499 |
| 5-Acetamidovalerate | Methicillin-resistant Staphylococcus aureus (MRSA) | 0.846711 | 0.000512 | 0.009221 |
| Leucine | Candida albicans | 0.845869 | 0.000526 | 0.009463 |
| Agmatine | Colletotrichum rnusae (causing banana anthracnose) | 0.839719 | 0.000632 | 0.011383 |
| 2-Furoate | Fusarium oxysporum f. sp. cubense race 1 (causing banana wilt) | 0.836569 | 0.000693 | 0.012476 |
| 6-Hydroxyhexanoic acid | Colletotrichum gloeosporioides (in relation to Zhenzhu plum causing anthracnose) | 0.833162 | 0.000764 | 0.013748 |
| p-Hydroxyphenylacetic acid | Botryosphaeria dothidea (in relation to kumquat) | 0.833162 | 0.000764 | 0.013748 |
| D-Alanyl-D-alanine | Colletotrichum rnusae (causing banana anthracnose) | 0.824452 | 0.000970 | 0.017459 |
Discussion
This study focused on aerial tissue endophytes rather than rhizospheric or epiphytic bacteria for three reasons. Endophytes colonize internal plant tissues, avoiding external disturbances that affect other bacterial communities, forming more consistent associations across sites. They release metabolites directly into plant tissues for rapid use in defense or growth, unlike rhizospheric bacteria, whose metabolites lose much bioactivity while diffusing through soil. Additionally, endophytes of medicinal plants often produce host-analogous secondary metabolites, valuable for drug development—justifying focus despite rhizospheric/epiphytic bacteria’s contributions to plant health. The rich species diversity of medicinal plants can provide extensive resources for screening endophytic bacteria. Plant chemical composition and physiological function differ, and so do endophytic bacterial community structure and medicinal function. Natural bioactive compounds derived from medicinal plants can overcome the ineffectiveness of traditional antibiotic drugs (Semenzato et al. 2022). Bacteria within plant tissues can influence the synthesis of active compounds. It is necessary to uncover the mechanisms possibly involved in this symbiotic relationship.
This study conducted a comprehensive and indepth analysis of endophytic bacteria in six plant species and achieved a series of remarkable results. The most prominent finding is the astonishing diversity of endophytic bacteria in plants. A total of 2,159 genus-level detections were obtained across 16 samples, reflecting the cumulative abundance of bacterial genera rather than the number of unique taxa. The species accumulation curve clearly shows that the species diversity of each sample is relatively high. This discovery emphasizes the complexity and richness of the endophytic bacterial community in plants, providing an important clue for us to deeply understand the interaction between plants and microorganisms. In addition, functional analysis revealed a wide variety of metabolic pathways. Through KEGG metabolic pathway analysis, a total of 180 metabolic pathways were obtained, covering multiple key functional categories such as bacterial chemotaxis, biosynthesis of ansamycins, and fatty acid biosynthesis. COG functional annotation further revealed 1,490 functional categories, such as signal transduction histidine kinase and NAD(P)-dependent dehydrogenase. These diverse metabolic and functional profiles suggest that endophytic bacteria may play a crucial role in plant growth, development, and response to environmental stress. In terms of strain isolation, 44 strains were successfully isolated from six plant species. Among them, 11 strains showed antibacterial activity of different degrees against various pathogenic bacteria. In particular, the antibacterial effects of the two strains, B. altitudinis and S. telluris, are extremely significant. This result provides a highly promising resource for the development of new antibacterial drugs and biological control strategies.
Endophytic bacteria in plants play a complex and crucial role in the pathogenesis of microorganisms. The following is an in-depth discussion combined with the results of this study.
(I) Endophytic bacterial diversity and microbial pathogenesis
Ecological balance and competition: The high diversity of endophytic bacteria in plants indicates a complex microbial ecosystem within plants. The coexistence of many different genera provide a basis for maintaining ecological balance. In this ecosystem, there is fierce competition between different endophytic bacteria and between endophytic bacteria and pathogenic bacteria. For example, Pseudomonas spp. suppresses Fusarium oxysporum through competition for iron and root exudates (Verma et al. 2018). This competition can effectively reduce the number of pathogenic bacteria and thus reduce the risk of plant diseases.
Synergistic effect and defense mechanism: The diversity of endophytic bacteria may also lead to the generation of synergistic effects. Different genera may jointly build a plant defense system through mutual cooperation. For example, some genera (Saccharothrix yanglingensis Hhs.015) may produce antibacterial substances, while others may enhance the plant’s immune system. This synergistic effect can improve the plant’s resistance to pathogenic bacteria (Wang et al. 2024a).
(II) Metabolic pathways and microbial pathogenesis.
Antibiotic synthesis and pathogen inhibition: Pathways such as Biosynthesis of ansamycins in the KEGG metabolic pathway suggest that endophytic bacteria may have the ability to synthesize antibiotics. Antibiotics are important antibacterial substances that can directly inhibit the growth of pathogenic bacteria (Sitohy et al. 2024). Many endophytic bacteria can produce different types of antibiotics, which can accumulate in plants and form a natural defense line to resist the invasion of pathogenic bacteria (Vega-Portalatino et al. 2024).
Energy metabolism and survival adaptation: Pathways involved in energy metabolism such as NAD(P)-dependent dehydrogenase are crucial for the survival and adaptation of endophytic bacteria to the environment. In the competition with pathogenic bacteria, endophytic bacteria need enough energy to maintain their own growth and metabolic activities. By optimizing energy metabolism pathways, endophytic bacteria can better adapt to different environmental conditions, improve their survival ability, and thus gain an advantage in the competition with pathogenic bacteria (Saqib et al. 2022).
Signal transduction and environmental perception: Signal transduction pathways such as Signal transduction histidine kinase enable endophytic bacteria to sense environmental changes and make corresponding responses. Endophytic bacteria can adjust their own metabolism and behavior by sensing signals such as the presence of pathogenic bacteria and the physiological state of plants, so as to better adapt to the environment and play their role in plant health (Ayilara et al. 2023).
(III) Antibacterial strains and microbial pathogenesis
Production of antibacterial substances: The two strains with strong antibacterial effects, B. altitudinis and S. telluris, may inhibit the growth of pathogenic bacteria by producing specific antibacterial substances. Bacteria of the genus Bacillus can often produce antibacterial substances such as lipopeptide antibiotics and bacteriocins, which have a strong inhibitory effect on various pathogenic bacteria (Ye et al. 2023). Bacteria of the genus Streptomyces are known for synthesizing various antibiotics and bioactive substances, which can effectively combat pathogenic bacteria (Wang et al. 2024b).
Induction of plant immune responses: In addition to directly producing antibacterial substances, antibacterial strains may also enhance plant disease resistance by inducing plant immune responses. Some endophytic bacteria can activate the plant immune system, causing plants to produce defensive compounds and enhance the strength of cell walls, thereby increasing the plant’s resistance to pathogenic bacteria (Romero-Arguelles et al. 2022).
In future research, we need to study the interaction mechanism between endophytic bacteria and pathogenic bacteria in depth. At present, we have only conducted a preliminary bioinformatics prediction analysis on the functional roles, ecological interactions, and antibacterial mechanisms of endogenous bacteria. Future research needs to further explore how endophytic bacteria recognize pathogenic bacteria, compete with them for resources, and activate the plant’s defense system. Through in-depth study of these interaction mechanisms, we can better utilize the resources of endophytic bacteria and develop more effective biological control strategies. Modern biotechnology such as genomics, transcriptomics, and metabolomics provides us with powerful tools to deeply understand endophytic bacteria. These approaches enable comprehensive analysis of genomic architecture, gene expression profiles, and metabolites of endophytic bacteria, and explore the potential functions and application values of endophytic bacteria (Tiwari et al. 2023). Although laboratory studies have revealed the potential of endophytic bacteria in inhibiting pathogenic bacteria, in actual field conditions, the biological control effect of endophytic bacteria may be affected by multiple factors. Therefore, conducting field experiments is a key step in verifying the biological control effect of endophytic bacteria. Through field experiments, we can evaluate the stability, adaptability, and biological control effect of endophytic bacteria under different environmental conditions, and provide a scientific basis for their practical application (Arunachalam et al. 2024).
Analysis of antibacterial substances in the metabolites of purified strain fermentation supernatant offers valuable insights into the antibacterial properties of endophytic bacteria. Through antibacterial activity assays, 141 potential antibacterial compounds were identified, and 10 key metabolites were subsequently selected based on their strong associations with antimicrobial effects. These findings suggest a complex interplay between these metabolites and pathogenic microorganisms. The identified metabolites may represent potential candidates for the development of novel antibacterial agents, although their precise mechanisms of action require further investigation.
Regarding the possible action mechanisms of the identified antibacterial substances in the metabolites of purified strain fermentation supernatant:
Membrane disruption
According to recent research (Erguden 2021), certain hydrophobic metabolites, such as terpenoids and phenolic compounds, can interact with the lipid bilayer of microbial cell membranes. These compounds may insert into the membrane, disrupting its integrity and fluidity, leading to leakage of intracellular contents and eventual cell death. However, 2-furoate is a relatively polar and water-soluble compound and, therefore, is unlikely to exert antimicrobial effects through direct membrane insertion in the same manner as hydrophobic metabolites. Instead, its antimicrobial activity may be associated with alternative mechanisms, such as interference with microbial metabolic processes, intracellular acidification, or disruption of enzyme activity. Further studies are required to elucidate its specific mode of action. Mishra et al. (Mishra et al. 2022) conducted research indicating that endophytic bacteria-derived metabolites can target crucial metabolic processes within pathogens. Compounds such as N-Acetyl-L-glutamine could interfere with the biosynthesis of essential molecules in bacteria. It might act as a competitive inhibitor for key enzymes involved in processes like amino acid synthesis or energy metabolism pathways. A previous study has suggested that amino acid–related metabolites may inhibit bacterial growth by interfering with central carbon metabolism, including the tricarboxylic acid cycle, thereby disrupting bacterial energy production (Thacharoen et al. 2025).
Induction of plant defense responses
Endophytic bacteria and their metabolites can trigger the plant’s own immune system. The presence of metabolites like N6-Acetyl-L-lysine in the plant system might stimulate the production of plant hormones such as salicylic acid and jasmonic acid (Goswami and Deka 2020). These hormones then activate a cascade of defense-related genes in the plant, leading to the production of pathogenesis-related proteins and antimicrobial compounds. This not only directly inhibits the growth of pathogenic bacteria but also primes the plant for future attacks, enhancing its overall resistance.
While direct plant-bacteria interactions were not tested, multiple lines of evidence support potential beneficial associations. Defense associations are suggested by 11 antimicrobial strains (e.g., B. altitudinis) that inhibited pathogens infecting the six medicinal plants, including B. dothidea in Glycirrhiza uralensis (Xiao et al. 2024). This aligns with the “endophyte-mediated defense” hypothesis, where endophytes protect hosts from pathogens in exchange for nutrients. Metabolic associations are indicated by functional predictions of pathways for essential amino acid (valine, leucine) and fatty acid biosynthesis. These metabolites are limiting in nutrient-poor soils (e.g., Glycirrhiza uralensis’ sampling site in Shaanxi), suggesting bacterial nutrient supply—a common plant-endophyte mutualism (Verma VC 2025). Taxonomic associations with known symbionts further support this: dominant genera Pseudomonas and Streptomyces are well-documented plant symbionts, with Pseudomonas enhancing photosynthesis and Streptomyces promoting seed germination in Fabaceae, reinforcing potential mutualistic relationships (Radhakrishnan et al. 2020).
However, this study has several limitations. First, the identified metabolites were prioritized based on metabolomic profiling and correlation analysis with antibacterial activity; therefore, the observed associations do not establish direct causal relationships. Further functional validation, including isolation and activity verification of individual metabolites, is required to confirm their specific antimicrobial effects. Second, the metabolite analysis was limited to the current analytical platform and available databases, which may have omitted rare or previously uncharacterized metabolites. In addition, the functional profiles of endophytic bacterial communities were predicted based on 16S rRNA gene sequencing data, rather than directly measured using metagenomic or metatranscriptomic approaches. Therefore, these predicted pathways represent potential functional capacities rather than confirmed microbial activities. The inherent limitations of 16S-based functional inference, including dependence on reference databases and possible annotation bias, should be considered. Future studies integrating shotgun metagenomics and other omics approaches are needed to validate these predicted functions. Third, this study was performed under laboratory conditions, and the observed antibacterial activity may not fully represent the complex interactions occurring in natural ecosystems. In particular, the in vitro fermentation results should be interpreted independently from in vivo plant conditions, as the simplified experimental system cannot fully replicate the dynamic plant microenvironment. Moreover, the proposed mechanisms involving plant hormone-mediated induction of endophytic bacterial metabolism remain speculative and should be regarded as a conceptual model that requires further experimental validation under physiologically relevant conditions. Environmental factors, including microhabitat conditions, soil characteristics, and plant developmental stage, may influence the composition and functional activity of endophytic microbial communities. Although all plant samples were collected from a relatively restricted geographic region to minimize environmental variation, plant age was not strictly standardized, which may have introduced additional variability. These limitations highlight the need for further studies integrating multi-omics approaches, expanded sampling strategies, and in vivo validation to better understand plant–endophyte interactions and the antibacterial potential of endophytic microorganisms.
In conclusion, the endophytic bacteria of the six medicinal plants (Perilla frutescens (L.) Britt., Folium Mori, Artemisia Annua L., Eriobotrya japonica (Thunb.) Lindl., Cinnamomi Ramulus, Glycyrrhiza uralensis Fisch.) are rich in resources and have potential antibacterial application value. The related key metabolites provide a direction for in-depth exploration of the antibacterial mechanism.
Acknowledgments
National Natural Science Foundation of China (No. 82160483); Guangxi Clinical Research Center for Urology and Nephrology (No. Guike20297081); National Natural Science Foundation of China (Grant No. 81260108).
Notes
[4] Contributed by Author contributions
Min Qin: Conceptualization, Methodology, Validation, Formal analysis, Data curation, Investigation, Writing – original draft. Yujian Li: Conceptualization, Methodology, Validation, Formal analysis, Data curation, Investigation, Writing – original draft. Liwei Wei: Conceptualization, Data curation, Validation. Qizhou Mo: Conceptualization, Methodology, Data curation, Validation. Mohamud Bashir Hussein: Conceptualization, Methodology, Data curation, Validation. Trung Hieu Phan:Data curation, Validation. Ling Yang: Data curation, Validation. Rensong Li: Data curation, Validation. Siming Liao: Data curation, Validation. Jiwen Cheng: Project administration, Resources, Supervision, Writing-review & editing.
Supplementary materials are available on the journal’s website.