
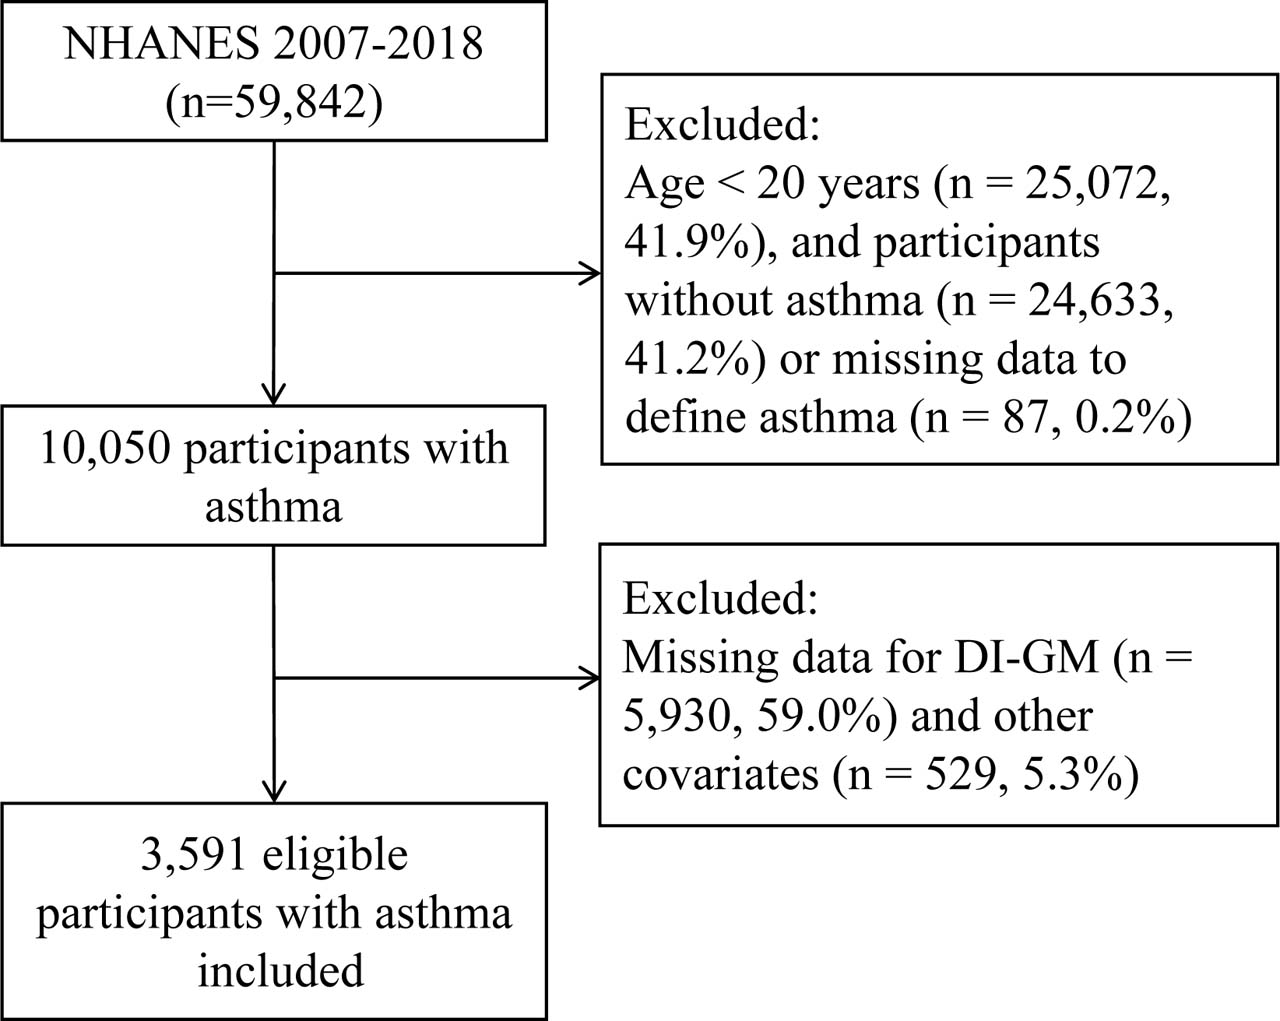
Fig. 1.
Flowchart for screening participants in NHANES 2007-2018.
NHANES – National Health and Nutrition Examination Survey, DI-GM – dietary index for GM
Table I
Characteristics of the study population
| Characteristics | Overall | No current asthma | Current asthma | P (value) |
|---|---|---|---|---|
| N | 3591 | 1447 | 2144 | |
| Age (Mean, SD) (year) | 45.5 (16.9) | 43.1 (16.7) | 47.1 (16.8) | <0.001 |
| Sex (%) | <0.001 | |||
| Female | 2096 (60.4) | 707 (51.5) | 1389 (66.5) | |
| Male | 1495 (39.6) | 740 (48.5) | 755 (33.5) | |
| Race (%) | 0.361 | |||
| Mexican American | 322 (5.6) | 133 (5.7) | 189 (5.5) | |
| Non-Hispanic White | 1687 (68.0) | 657 (67.6) | 1030 (68.3) | |
| Non-Hispanic Black | 865 (13.1) | 334 (12.2) | 531 (13.8) | |
| Other Race | 717 (13.3) | 323 (14.5) | 394 (12.5) | |
| Education (%) | 0.205 | |||
| < 9 years | 241 (3.8) | 80 (3.3) | 161 (4.2) | |
| 9∼12 years | 483 (10.2) | 170 (9.1) | 313 (11.0) | |
| ≥ 12 years | 2867 (86.0) | 1197 (87.7) | 1670 (84.8) | |
| Marry status (%) | 0.093 | |||
| Single | 1662 (41.3) | 617 (38.6) | 1045 (43.2) | |
| Coupled | 1929 (58.7) | 830 (61.4) | 1099 (56.8) | |
| PIR | 2.8 (1.7) | 3.0 (1.7) | 2.7 (1.7) | <0.001 |
| Smoke (%) | 0.007 | |||
| Non-smoker | 1812 (51.5) | 783 (56.4) | 1029 (48.2) | |
| Former smoker | 918 (25.1) | 343 (23.2) | 575 (26.4) | |
| Current smoker | 861 (23.4) | 321 (20.4) | 540 (25.5) | |
| Alcohol (%) | 0.004 | |||
| Non-drinker | 1122 (25.8) | 402 (21.6) | 720 (28.7) | |
| Current drinker | 2469 (74.2) | 1045 (78.4) | 1424 (71.3) | |
| Physical activity (%) | 0.015 | |||
| Low | 1441 (36.1) | 520 (32.5) | 921 (38.5) | |
| High | 2150 (63.9) | 927 (67.5) | 1223 (61.5) | |
| BMI (Mean, SD) (kg/m2) | 30.4 (8.1) | 29.2 (7.5) | 31.3 (8.3) | <0.001 |
| Hypertension (%) | <0.001 | |||
| No | 1905 (59.8) | 870 (66.2) | 1035 (55.3) | |
| Yes | 1686 (40.2) | 577 (33.8) | 1109 (44.7) | |
| Diabetes (%) | <0.001 | |||
| No | 2840 (84.9) | 1221 (89.9) | 1619 (81.4) | |
| Yes | 751 (15.1) | 226 (10.1) | 525 (18.6) | |
| Dietary Supplement (%) | 0.133 | |||
| No | 1689 (45.1) | 728 (47.4) | 961 (43.5) | |
| Yes | 1902 (54.9) | 719 (52.6) | 1183 (56.5) | |
| Energy intake (Mean, SD) (kcal) | 2067 (858) | 2154 (915) | 2007 (811) | <0.001 |
| DI-GM (%) | 0.001 | |||
| 0∼4 | 1612 (42.1) | 588 (36.3) | 1024 (46.1) | |
| 5∼6 | 825 (23.0) | 356 (25.1) | 469 (21.6) | |
| >6 | 1154 (34.9) | 503 (38.6) | 651 (32.3) | |
Table II
Association between dietary index for gut microbiota (DI-GM) and current asthma.
| Model 1 | Model 2 | Model 3 | ||||
|---|---|---|---|---|---|---|
| OR (95% CI) | P (value) | OR (95% CI) | P (value) | OR (95% CI) | P (value) | |
| Continuous | 0.92(0.87∼0.98) | 0.005 | 0.93(0.87∼0.99) | 0.016 | 0.94(0.88∼1.00) | 0.042 |
| Categorical | ||||||
| T1 (0 ∼ 4) | Ref | Ref | Ref | |||
| T2 (5 ∼ 6) | 0.68(0.51∼0.90) | 0.008 | 0.70(0.52∼0.94) | 0.019 | 0.72(0.53∼0.97) | 0.031 |
| T3 (> 6) | 0.66(0.52∼0.83) | <0.001 | 0.66(0.52∼0.84) | 0.001 | 0.70(0.55∼0.91) | 0.007 |
[i] Model 1 was unadjusted. Model 2 was adjusted for age, sex, race, education level, marital status, and income-to-poverty ratio (PIR). Model 3 was further adjusted for smoking status, drinking status, physical activity, body mass index (BMI), hypertension, diabetes, dietary supplement use, and total energy intake based on Model 2.
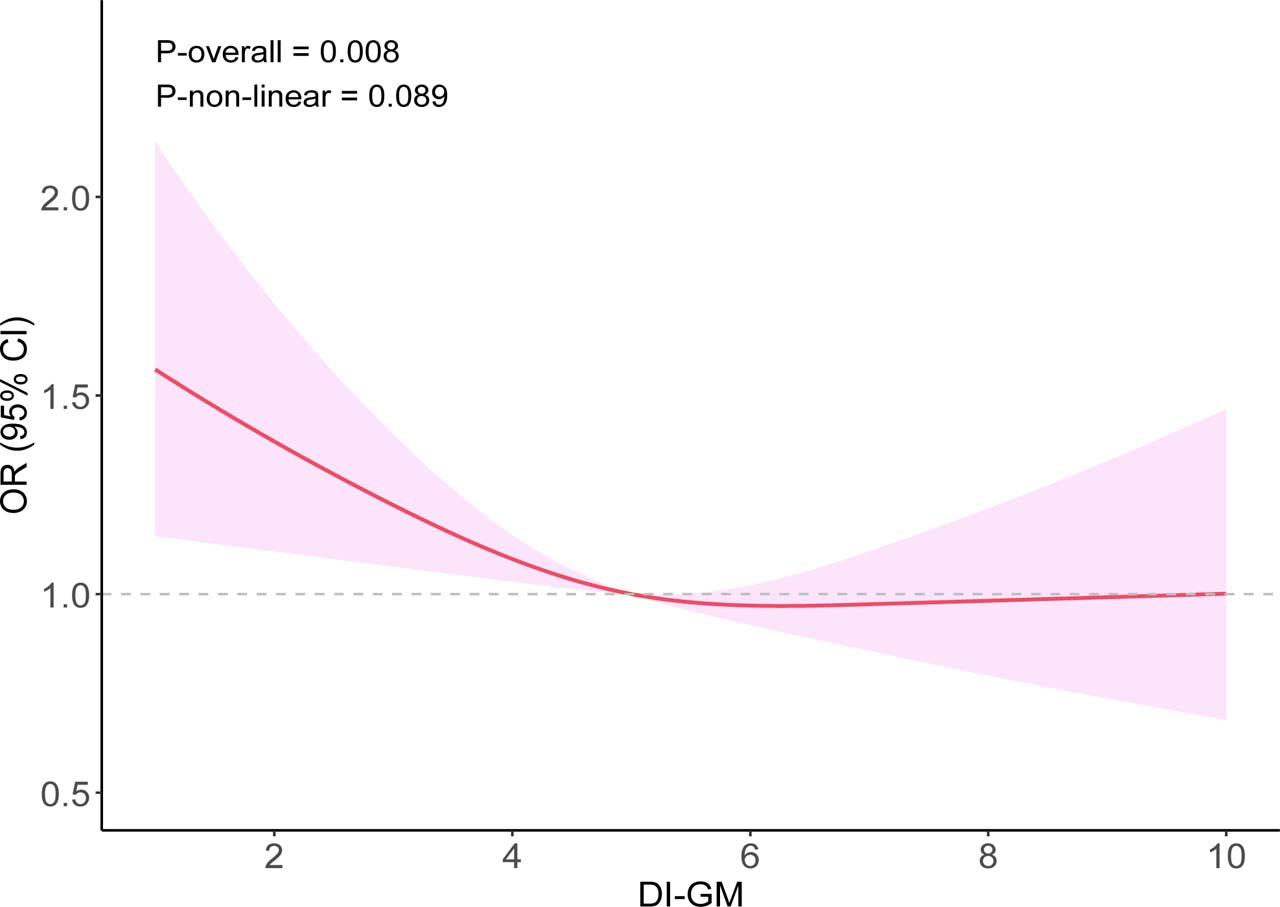
Fig. 2.
Restricted cubic spline curve of dietary index for gut microbiota (DI-GM) and current asthma. The model was adjusted for age, sex, race, education level, marital status, and income-to-poverty ratio (PIR), smoking status, drinking status, physical activity, body mass index (BMI), hypertension, diabetes, dietary supplement use, and total energy intake.
OR – odds ratio, CI – confidence interval
Table III
Subgroup analysis for the association between dietary index for gut microbiota (DI-GM) and current asthma.
| Subgroup | T1 (0 - 4) | T2 (5 ∼ 6) | T3 (> 6) | P (interaction) | ||
|---|---|---|---|---|---|---|
| OR (95%CI) | P (value) | OR (95%CI) | P (value) | |||
| Age | 0.959 | |||||
| <60 | Ref | 0.73(0.53∼0.99) | 0.049 | 0.68(0.5∼0.93) | 0.017 | |
| ≥ 60 | Ref | 0.64(0.36∼1.15) | 0.139 | 0.69(0.41∼1.14) | 0.148 | |
| Sex | 0.213 | |||||
| Female | Ref | 0.61(0.41∼0.89) | 0.013 | 0.66(0.47∼0.92) | 0.018 | |
| Male | Ref | 0.86(0.58∼1.28) | 0.467 | 0.79(0.55∼1.15) | 0.223 | |
| Smoke | 0.535 | |||||
| Non-smoker | Ref | 0.7(0.47∼1.03) | 0.076 | 0.86(0.6∼1.23) | 0.398 | |
| Former smoker | Ref | 0.6(0.36∼1.02) | 0.062 | 0.47(0.28∼0.78) | 0.005 | |
| Current smoker | Ref | 0.93(0.52∼1.68) | 0.82 | 0.66(0.36∼1.22) | 0.189 | |
| BMI (kg/m2) | 0.596 | |||||
| < 30 | Ref | 0.74(0.49∼1.11) | 0.146 | 0.75(0.52∼1.08) | 0.122 | |
| ≥ 30 | Ref | 0.71(0.49∼1.04) | 0.082 | 0.65(0.45∼0.93) | 0.023 | |