
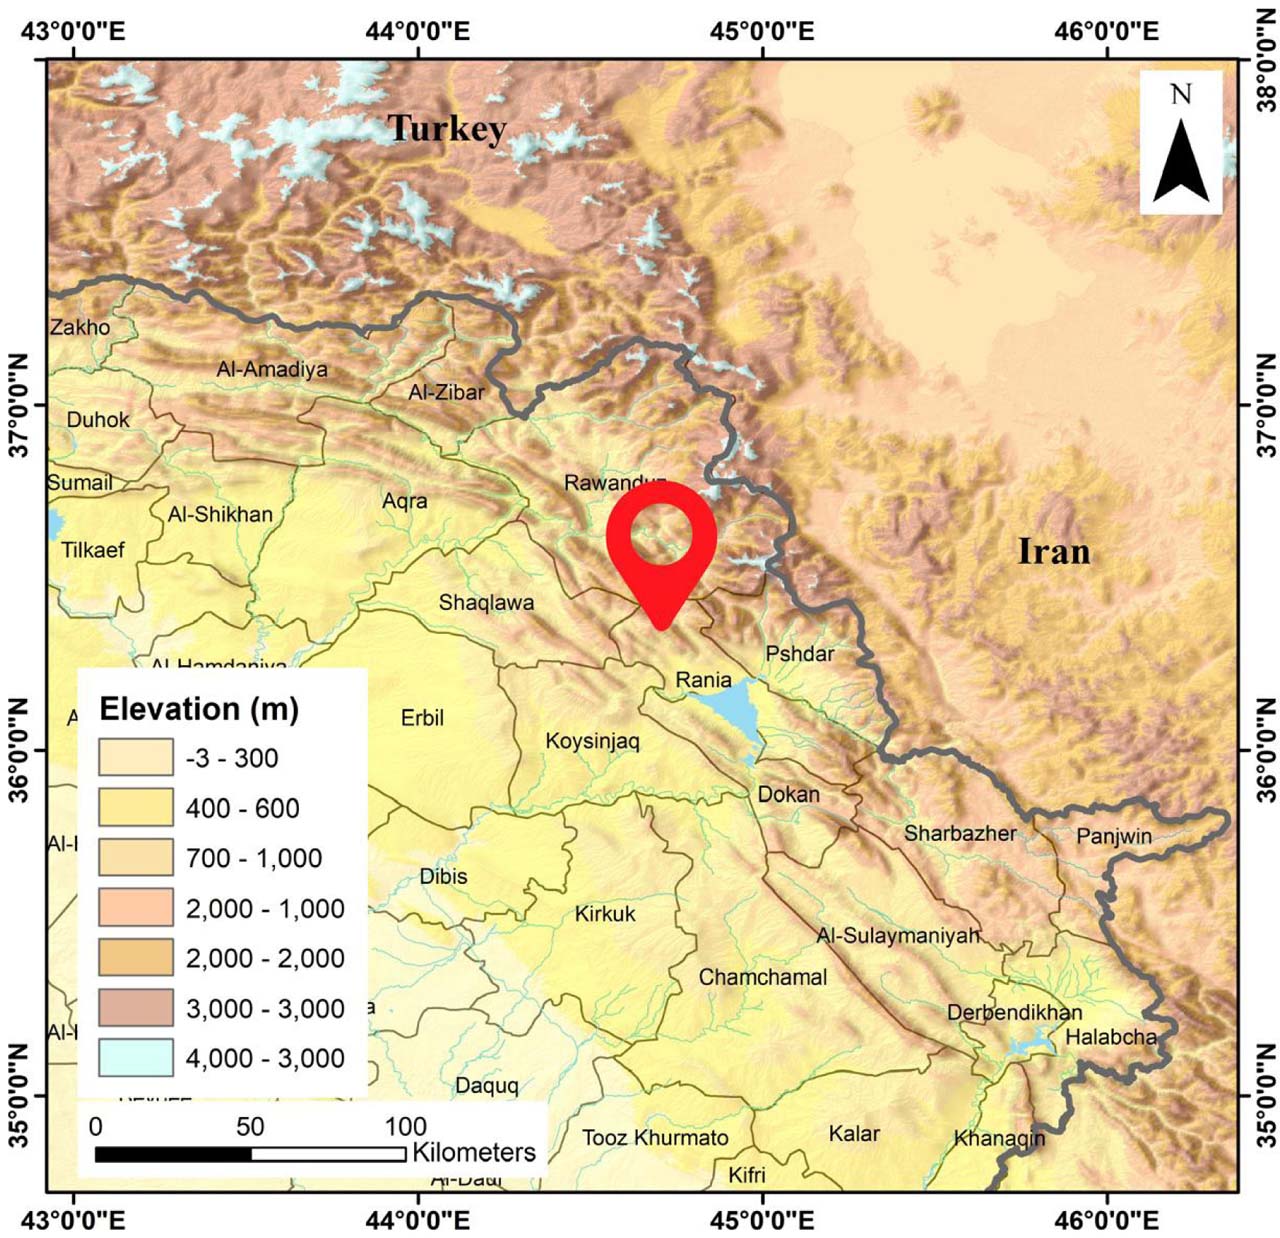
Fig. 1.
Collection site of ARVR on Betwata Mountain near Ranya, Kurdistan Region, Iraq. The red marker indicates the sampling location (36°19′18.43″ N, 44°56′48.61″ E). Elevation is shown in meters, with darker shades representing higher altitudes.
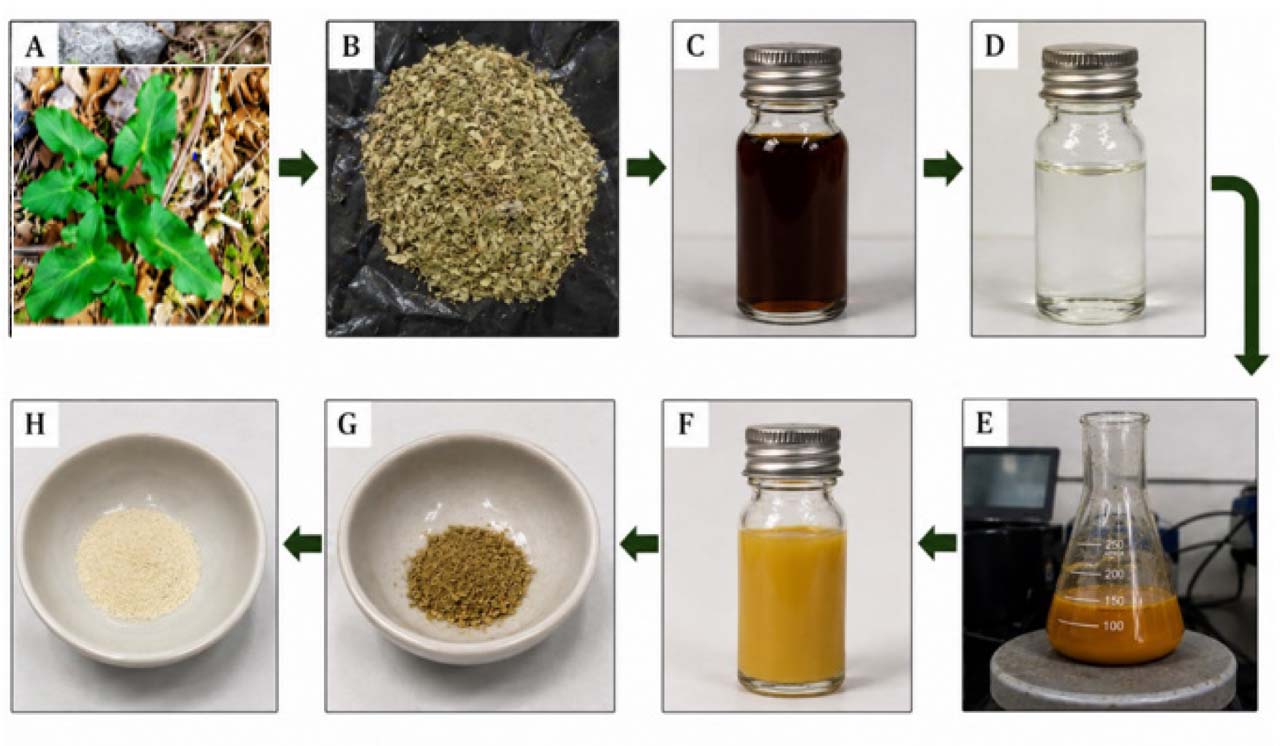
Fig. 2.
Diagrammatic illustration of the biofabrication process of ZnO-NPs. (A) ARVR specimen. (B) Dried leaf powder. (C) Aqueous extract. (D) Zn(NO3)2·6H2O solution. (E and F) ZnO-NPs after 2 h of stirring and heating at 60 ± 3°C with plant extract. (G) ZnO-NPs before calcination. (H) ZnO-NPs after calcination in a muffle furnace.
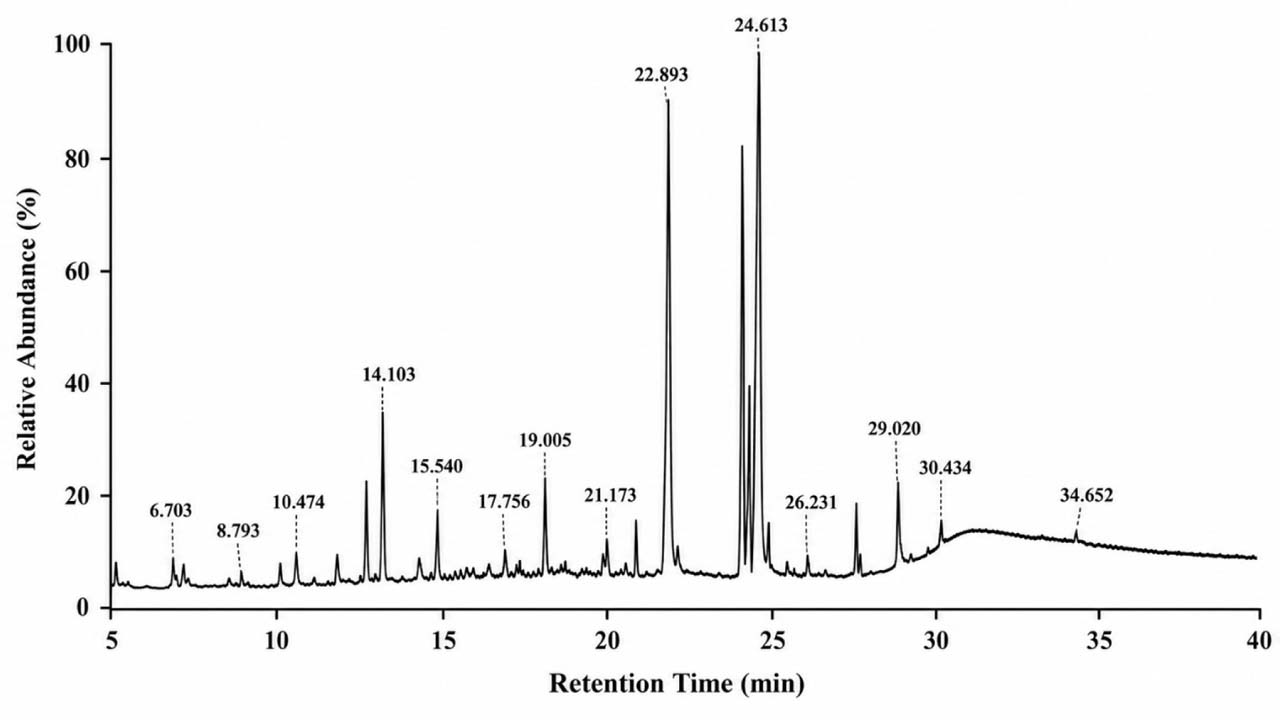
Fig. 3.
Gas chromatography–mass spectrometry (GC–MS) chromatogram of the aqueous leaf extract of Arum rupicola var. rupicola (ARVR). The chromatogram shows the distribution of metabolites detected in the extract, including phenolic compounds, oxygenated metabolites, fatty acids, fatty acid esters, and other phytochemical constituents. A total of 56 compounds were identified based on retention time and mass spectral matching.
Table I
List of chemical compounds identified in the plant extract by GC–MS analysis, including compound names, retention times, and relative peak area percentages.
| No. | Chemical compounds | Area % | R.T. |
|---|---|---|---|
| 1 | Methyl 2-hydroxy-2-methoxyacetate | 1.1038 | 4.315 |
| 2 | Butanal, 3-methyl- | 0.7377 | 4.716 |
| 3 | 1,2-Pentanediol | 0.564 | 4.951 |
| 4 | 2-Propanamine, N-methyl-N-nitroso- | 0.2778 | 5.572 |
| 5 | Pyrazine, methyl- | 0.7731 | 6.507 |
| 6 | Dimethyl Sulfoxide | 3.3008 | 6.703 |
| 7 | Dimethyl Sulfoxide | 0.271 | 7.426 |
| 8 | 1,5-Pentanedithiol | 0.2515 | 7.819 |
| 9 | Acetaldehyde, ethylidenehydrazone | 0.6276 | 7.999 |
| 10 | Pyrazine, 2,5-dimethyl- | 1.2808 | 8.486 |
| 11 | 2-Dodecylcyclobutanone | 0.56 | 8.793 |
| 12 | N-(2-Methylbutylidene)isobutylami | 0.6201 | 9.005 |
| 13 | 2-Furanmethanol, 5-methyl- | 0.1926 | 9.476 |
| 14 | 1,7-Diazabicyclo[2.2.0]heptane | 0.1744 | 9.712 |
| 15 | 2,4-Dihydroxy-2,5-dimethyl-3(2H)-furan-3-one | 1.0664 | 9.94 |
| 16 | Decane | 1.2514 | 10.183 |
| 17 | Propanenitrile, 3,3’-iminobis- | 1.9255 | 10.474 |
| 18 | 2-[(2-Oxocycloheptyl)methyl]cycloheptan-1-one (isomer 2) | 0.2715 | 10.694 |
| 19 | 2-Butenal, 3-methyl- | 0.6502 | 10.914 |
| 20 | Benzeneacetaldehyde | 0.3978 | 11.251 |
| 21 | Furaneol | 0.5105 | 11.487 |
| 22 | 1-Ethyl-2-pyrrolidinone | 0.9112 | 11.77 |
| 23 | But-3-enyl (E)-2-methylbut-2-enoate | 2.1565 | 12.155 |
| 24 | cis-1-Butene,1-butoxy- | 0.2587 | 12.65 |
| 25 | 4H-Pyran-4-one, 2,3-dihydro-3,5-dihydroxy-6-methyl- | 3.3002 | 12.972 |
| 26 | Benzoic acid | 0.2148 | 13.364 |
| 27 | 2-Pyrrolidinone, 5-(hydroxymethyl)- | 3.2193 | 13.561 |
| 28 | Benzofuran, 2,3-dihydro- | 2.3003 | 14.103 |
| 29 | Decanoic acid, 3-hydroxy-, methyl ester | 1.1422 | 14.456 |
| 30 | 2,4-Difluoroanisole | 1.7553 | 15.053 |
| 31 | 2-Methoxy-4-vinylphenol | 1.0778 | 15.54 |
| 32 | Butanoic acid, 3-methyl-, hexyl ester | 0.3884 | 15.807 |
| 33 | DL-Proline, 5-oxo-, methyl ester | 1.1106 | 16.365 |
| 34 | 1,2,4-Benzenetriol | 0.5489 | 16.695 |
| 35 | trans-Cinnamic acid | 0.5023 | 16.986 |
| 36 | 4-Vinylbenzene-1,2-diol | 1.3339 | 17.221 |
| 37 | N,N-Diamylmethylamine | 0.37 | 17.677 |
| 38 | 2-Hydroxy-1-(1’-pyrrolidiyl)-1-buten-3-one | 1.5931 | 18.211 |
| 39 | 2(4H)-Benzofuranone, 5,6,7,7a-tetrahydro-4,4,7a-trimethyl-, (R)- | 0.4428 | 18.502 |
| 40 | Phenol, 4-ethenyl-2,6-dimethoxy- | 1.1138 | 18.769 |
| 41 | 3-Methyl-4-phenyl-1H-pyrrole | 1.7471 | 19.005 |
| 42 | Octahydropyrrolo[1,2-a]pyrazine | 0.3566 | 19.256 |
| 43 | 1,3-Benzenediol, 4,5-dimethyl- | 0.3926 | 20.206 |
| 44 | Tetradecanoic acid | 0.3686 | 20.819 |
| 45 | 2(1H)-Pyridinone, 1,3,6-trimethyl- | 0.9166 | 21 |
| 46 | Phthalic acid, isobutyl undecyl ester | 0.4412 | 22.068 |
| 47 | Hexadecanoic acid, methyl ester | 4.3661 | 22.539 |
| 48 | n-Hexadecanoic acid | 9.6708 | 22.893 |
| 49 | 9-Octadecenoic acid, methyl ester, (E)- | 11.7767 | 24.228 |
| 50 | Methyl stearate | 4.0117 | 24.44 |
| 51 | 9,12,15-Octadecatrienoic acid, (Z,Z,Z)- | 16.4382 | 24.613 |
| 52 | Methyl 9-cis,11-trans-octadecadienoate | 1.963 | 24.998 |
| 53 | 3’-O-Acetylthymidine | 0.5502 | 26.483 |
| 54 | 3-Eicosene, (E)- | 1.5561 | 27.496 |
| 55 | Bis(2-ethylhexyl) phthalate | 1.087 | 28.015 |
| 56 | 1-Tetracosene | 3.809 | 29.02 |
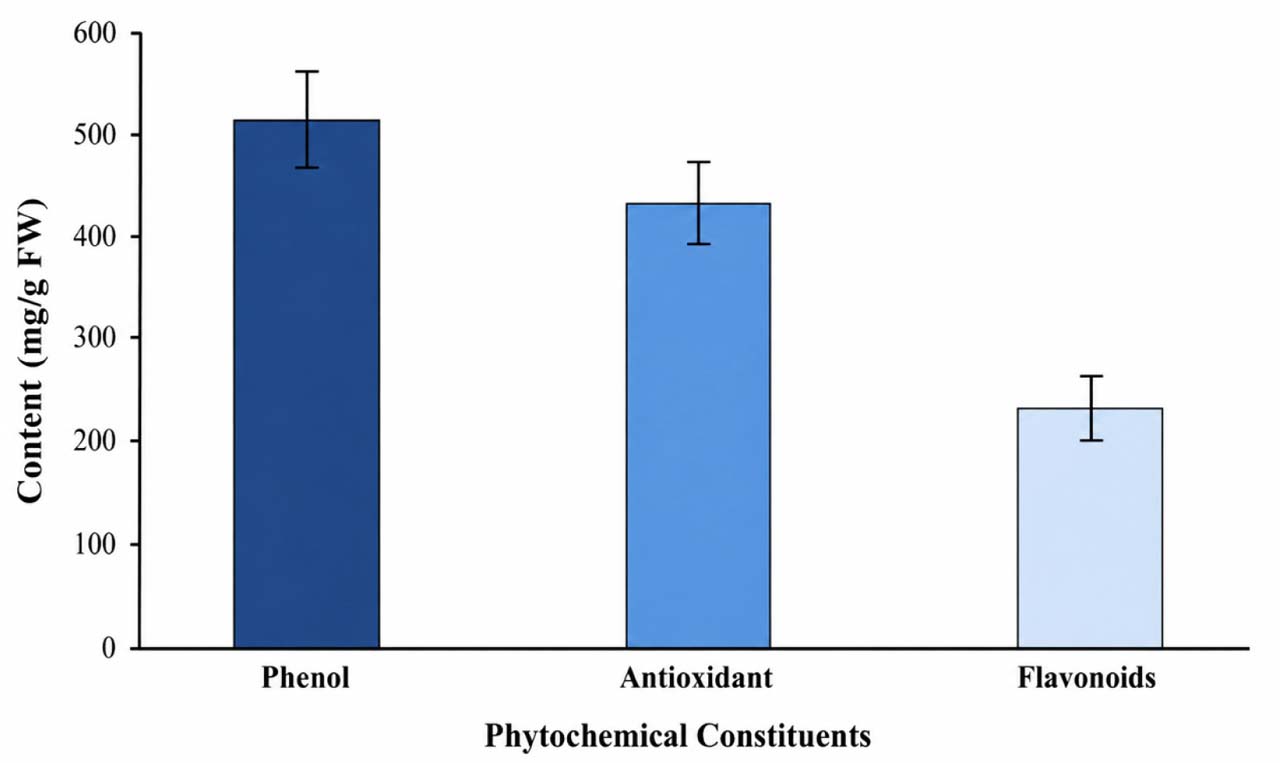
Fig. 4.
Quantitative phytochemical analysis of ARVR leaf extract showing total phenolic content, antioxidant capacity, and total flavonoid content, expressed as mg/g fresh weight (FW). Data are presented as mean ± standard deviation (SD) from three independent biological replicates.
Table II
MDR profiles of the studied bacterial isolates. Antibiotic susceptibility was determined using the BD Phoenix system and interpreted according to CLSI M100 (34th edition, 2024) (Clinical & Laboratory Standards 2024).
| Bacterial strain | Resistant antibiotics (class) | Number of antibiotics classes |
|---|---|---|
| Staphylococcus aureus | Gentamicin (Aminoglycoside); Penicillin, Oxacillin, Cefoxitin (β-lactams); Erythromycin (Macrolide); Clindamycin (Lincosamide); Ciprofloxacin, Levofloxacin (Fluoroquinolones) | 5 |
| Staphylococcus epidermidis | Gentamicin (Aminoglycoside); Penicillin, Oxacillin, Cefoxitin (β-lactams); Erythromycin (Macrolide); Clindamycin (Lincosamide); Ciprofloxacin, Levofloxacin (Fluoroquinolones) | 5 |
| Escherichia coli | Gentamicin, Amikacin (Aminoglycosides); Ampicillin, Cefotaxime, Ceftazidime, Cefazolin (β-lactams); Imipenem, Ertapenem, Meropenem (Carbapenems); Ciprofloxacin, Levofloxacin (Fluoroquinolones); Trimethoprim–sulfamethoxazole (Sulfonamide) | 5 |
| Klebsiella aerogenes | Gentamicin, Amikacin (Aminoglycosides); Ampicillin, Cefazolin, Cefuroxime, Ceftazidime (β-lactams); Ciprofloxacin, Levofloxacin (Fluoroquinolones); Trimethoprim–sulfamethoxazole (Sulfonamide) | 4 |
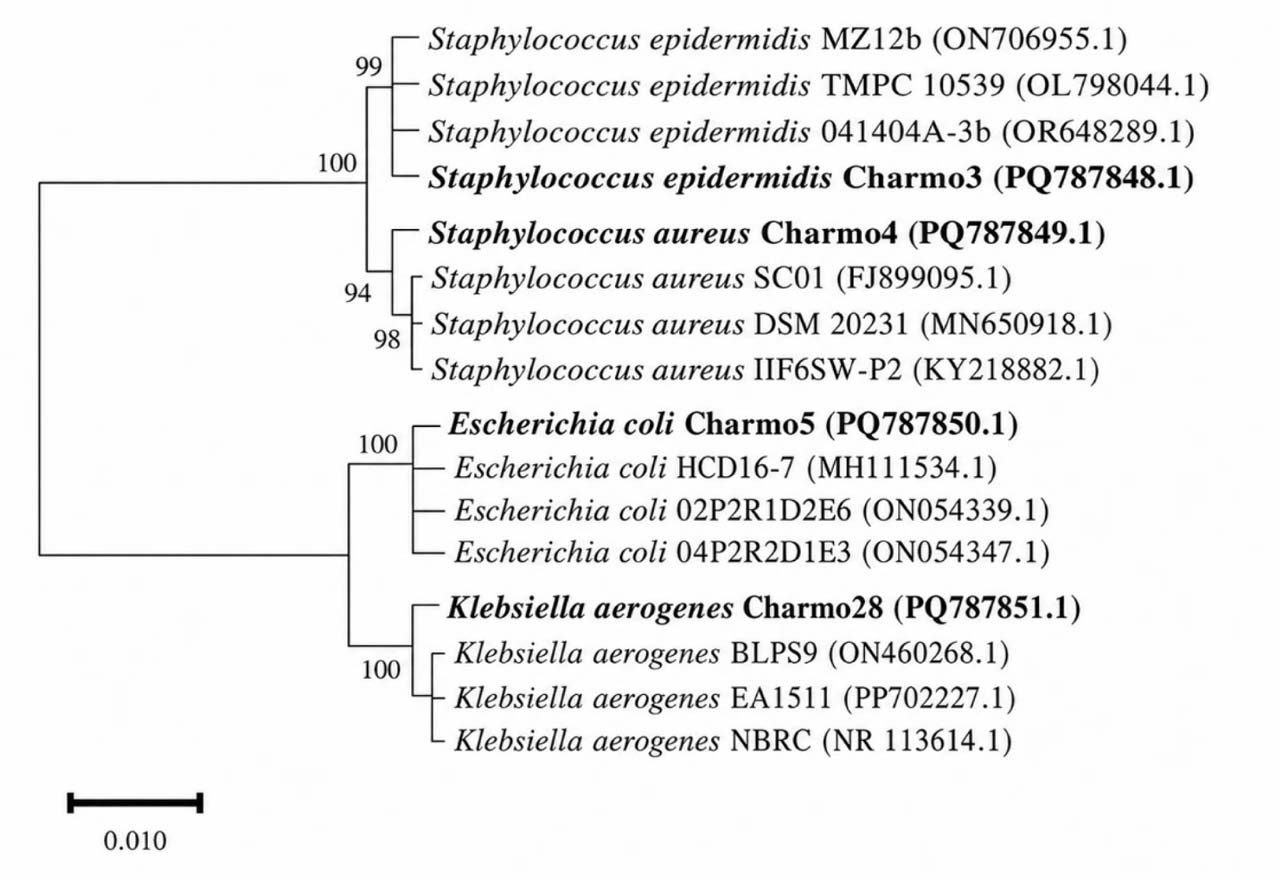
Fig. 5.
Phylogenetic tree of S. epidermidis Charmo3, S. aureus Charmo4, E. coli Charmo5, and K. aerogenes Charmo28 based on 16S rRNA gene sequences. DNA sequences were aligned using ClustalX, and the tree was constructed in MEGA 11 with the neighbor-joining method and 1,000 bootstrap replicates. Bootstrap values are shown at branch nodes.
The scale bar represents 0.01 nucleotide substitutions per site.
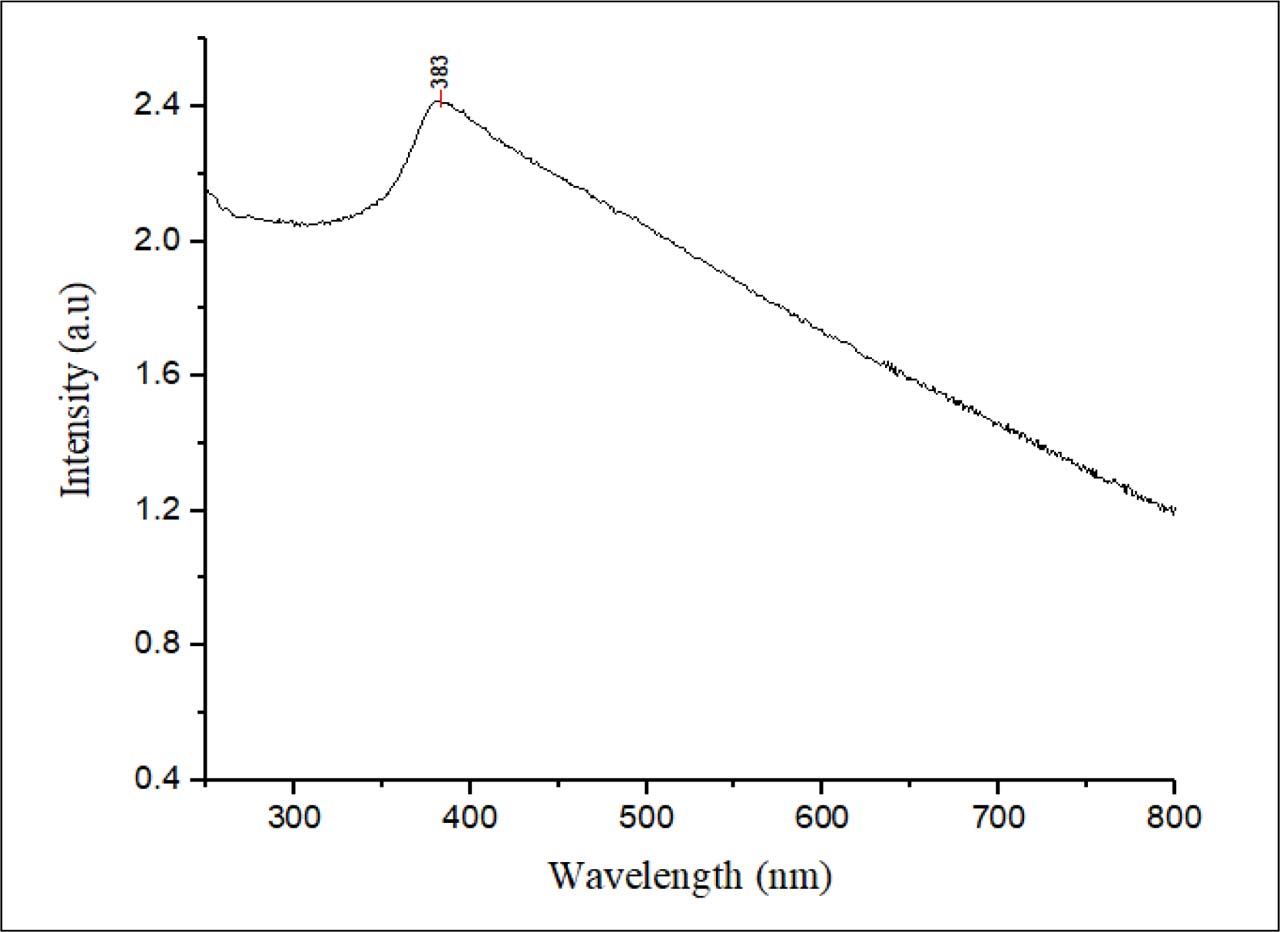
Fig. 6.
UV–Vis absorption spectrum of biosynthesized ZnO-NPs using ARVR leaf extract, showing a characteristic band-edge peak at 383 nm.
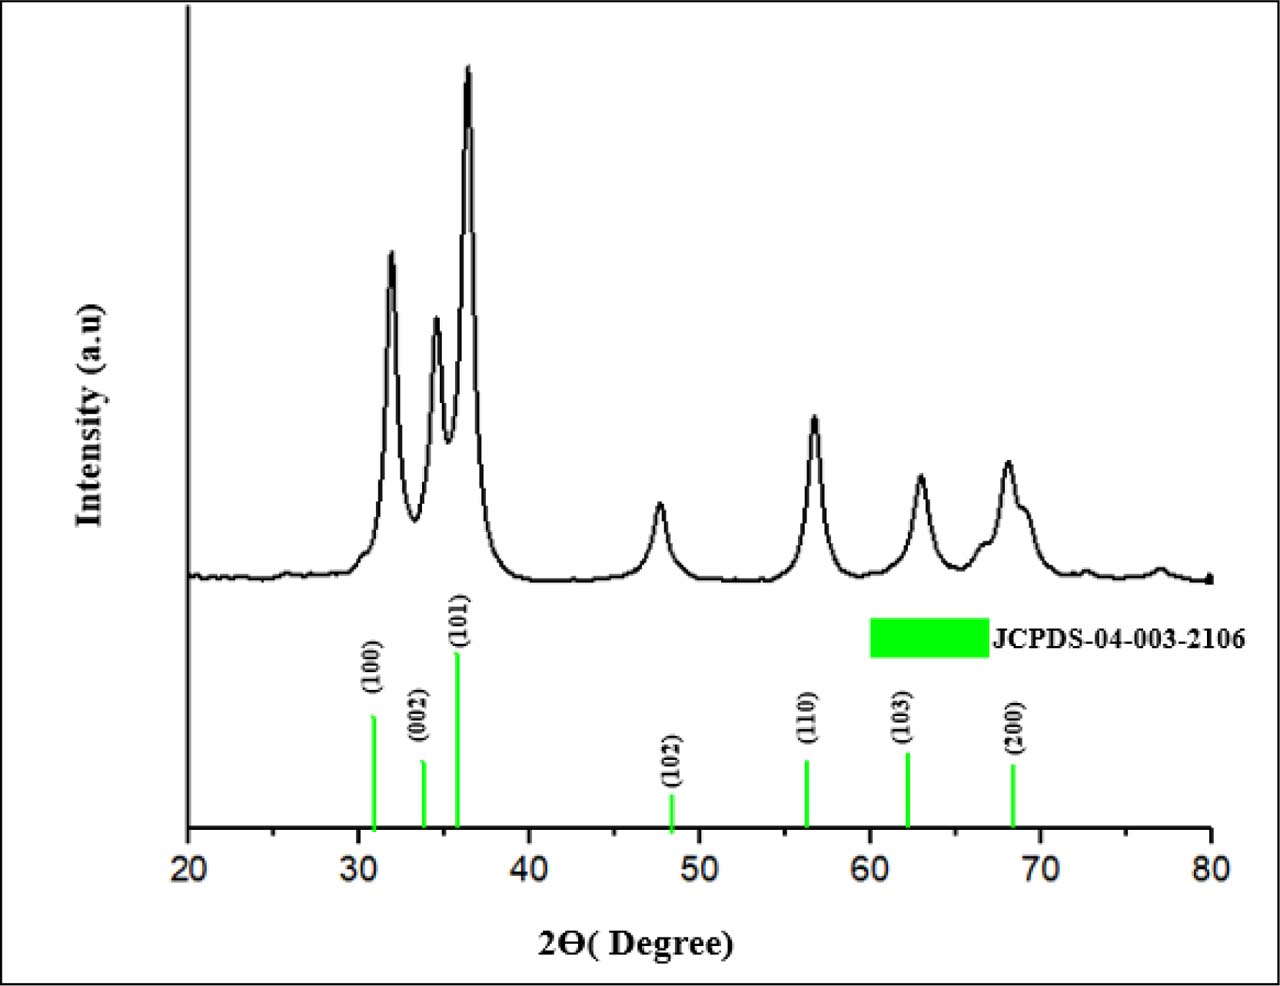
Fig. 7.
X-ray diffraction (XRD) pattern of biosynthesized ZnO-NPs (pH 8.0, calcined at 430°C for 2 h). The diffraction peaks at 2θ = 31.8°, 34.5°, 36.2°, 47.6°, 56.6°, 62.9°, and 68.2° correspond to the (100), (002), (101), (102), (110), (103), and (200) planes of hexagonal wurtzite ZnO, in agreement with the JCPDS standard (card no. 04-003-2106) (Kisi & Elcombe, 1989), confirming high crystallinity and phase purity.
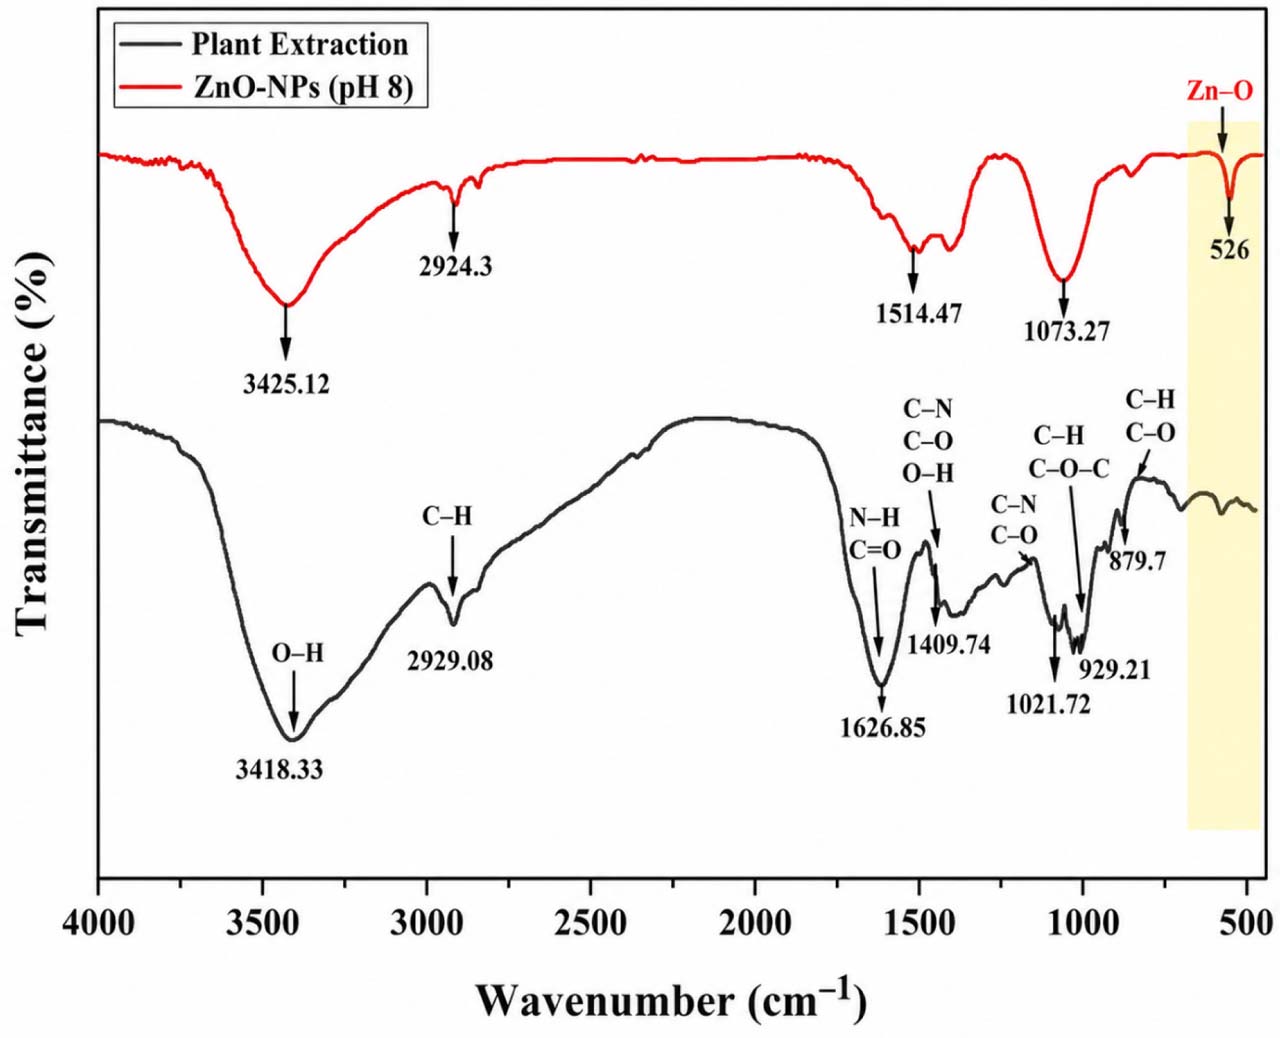
Fig. 8.
FTIR spectra of the ARVR plant leaf extract and the biosynthesized ZnO nanoparticles (ZnO-NPs). The spectra display characteristic absorption bands corresponding to O–H, C–H, C=O, N–H, C–N, and C–O functional groups, highlighting the role of phytochemicals in ZnO-NP formation and stabilization. The distinct band observed at ~526 cm−1 confirms Zn–O stretching vibrations.
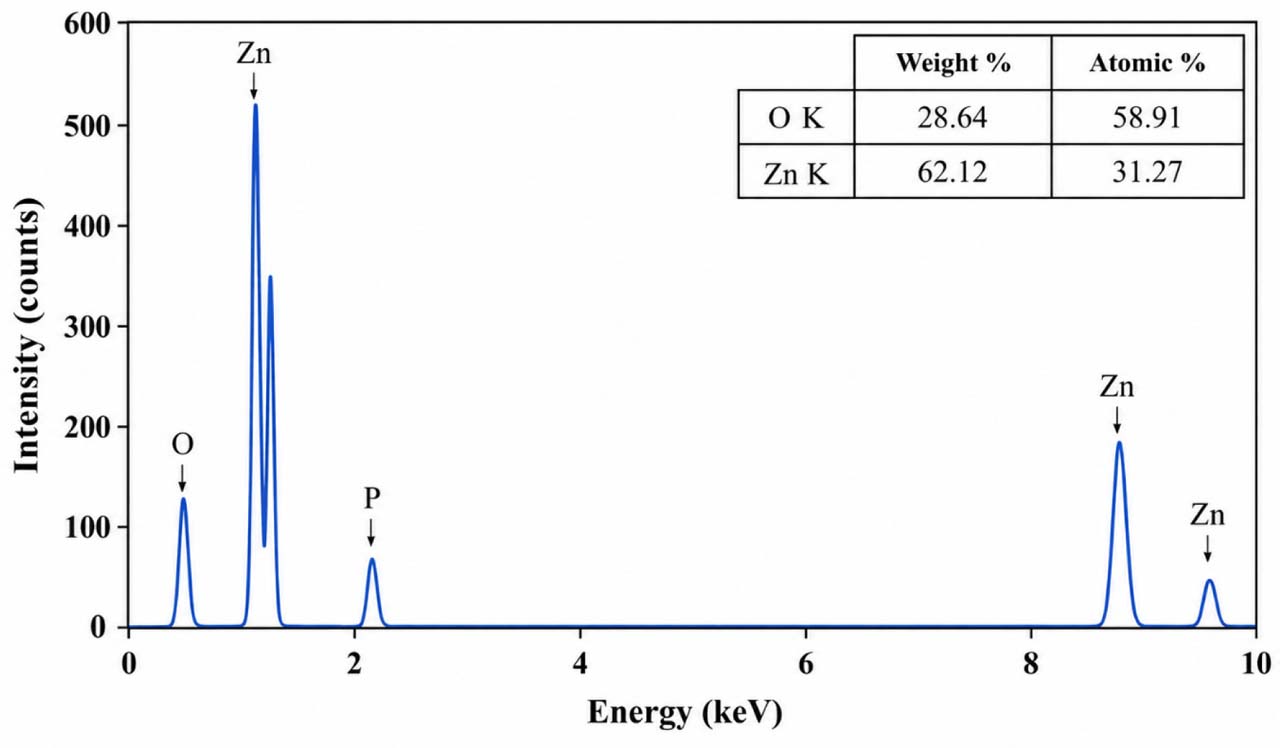
Fig. 9.
Energy-dispersive X-ray spectroscopy (EDS) spectrum of biosynthesized ZnO-NPs. Strong peaks for zinc (Zn) and oxygen (O) confirm ZnO formation, with Zn (62.12 wt%) as the dominant element and O (28.64 wt%).
A minor phosphorus (P) peak was also detected, likely originating from phytochemicals in the plant extract.
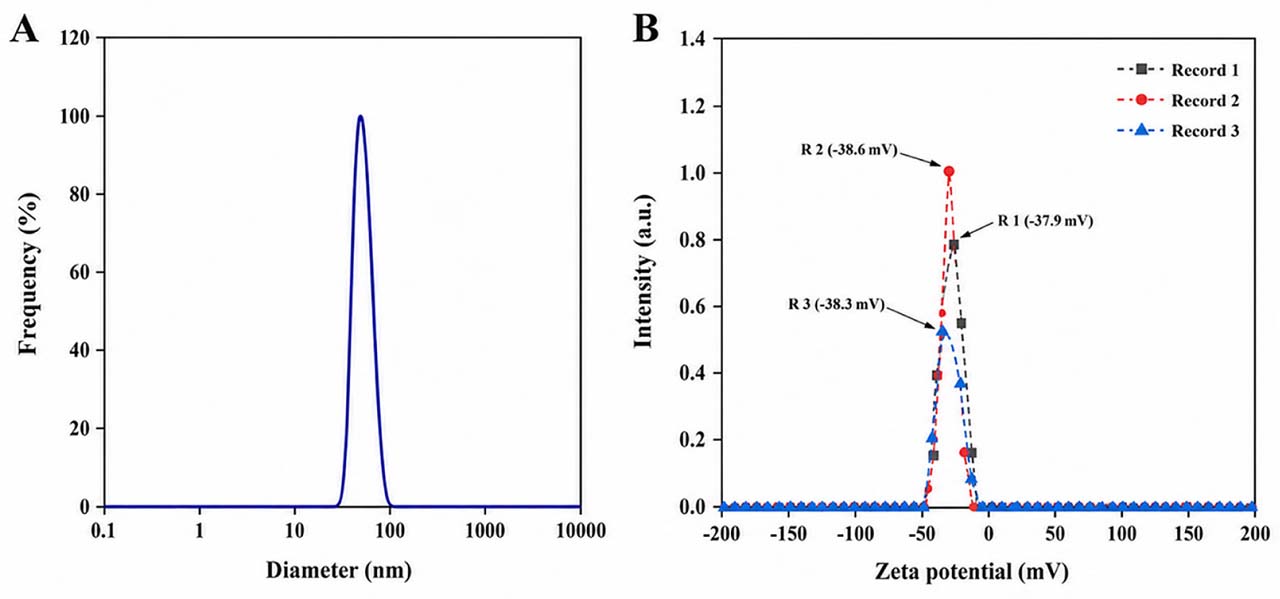
Fig. 10.
(A) DLS analysis showing a Z-average hydrodynamic diameter of ~80 nm and a moderate polydispersity index (PDI) of 0.36, measured in triplicate. (B) Zeta potential of ZnO-NPs in aqueous solution at 25 °C, showing a negative charge of −28.3± 0.286 mV (triplicate readings), indicating good colloidal stability.
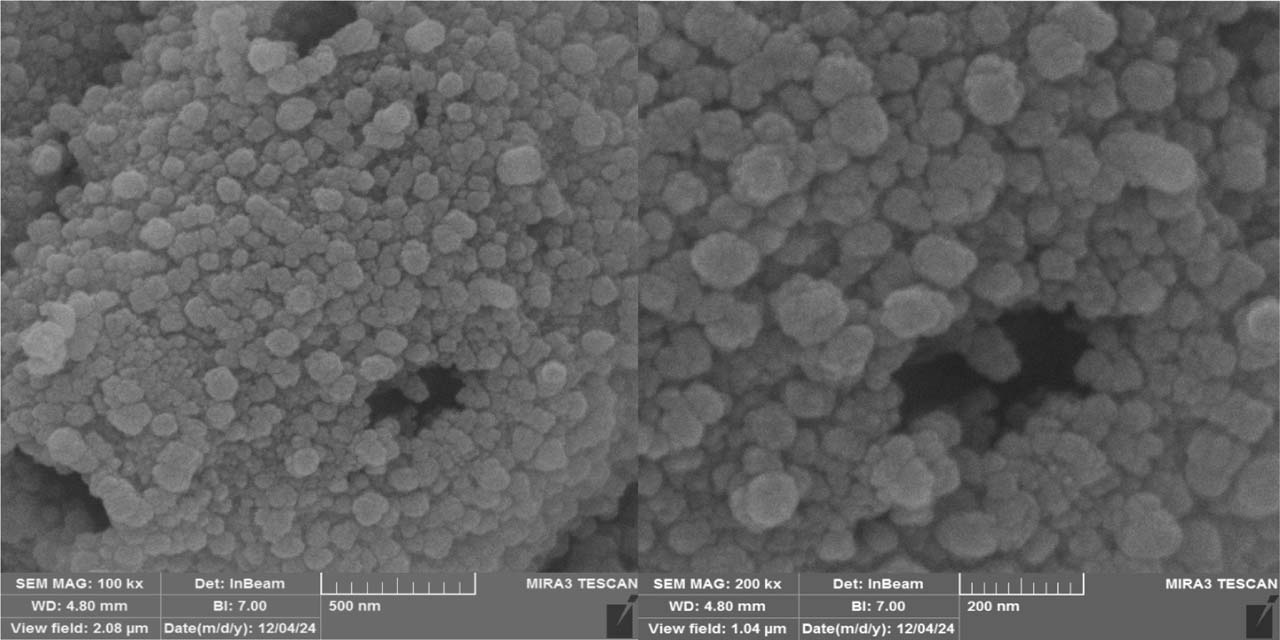
Fig. 11.
SEM images of biosynthesized ZnO-NPs showing predominantly spherical particles with occasional flower-like aggregates. Scale bars: 500 nm (A) and 200 nm (B).
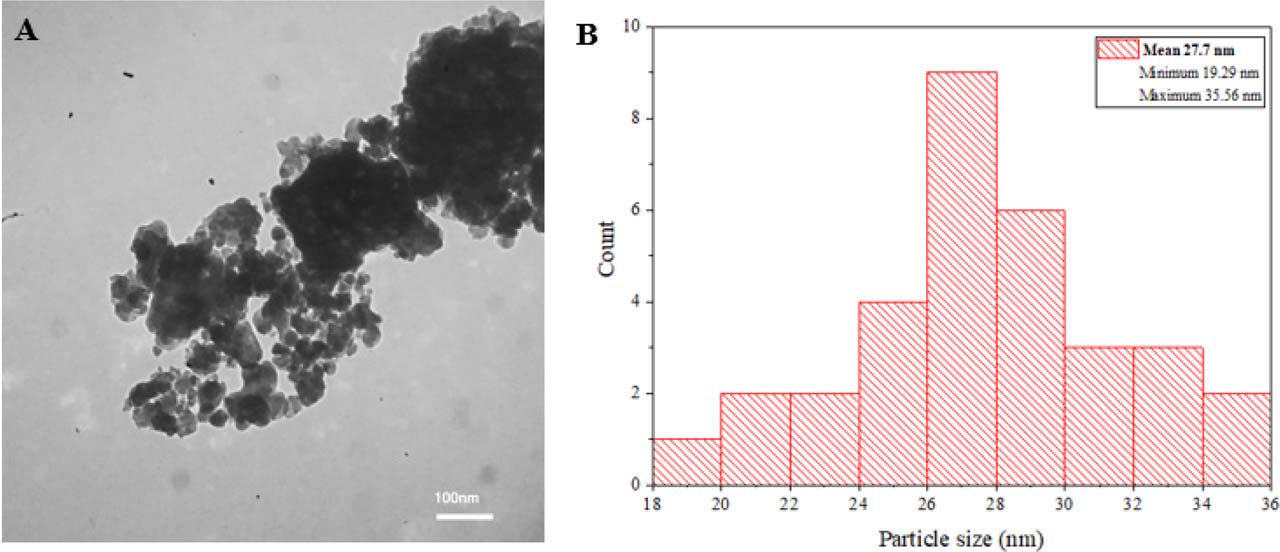
Fig. 12.
A: Representative TEM image showing aggregated but nearly spherical nanoparticles (scale bar = 100 nm). B: Particle size distribution histogram with Gaussian fitting, indicating a size range of 20–35 nm and an average diameter of ~27.7 ± 3.9 nm.
Table III
Minimum inhibitory concentration (MIC) and minimum bactericidal concentration (MBC) values of ARVR-derived ZnO-NPs against clinical isolates. Values are expressed as mean ± SD (μg/ml, n = 3).
| Bacterial Isolates | MIC (µg/ml) | MBC (µg/ml) |
|---|---|---|
| Staphylococcus epidermidis Charmo3 | 156 ± 20 | 312 ± 10 |
| Klebsiella aerogenes Charmo28 | 156 ± 10 | 312 ± 20 |
| Staphylococcus aureus Charmo4 | 312 ± 10 | 625 ± 15 |
| Escheirchia coli Charmo5 | 312 ± 10 | 625 ± 10 |
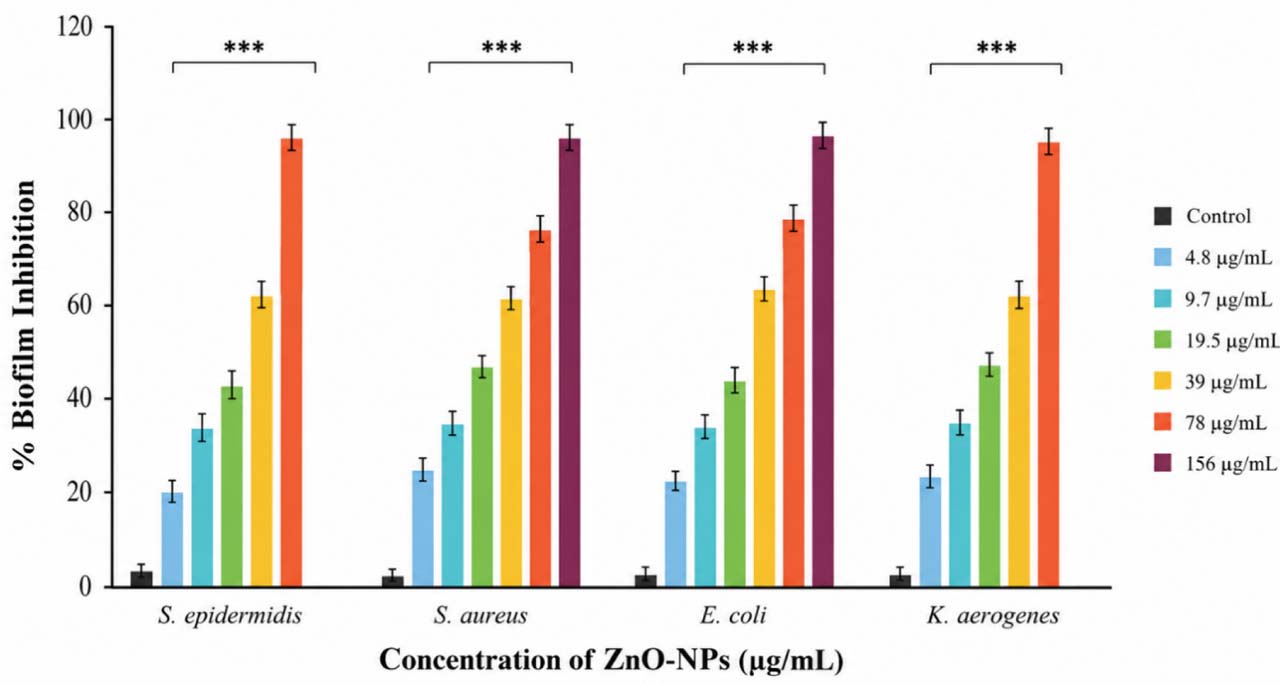
Fig. 13.
Dose-dependent antibiofilm activity of ARVR-derived ZnO-NPs against Staphylococcus epidermidis Charmo3, Staphylococcus aureus Charmo4, Escherichia coli Charmo5, and Klebsiella aerogenes Charmo28. Biofilm inhibition was quantified after 24 h of exposure to increasing ZnO-NPs concentrations (4.8–156 μg/ml). Data are expressed as mean ± SD from three independent biological replicates.
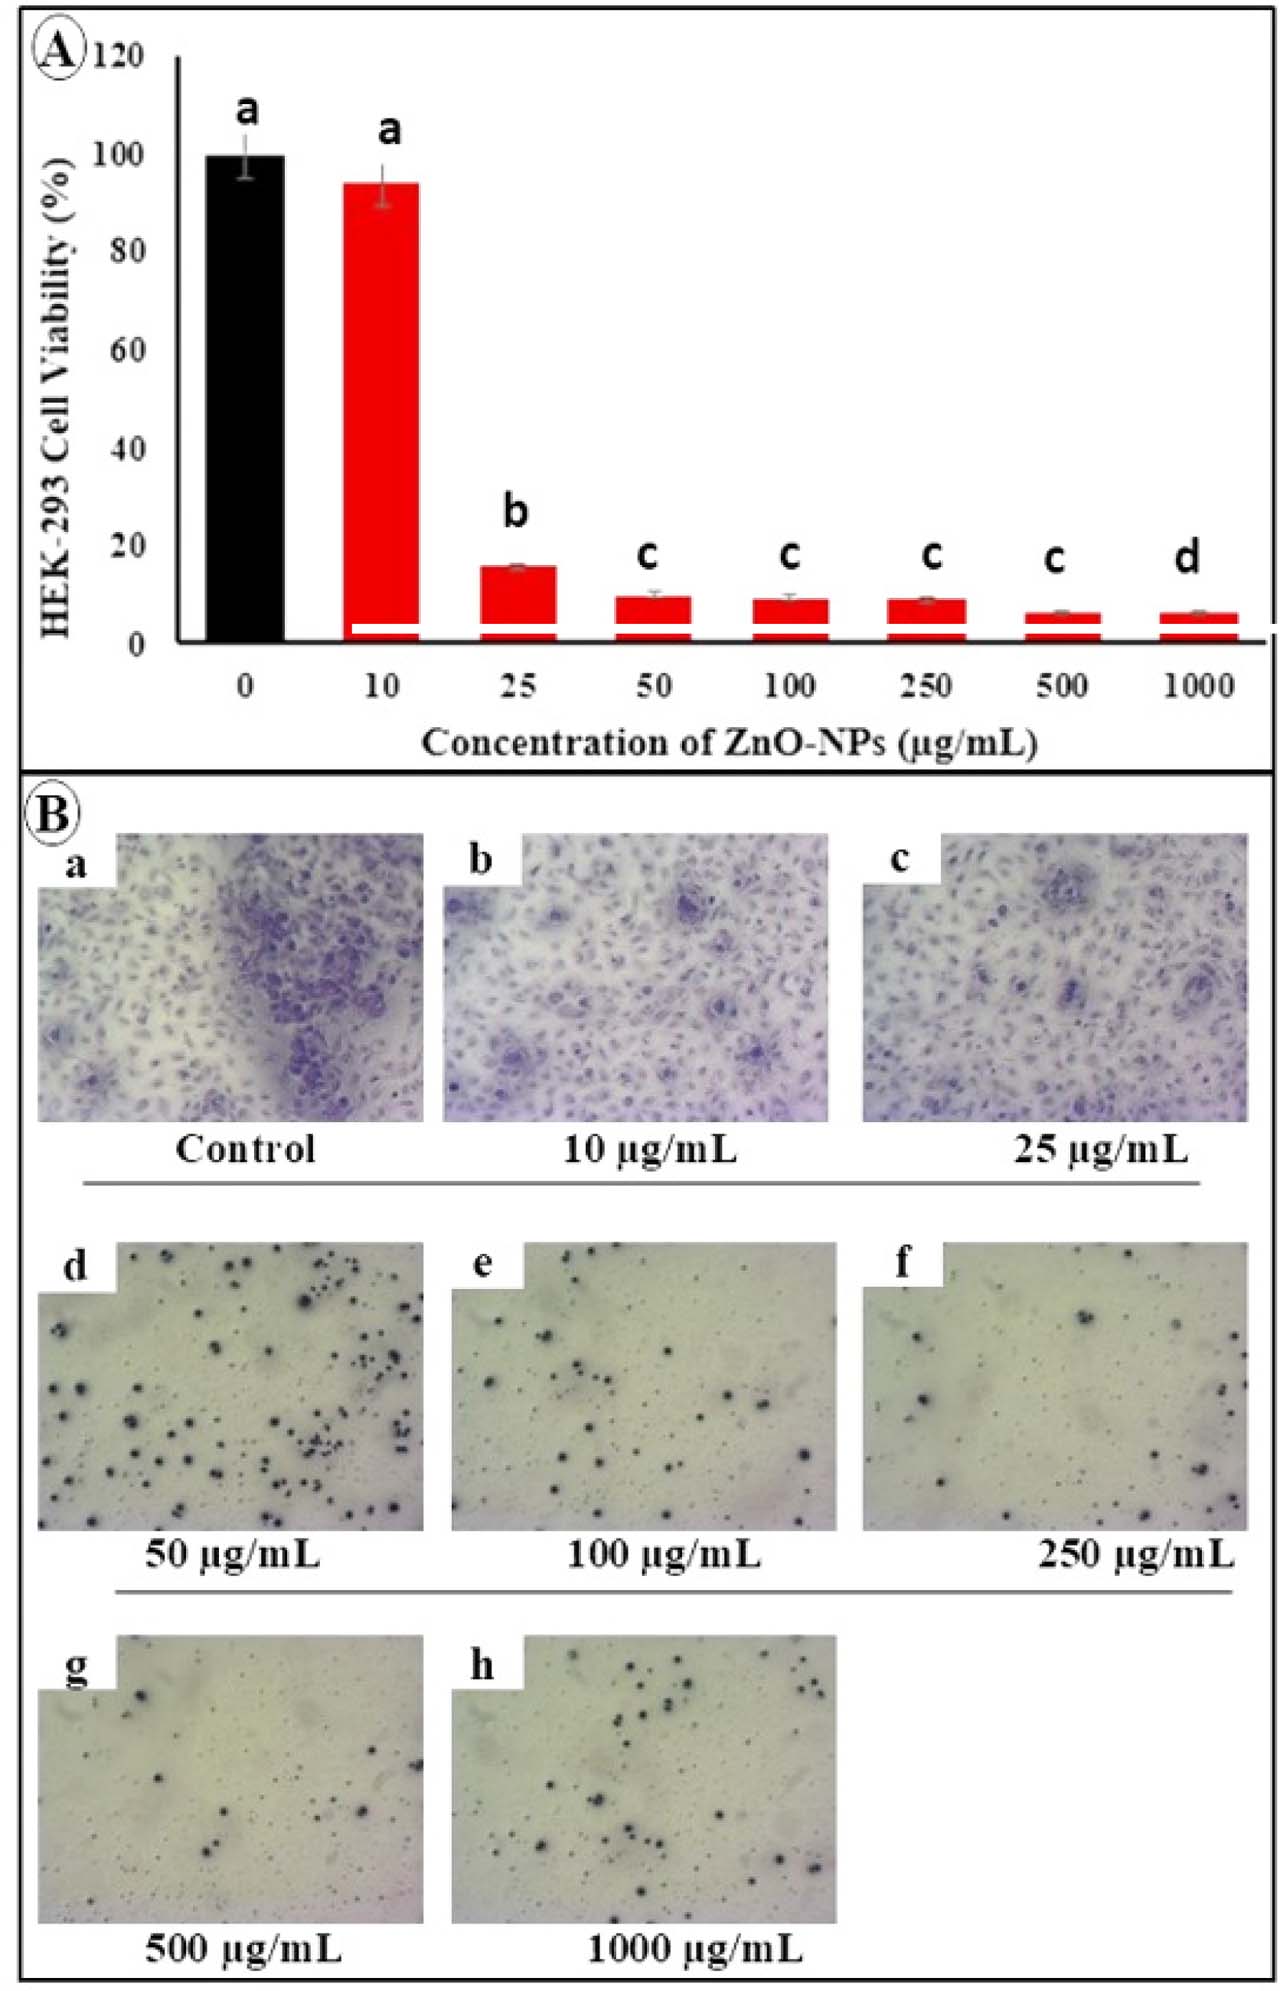
Fig. 14.
Cytotoxic and morphological effects of ZnO-NPs on HEK-293 cells. (A) Cell viability (%) after 24 h exposure to ZnO-NPs (0–1000 μg/ml), determined by MTT assay and expressed relative to control (100%). Data represent mean ± SD (n = 3).
Different letters indicate significant differences (p < 0.05; one-way ANOVA with Tukey’s post hoc test).
The IC50 value was 16.67 μg/ml. (B) Representative images of HEK-293 cells after 24 h treatment showing concentration-dependent morphological changes, including reduced cell density and cell shrinkage compared to control.