
Table I
Distribution of intervention-related drugs and nutritional support in each group.
| Intervention project | Case group AG (n = 45) | Control group BG (n = 30) |
|---|---|---|
| Antibiotic use within 72 hours of admission | 45(100.0%) | 0(0.0%) |
| Enteral nutrition support | 28(62.2%) | 0(0.0%) |
| Parenteral nutrition support | 17(37.8%) | 0(0.0%) |
| Use of laxatives | 13(28.9%) | 0(0.0%) |
| Use of intestinal mucosal protectants | 15(33.3%) | 0(0.0%) |
Table II
Comparison of baseline clinical data.
| Item | AG (n = 45) | BG (n = 30) | Statistics | P |
|---|---|---|---|---|
| Age (years) | 62.5±10.8 | 59.8±9.5 | t = 1.124 | 0.264 |
| Sex (male/female) | 28 (62.2)/17 (37.8) | 18 (60.0)/12 (40.0) | χ2 = 0.047 | 0.828 |
| APACHE II score (points) | 21 (18,25) | - | - | - |
| SOFA score (points) | 9 (7,12) | - | - | - |
| SCr (μmol/l) | 285.4 (198.2,376.5) | 75.1 (66.3,84.0) | Z = −7.215 | <0.001 |
| BUN (mmol/l) | 22.6 (16.8,30.1) | 5.4 (4.5,6.3) | Z = −7.232 | <0.001 |
| CRP (mg/l) | 128.3 (95.7,160.4) | <5 | Z = −7.241 | <0.001 |
| IL-6 (pg/ml) | 215.6 (150.8,302.7) | <10 | Z = −7.228 | <0.001 |
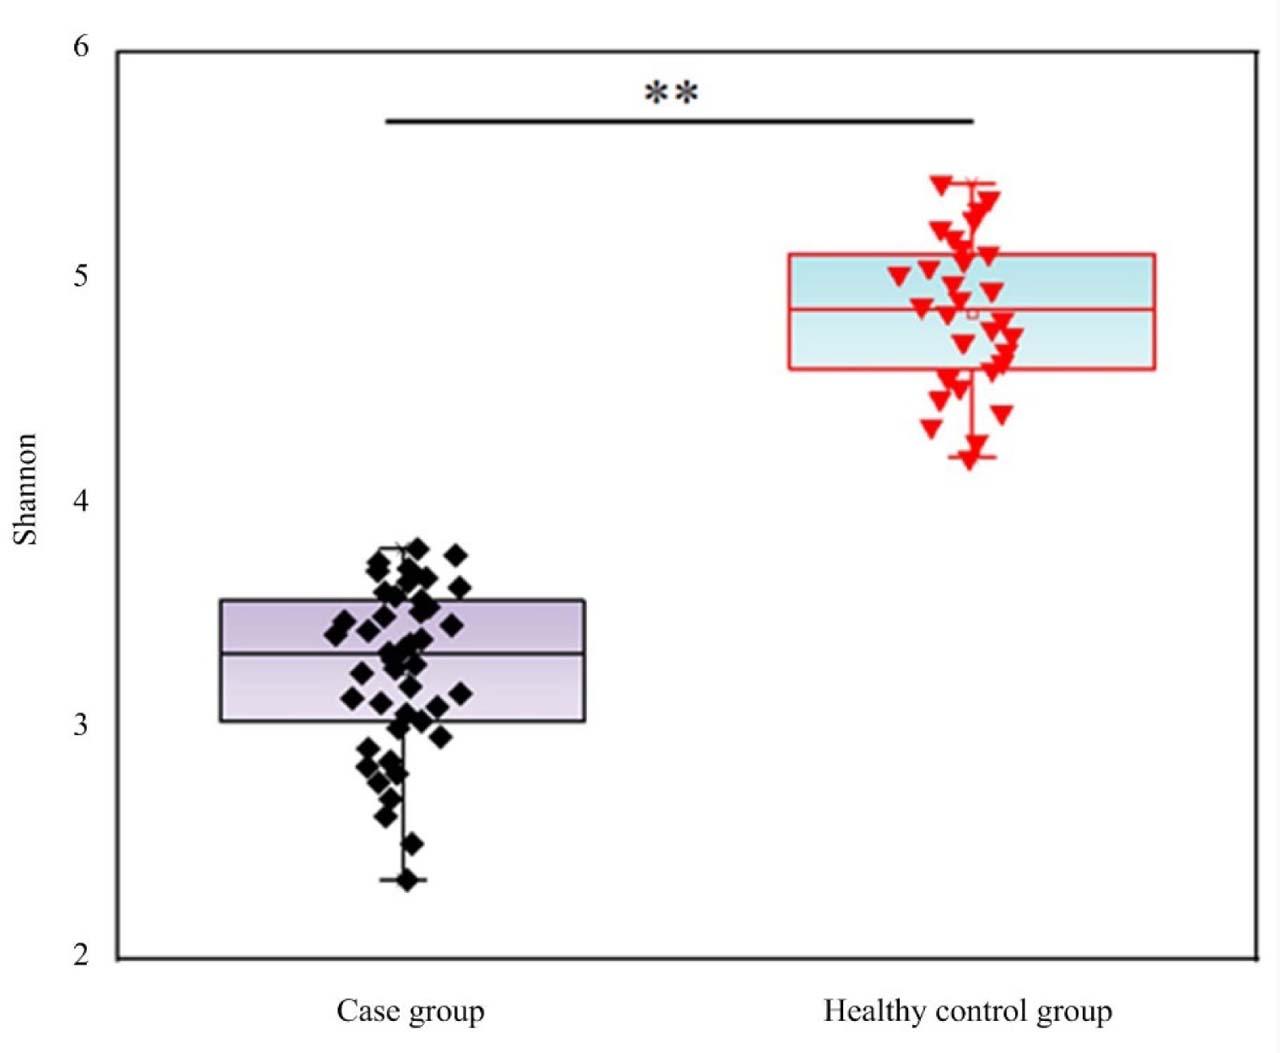
Fig. 1.
Shannon index of GM diversity in SA-AKI patients and healthy controls. Compared with the control group, the Shannon index of the case group, ** P <0.01
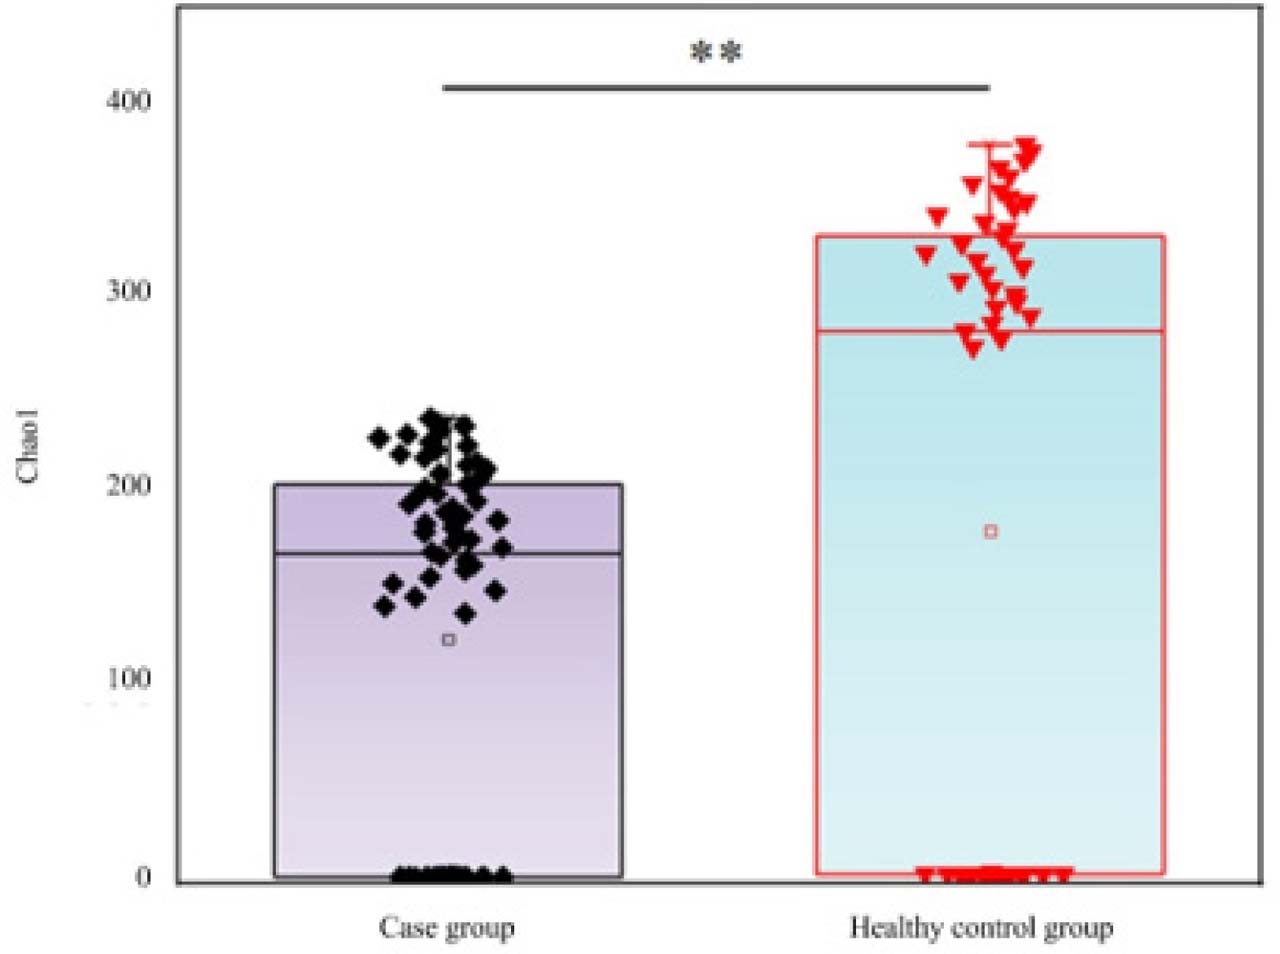
Fig. 2.
Chao1 index of GM diversity in SA-AKI patients and healthy controls. Compared with the control group, the Chao1 index in the case group, ** P <0.01
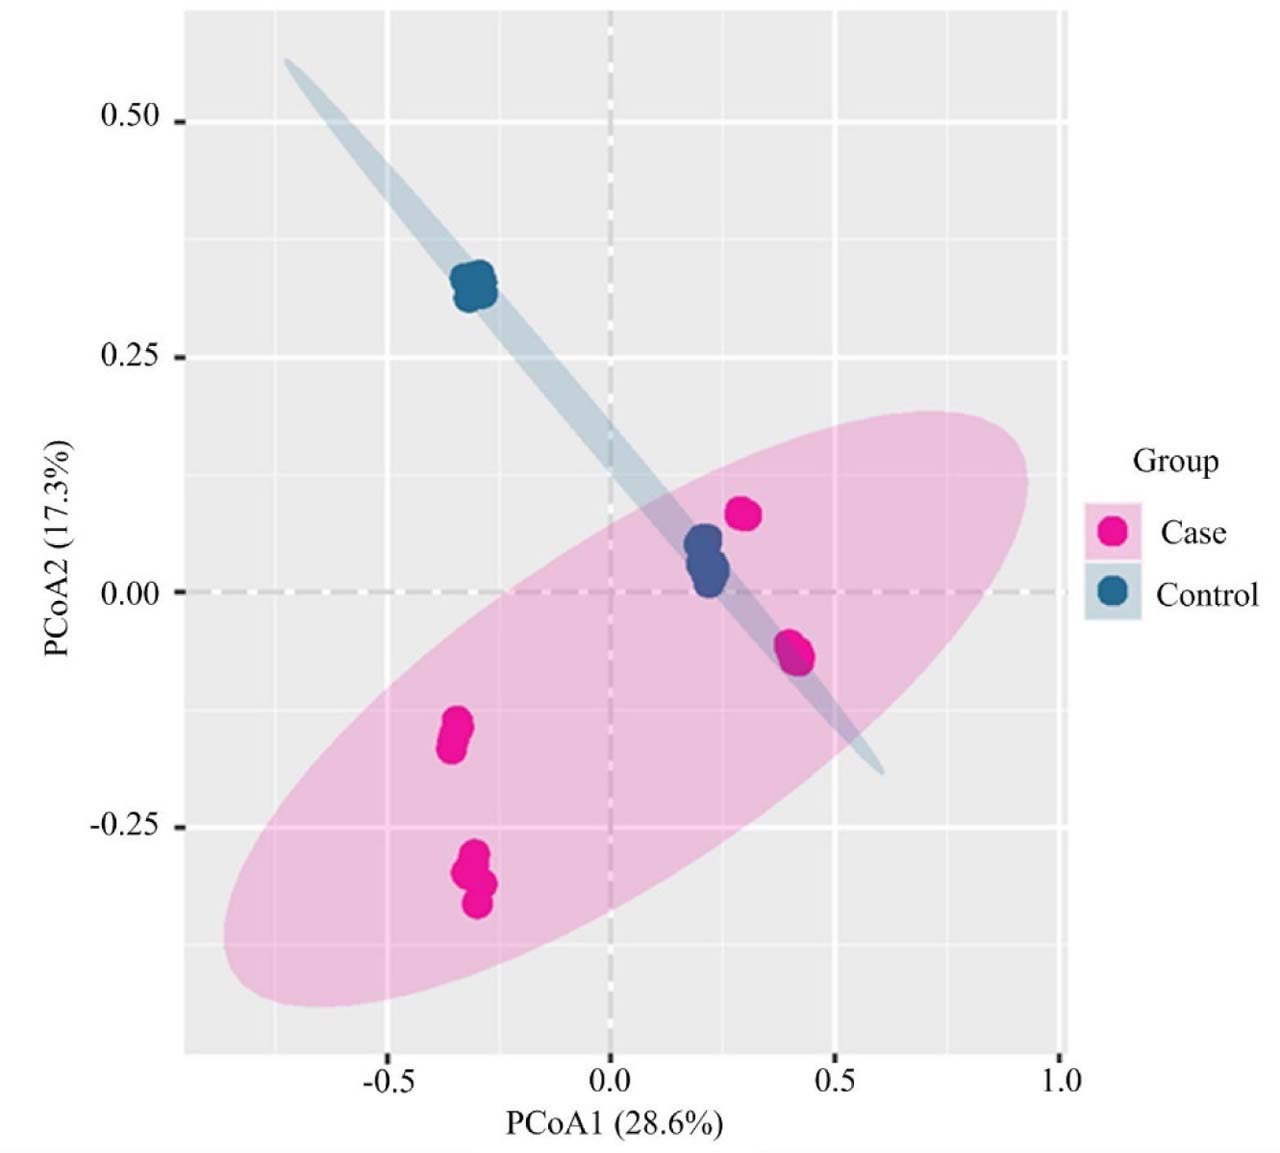
Fig. 3.
PCoA analysis based on Bray-Curtis distance. The high concentration of the control group is due to the homogenization of microbiota in healthy individuals
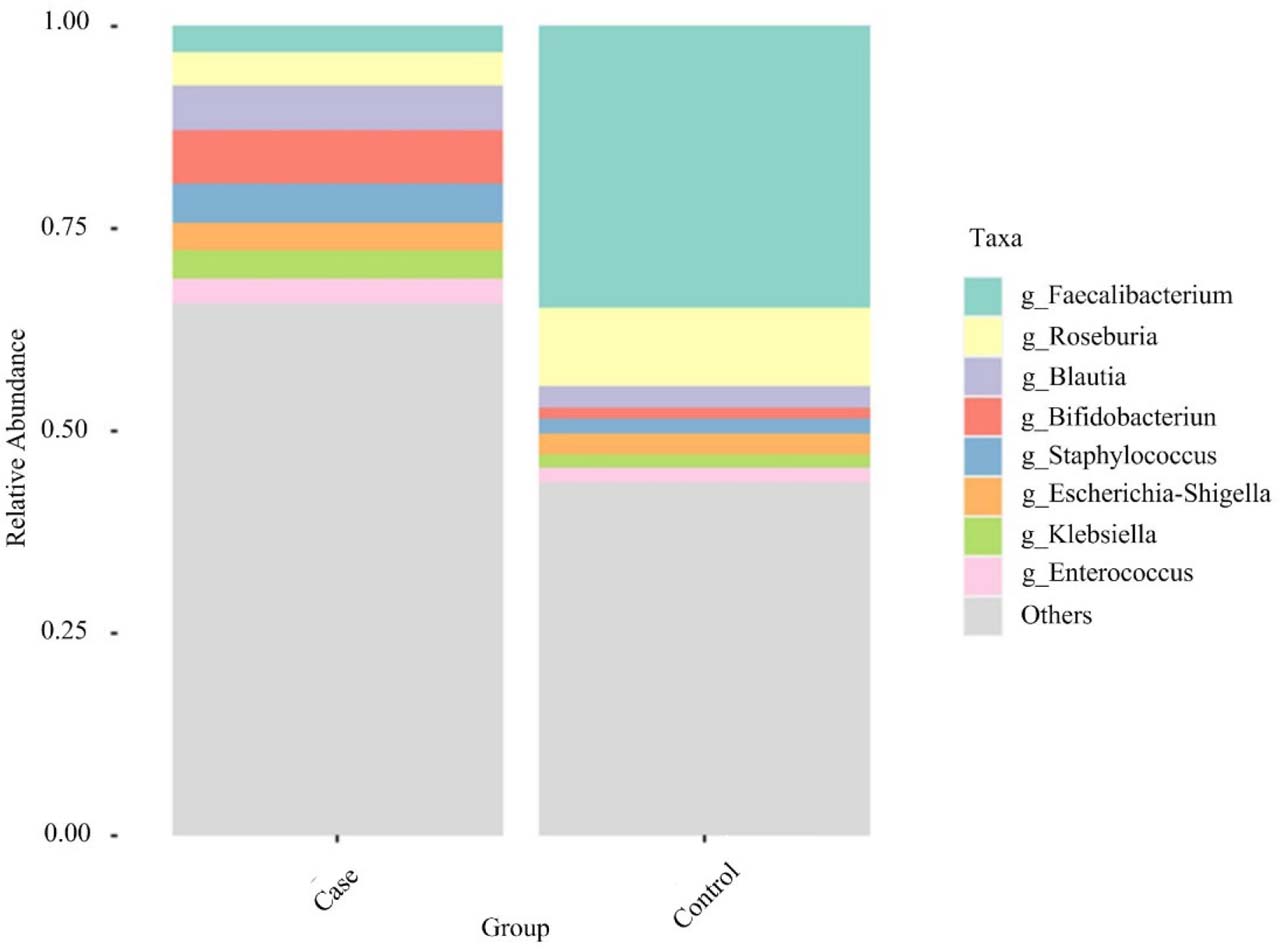
Fig. 4.
Stacked bar charts of RA of GM at genus level.
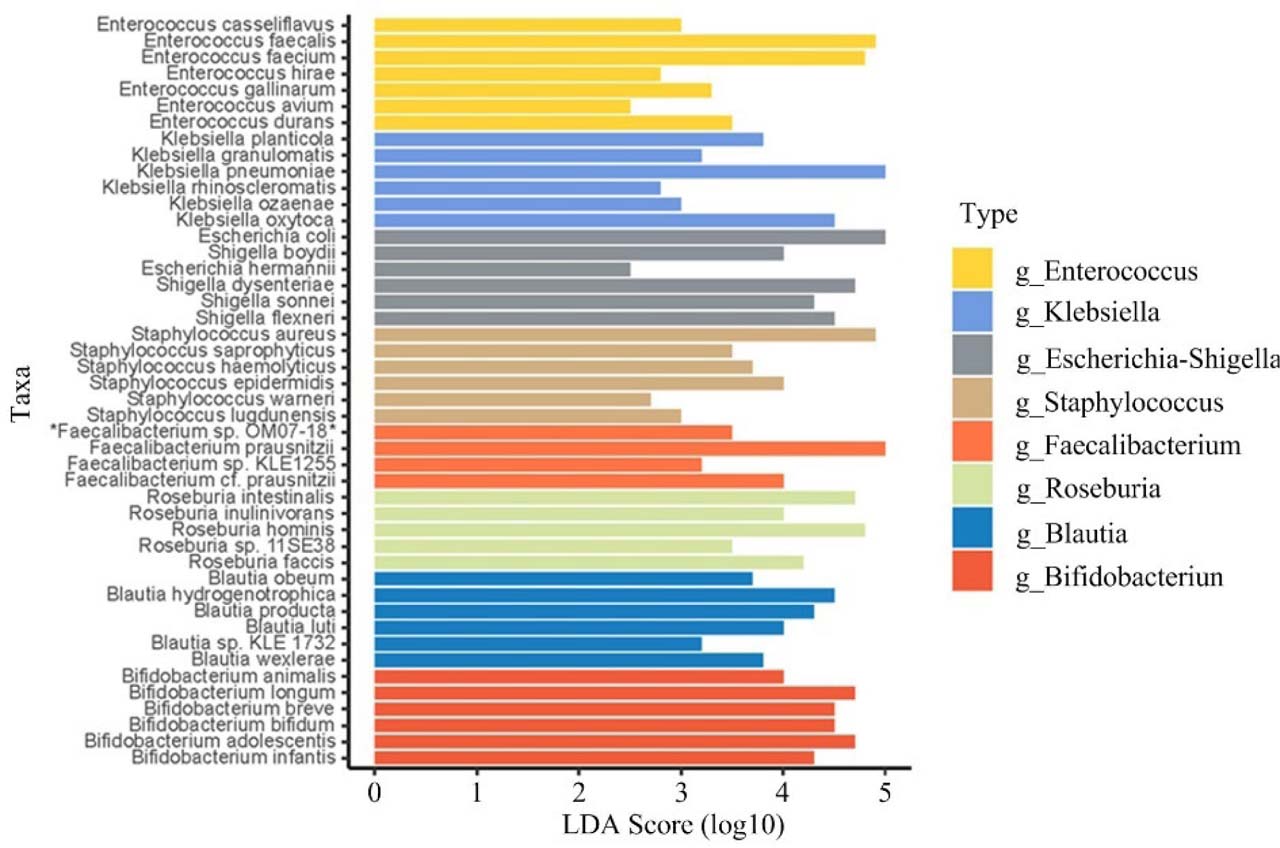
Fig. 5.
LEfSe analysis of signature microbiota with significant abundance differences.
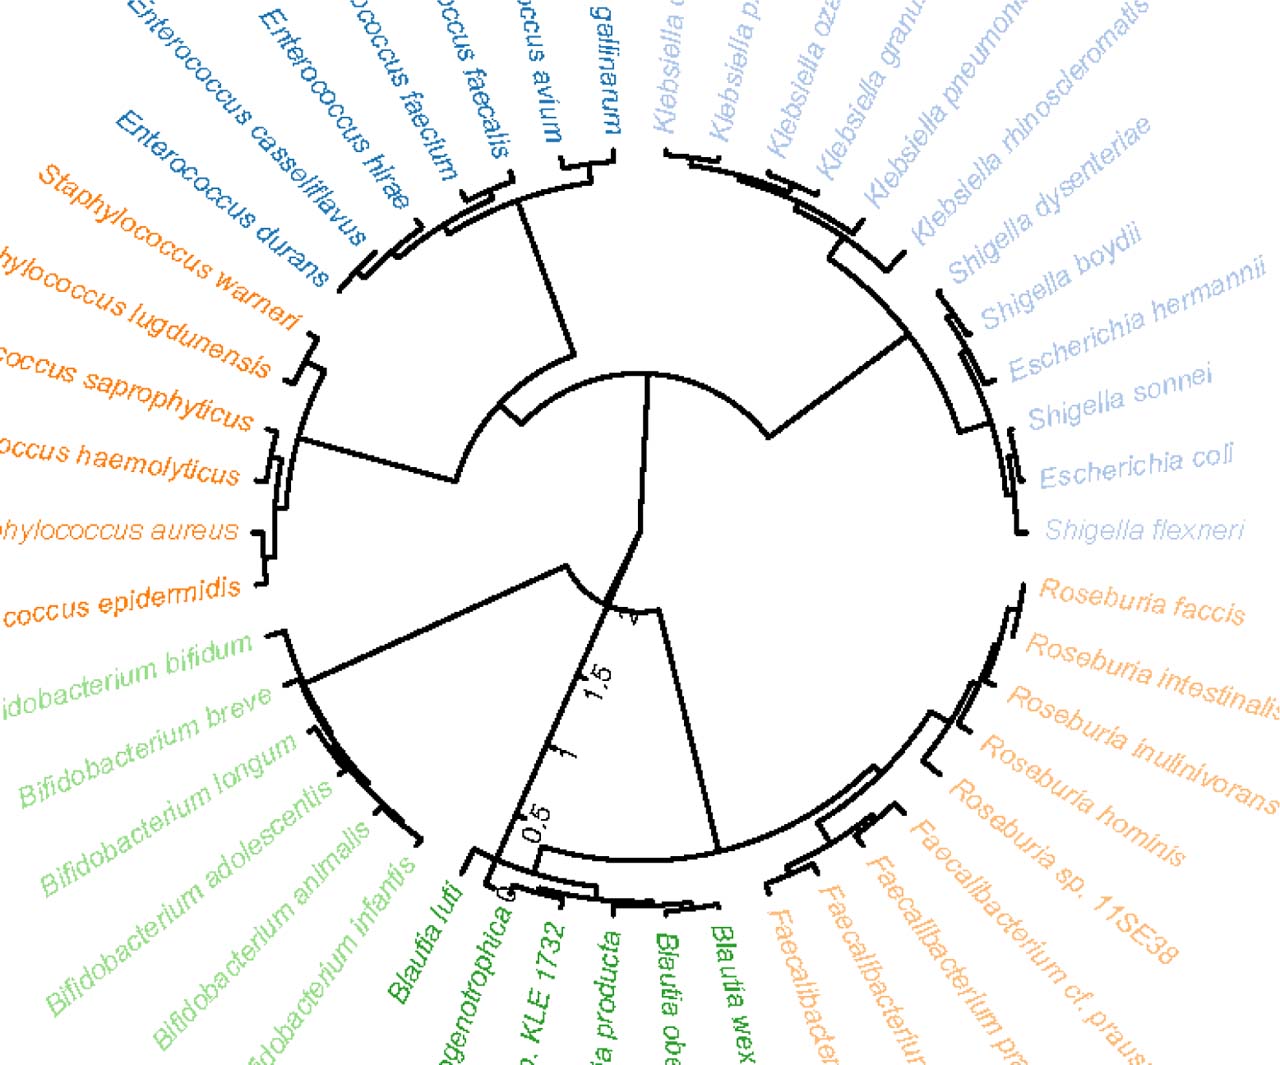
Fig. 6.
Cladogram from LEfSe analysis.
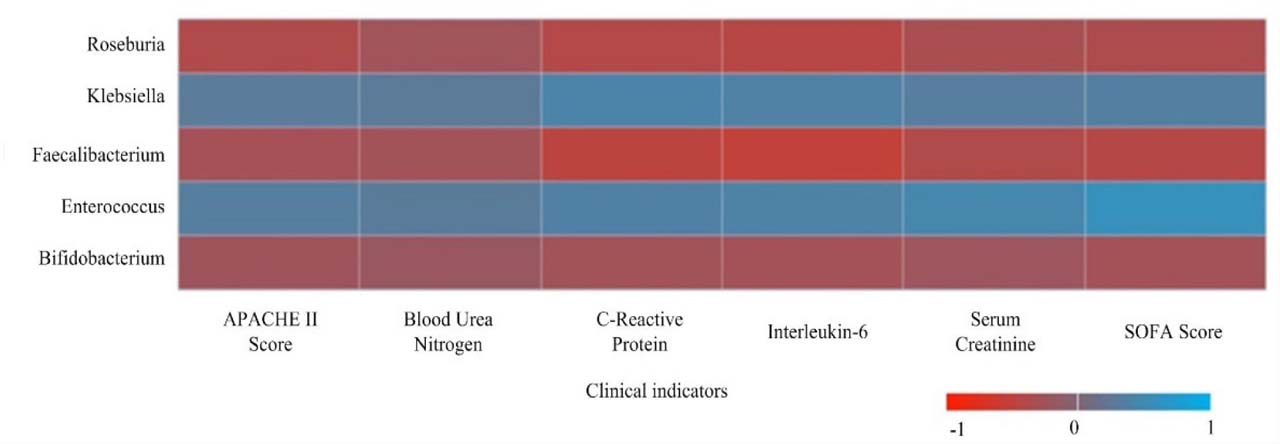
Fig. 7.
Heatmap of correlation between key genus abundance and clinical indicators in SA-AKI patients.
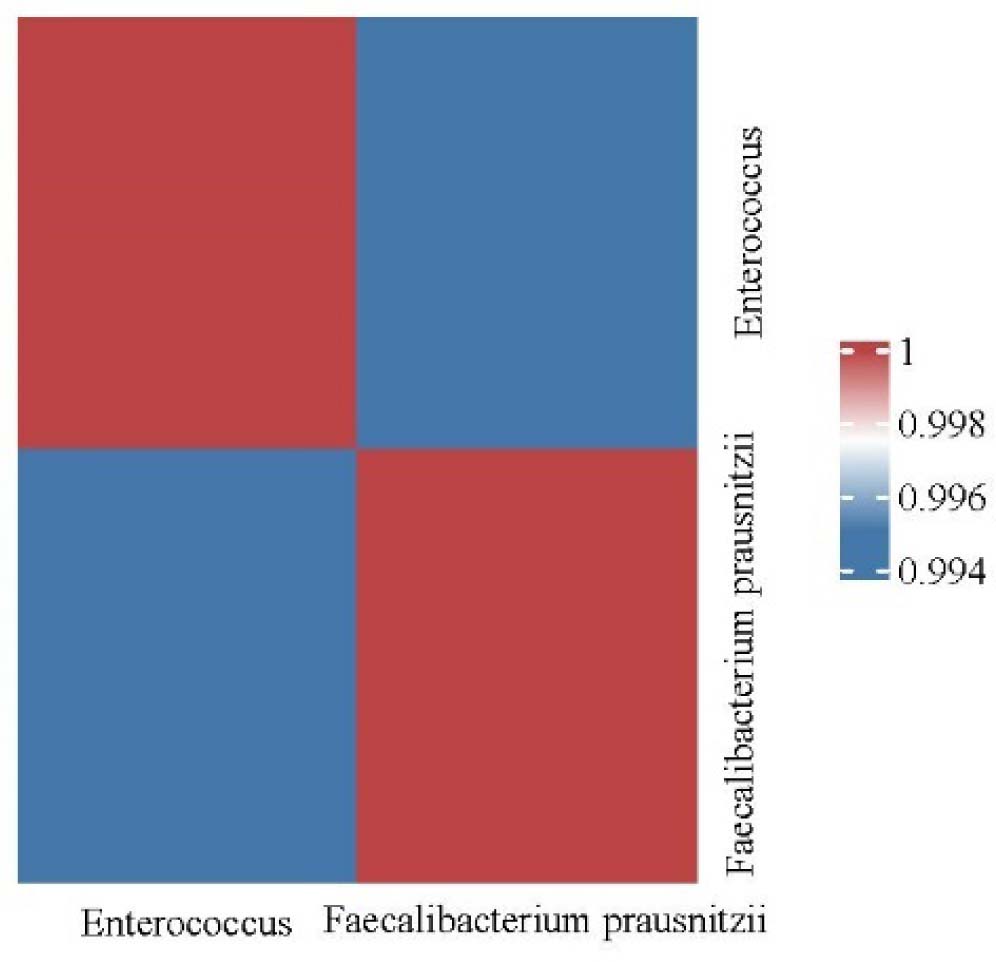
Fig. 8.
Correlation heatmap between key differential bacterial genera and novel renal injury markers.