
Introduction
Sepsis is one of the most common critical illnesses in clinical practice (Takeuchi et al. 2025; Zhang et al. 2025). During the complex pathophysiological process of sepsis, acute kidney injury is a complication with high incidence and severe consequences, which is clinically defined as sepsisassociated acute kidney injury (SAAKI) (Gao et al. 2024; Shi et al. 2025). Epidemiological data show that SAAKI has high morbidity and mortality in intensive care units, not only significantly increasing the short-term risk of death in patients but also potentially causing long-term renal dysfunction, thereby imposing a heavy burden on healthcare systems (Kounatidis et al. 2024; Odum et al. 2025). It is currently understood that the pathogenesis of SAAKI involves multiple aspects, including systemic inflammatory response dysregulation, endothelial cell injury, microcirculatory dysfunction, and cellular metabolic reprogramming. However, traditional inflammatory theories can no longer fully explain its complex clinical phenotype and heterogeneity (Liu et al. 2024; Fiorentino et al. 2024).
In recent years, with the indepth investigation of the “gutaxis” theory, particularly the proposal and refinement of the gutkidney axis concept, the academic community has gradually recognized the close bidirectional regulatory relationship between the gut and the kidneys (Lan et al. 2023; Wang et al. 2012; Pahl and Vaziri 2015). The gut is no longer considered merely a digestive and absorptive organ, but also the largest immune organ and microbial colonization site in the human body (Pan et al. 2023; Wakino et al. 2025). Under physiological conditions, the gut microbiota maintains intestinal barrier integrity and regulates immune function through substances such as shortchain fatty acids and tryptophan metabolites, thereby indirectly affecting the function of distal organs (Kullberg et al. 2025). However, in critical conditions such as sepsis, this homeostasis is easily disrupted. Due to factors including hemodynamic instability, immunosuppression, broadspectrum antibiotic use, and changes in nutritional support, patients often develop significant structural and functional abnormalities of the gut microbiota, i.e., dysbiosis (Xu, 2025; Kong et al. 2024).
This dysbiosis can exacerbate sepsis through multiple pathways. On the one hand, opportunistic pathogens overproliferate and translocate into the bloodstream, triggering secondary infections (Luo et al. 2025). On the other hand, reduced beneficial bacteria lead to insufficient production of anti-inflammatory metabolites, while impaired intestinal barrier integrity allows endotoxins and microbial metabolites to enter the systemic circulation, activating immune cells and exacerbating systemic inflammation as well as distal organ injury (Li et al. 2025).
Although the role of the gut-kidney axis in acute kidney injury has gained increasing attention, research specifically focusing on gut microbiota in the context of SA-AKI remains limited. Among existing studies, Saranya and Viswanathan (2023) reviewed the interrelationship between gut microbiota and AKI, Noel et al. (2025) employed metagenomic techniques to characterize the microbiota of populations with chronic kidney disease and AKI, and earlier classic studies by Evenepoel et al. (2017) laid the theoretical foundation for the gut-kidney axis, thereby providing a theoretical basis for the present study. However, the former is a review lacking clinical empirical data, while the latter did not focus on the specific microbiota alterations in SAAKI, nor did it simultaneously correlate disease severity with novel biomarkers of kidney injury. Therefore, the diversity changes, compositional characteristics, and associations of the gut microbiota with disease status, inflammation, and kidney injury in patients with SAAKI require further elucidation.
Meanwhile, traditional renal function indicators such as serum creatinine have low sensitivity and delayed elevation, making it difficult to identify kidney injury at an early stage. Novel biomarkers, including neutrophil gelatinase associated lipocalin (NGAL), cystatin C (CysC), kidney injury molecule1 (KIM1), and soluble urokinase type plasminogen activator receptor (suPAR), can reflect tubular injury earlier and more sensitively and have been recommended for the early assessment of AKI. A combined analysis of these biomarkers with the gut microbiota may more comprehensively reveal the role of the gutkidney axis in SAAKI.
Accordingly, the present study employed high-throughput sequencing technology to systematically analyze the structural characteristics of gut microbiota in patients with SA-AKI and to explore correlations between differential microbiota and traditional and novel kidney injury indicators, inflammatory factors, and disease severity scores. This study aims to provide a theoretical basis for elucidating the pathogenesis of SAAKI, identifying potential biomarkers, and developing microbiota based intervention strategies.
Experimental
Materials and Methods
Participants
The case group (AG) consisted of adult SA-AKI patients admitted to the ICU of the First Affiliated Hospital of Hebei North University and Zhangjiakou First Hospital from July 2023 to August 2025. The diagnostic criteria were based on the International Guidelines for the Management of Sepsis and Septic Shock (Sepsis-3) (Singer et al. 2016) and the KDIGO Clinical Practice Guideline. Inclusion: ≥18 years, those who meet the Sepsis-3 criteria for sepsis and the KDIGO criteria for AKI stage 2 or 3, with complete clinical data and fecal samples collected within 24 hours after ICU admission (before or at the start of antibiotic treatment). Exclusion: use of antibiotics or probiotics within 4 weeks before admission, chronic kidney disease (CKD stages 4–5), inflammatory bowel disease, chronic diarrhea, previous gastrointestinal surgery, pregnancy or lactation, and an expected survival time of < 48 hours. The system collected information on clinical interventions related to gut microbiota within 72 hours of the case group patients’ admission to the ICU. This included the types of antibiotic exposure, timing of administration, duration of treatment, methods of nutritional support (enteral/parenteral), formulas, and initiation time, as well as the use of related medications such as laxatives and intestinal mucosal protectants. All intervention information was independently extracted and verified by two senior physicians.
The control group (BG) consisted of individuals who underwent health check-ups at the hospital during the same period. The selection criteria were no acute or chronic diseases, no recent use of antibiotics or probiotics, matching in age and sex with the AG, with complete basic data and fecal samples collected during the check-up.
This study was a retrospective analysis, with all data sourced from clinical records archived and biobank samples in the hospital. No additional informed consent from the participants was required. The protocol was approved by the Ethics Committee of the First Affiliated Hospital of Hebei North University.
The control group in this study consisted only of healthy individuals, which is a major limitation of the study design. A more appropriate control would have included at least: (1) patients with sepsis alone without AKI; (2) patients with AKI due to nonseptic causes; and (3) patients with sepsis in the same ICU and with similar disease severity but without AKI. The observed differences in gut microbiota may therefore reflect, in part, the critical illness state in the ICU rather than being entirely attributable to SAAKI itself.
Clinical data and sample collection
Demographic data (age, sex) of all participants were retrospectively extracted from the electronic medical record system. For SA-AKI patients, clinical scores (APACHE II score, SOFA score) and laboratory test results within 24 hours after ICU admission were extracted, including renal function indicators and inflammatory markers. Fecal samples were obtained from the biobank: those from SA-AKI patients were collected within 24 hours after ICU admission, and those from healthy controls were collected during the check-up. All samples were immediately placed into sterile sampling tubes and transferred to a −80°C freezer. Sample collection strictly followed aseptic procedures, and samples were frozen within 30 minutes after collection to avoid contamination and changes in the microbial community structure.
DNA extraction and PCR amplification
Genomic DNA was extracted from approximately 200 mg of fecal samples using the QIAamp Fast Stool DNA Mini Kit (Qiagen, Germany). A blank negative control (containing only extraction reagents without fecal sample) was included to exclude contamination from reagents and handling. DNA purity was assessed using a Nanodrop 2000 spectrophotometer, with the A260/A280 ratio controlled between 1.8 and 2.0. DNA integrity was verified by 1% agarose gel electrophoresis.
The V3–V4 region of the 16S rRNA gene was amplified using primers 338F/806R synthesized by GenScript (Nanjing, China). The PCR reaction system (25 μl) consisted of 12.5 μl of 2× Taq Mix, 1 μl each of forward and reverse primers, 2 μl of template DNA, and 8.5 μl of nuclease-free water. The amplification program was as follows: initial denaturation at 95°C for 5 min; 30 cycles of denaturation at 95°C for 30 s, annealing at 55°C for 30 s, and extension at 72°C for 45 s; followed by a final extension at 72°C for 10 min. The PCR products were verified by 1.5% agarose gel electrophoresis and purified using an Axygen kit. The negative control was subjected to the same amplification and purification procedures; only when no specific bands were observed in the negative control could subsequent experiments proceed.
The operations and quality control standards related to DNA quality control, PCR electrophoresis, and product purification are not repeated in Section 2.4 (High-throughput sequencing) and Section 2.5 (Bioinformatics analysis). Details of library construction and sequencing are provided in Section 2.4, and details of sequencing data processing and species annotation are provided in Section 2.5.
High-throughput sequencing
The purified PCR products were quantified using a Nanodrop 2000 spectrophotometer. Sequencing libraries were then constructed according to the Illumina MiSeq platform specifications using the Bioo Scientific kit (USA), which involved sequential steps of end repair, A-tailing, adapter ligation, and library enrichment amplification. The insert size (400–500 bp) of the libraries was verified using an Agilent 2100 bioanalyzer, and library concentration (≥ 10 nmol/l) was determined by Qubit 3.0 fluorometric quantification. After dilution and denaturation, the libraries were subjected to PE300 paired-end sequencing. The PhiX Control v3 library was used as a positive control during sequencing, and a blank negative control for sequencing was also included. The effective sequencing reads per sample were no less than 40,000, with an average sequencing depth of 52,000 reads. Raw sequencing data were subjected to initial quality control by removing low-quality reads with a Q-score < 20.
Bioinformatics analysis
Raw sequencing data were filtered using Trimmomatic software to remove bases with Q < 20 at both ends, sequences with a length of less than 200 bp, and sequences containing ambiguous N bases. Valid sequences were assembled using FLASH software with a minimum overlap length of 10 bp and a maximum mismatch rate of 0.02. Chimeras were removed using UCHIME in conjunction with the SILVA database. The negative control yielded no valid operational taxonomic units (OTUs), excluding sample contamination. OTUs were clustered at 97% sequence similarity, and species annotation was performed using the SILVA database (annotation confidence threshold ≥ 0.7). To correct for sequencing depth bias, rarefaction was performed to the minimum effective sequence count among all samples (40,000 sequences), with no sample loss after rarefaction.
Alpha diversity was evaluated using the Chao1 and Shannon indices. Principal coordinate analysis (PCoA) was conducted based on the Bray-Curtis distance. After testing inter-group dispersion using PERMDISP, differences in community structure between groups were analyzed using PERMANOVA. LEfSe analysis was employed to identify differentially abundant species between groups (LDA score > 2.0, P < 0.05), with multiple comparisons corrected using the false discovery rate (FDR) method.
Statistical processing
SPSS 27.0 software and R language packages were utilized. For normally distributed data, means ± SD were reported, and independent-samples t-tests were applied. Non-normally distributed data were reported as median (interquartile range) [M (Q1, Q3)], and Mann-Whitney U tests were applied. Categorical data were reported in the format of number (percentage) [n (%)], and χ2 test or Fisher’s exact tests were applied. Spearman rank correlation analysis was used to evaluate the correlations between the relative abundance (RA) of gut microbiota and clinical indicators. Additionally, partial Spearman correlation analysis was performed to adjust for confounding factors including age, sex, mode of antibiotic administration, enteral/parenteral nutrition strategies, and intestinal drug therapy, thereby eliminating the confounding effects of these clinical interventions on the correlation results. Spearman’s partial rank correlation analysis was used to evaluate the correlation between microbial relative abundance and clinical indicators. Potential clinical confounding variables such as age, sex, type of antibiotic use, and nutritional support method were strictly controlled to exclude interference from confounding factors in the correlation results. A P value below 0.05 indicated statistical significance.
The sample size of this study was determined based on the expected between group difference in gut microbiota alpha diversity. The anticipated effect size for the Shannon index was 0.8, with a significance level (α) of 0.05 and a power (1−β) of 0.8. The calculation indicated that at least 40 patients in the case group and 25 in the control group were required. This study enrolled 45 cases and 30 controls, thereby meeting the minimum statistical power requirement.
Distribution of confounders
Table I summarizes the distribution of antibiotic, enteral nutrition, parenteral nutrition, laxative, and intestinal mucosal protective agent use between the case group and the control group. In the control group, no antibiotics, probiotics, or intestinal regulatory agents were used within 4 weeks prior to enrollment, with the usage rate for all these agents being 0%. In the case group, within 72 hours of intensive care unit (ICU) admission, the usage rate was 100.0% (45/45) for antibiotics, 62.2% (28/45) for enteral nutrition, 37.8% (17/45) for parenteral nutrition, 28.9% (13/45) for laxatives, and 33.3% (15/45) for intestinal mucosal protective agents.
Table I
Distribution of intervention-related drugs and nutritional support in each group.
| Intervention project | Case group AG (n = 45) | Control group BG (n = 30) |
|---|---|---|
| Antibiotic use within 72 hours of admission | 45(100.0%) | 0(0.0%) |
| Enteral nutrition support | 28(62.2%) | 0(0.0%) |
| Parenteral nutrition support | 17(37.8%) | 0(0.0%) |
| Use of laxatives | 13(28.9%) | 0(0.0%) |
| Use of intestinal mucosal protectants | 15(33.3%) | 0(0.0%) |
Results
Basic information
45 SA-AKI patients (AG) and 30 healthy individuals (BG) were included in this study. The mean age of the AG was 62.5±10.8 years, and that of the BG was 59.8±9.5 years. There was no statistical difference in age distribution (t = 1.124, P = 0.264). Regarding sex composition, the AG comprised 28 men (62.2%) and 17 women (37.8%), while the BG comprised 18 men (60.0%) and 12 women (40.0%). No substantial distinction in sex proportion was noted (χ2 = 0.047, P = 0.828) (Table II).
Table II
Comparison of baseline clinical data.
| Item | AG (n = 45) | BG (n = 30) | Statistics | P |
|---|---|---|---|---|
| Age (years) | 62.5±10.8 | 59.8±9.5 | t = 1.124 | 0.264 |
| Sex (male/female) | 28 (62.2)/17 (37.8) | 18 (60.0)/12 (40.0) | χ2 = 0.047 | 0.828 |
| APACHE II score (points) | 21 (18,25) | - | - | - |
| SOFA score (points) | 9 (7,12) | - | - | - |
| SCr (μmol/l) | 285.4 (198.2,376.5) | 75.1 (66.3,84.0) | Z = −7.215 | <0.001 |
| BUN (mmol/l) | 22.6 (16.8,30.1) | 5.4 (4.5,6.3) | Z = −7.232 | <0.001 |
| CRP (mg/l) | 128.3 (95.7,160.4) | <5 | Z = −7.241 | <0.001 |
| IL-6 (pg/ml) | 215.6 (150.8,302.7) | <10 | Z = −7.228 | <0.001 |
Clinical indicators and laboratory test results showed that the median APACHE II score of the AG was 21 (18, 25), and the median SOFA score was 9 (7, 12), indicating moderate to severe organ dysfunction. The median serum creatinine (SCr) level was 285.4 (198.2, 376.5) μmol/l, and the median blood urea nitrogen (BUN) level was 22.6 (16.8, 30.1) mmol/l, both significantly higher than those of the BG [SCr 75.1 (66.3, 84.0) μmol/l, BUN 5.4 (4.5, 6.3) mmol/l], reflecting severe renal impairment. In terms of inflammatory markers, the median C-reactive protein (CRP) level was 128.3 (95.7, 160.4) mg/l, and the median interleukin-6 (IL-6) level was 215.6 (150.8, 302.7) pg/ml in the AG, while these indicators were normal in the BG (CRP <5 mg/l, IL-6 <10 pg/ml), indicating a significant systemic inflammatory response in SA-AKI patients.
GM diversity in SA-AKI patients
Compared with the BG group, patients in the AG group showed significantly lower Shannon index (Fig. 1) and Chao1 index (Fig. 2) in fecal samples (all P<0.01), indicating severely impaired gut microbiota diversity and richness. Principal coordinate analysis (PCoA) based on BrayCurtis distance revealed that AG and BG samples formed distinct clusters in two dimensional space with almost no overlap (Fig. 3). PERMANOVA further confirmed a significant difference in microbiota structure between the two groups (AG vs. BG, R2 = 0.35, P<0.01).
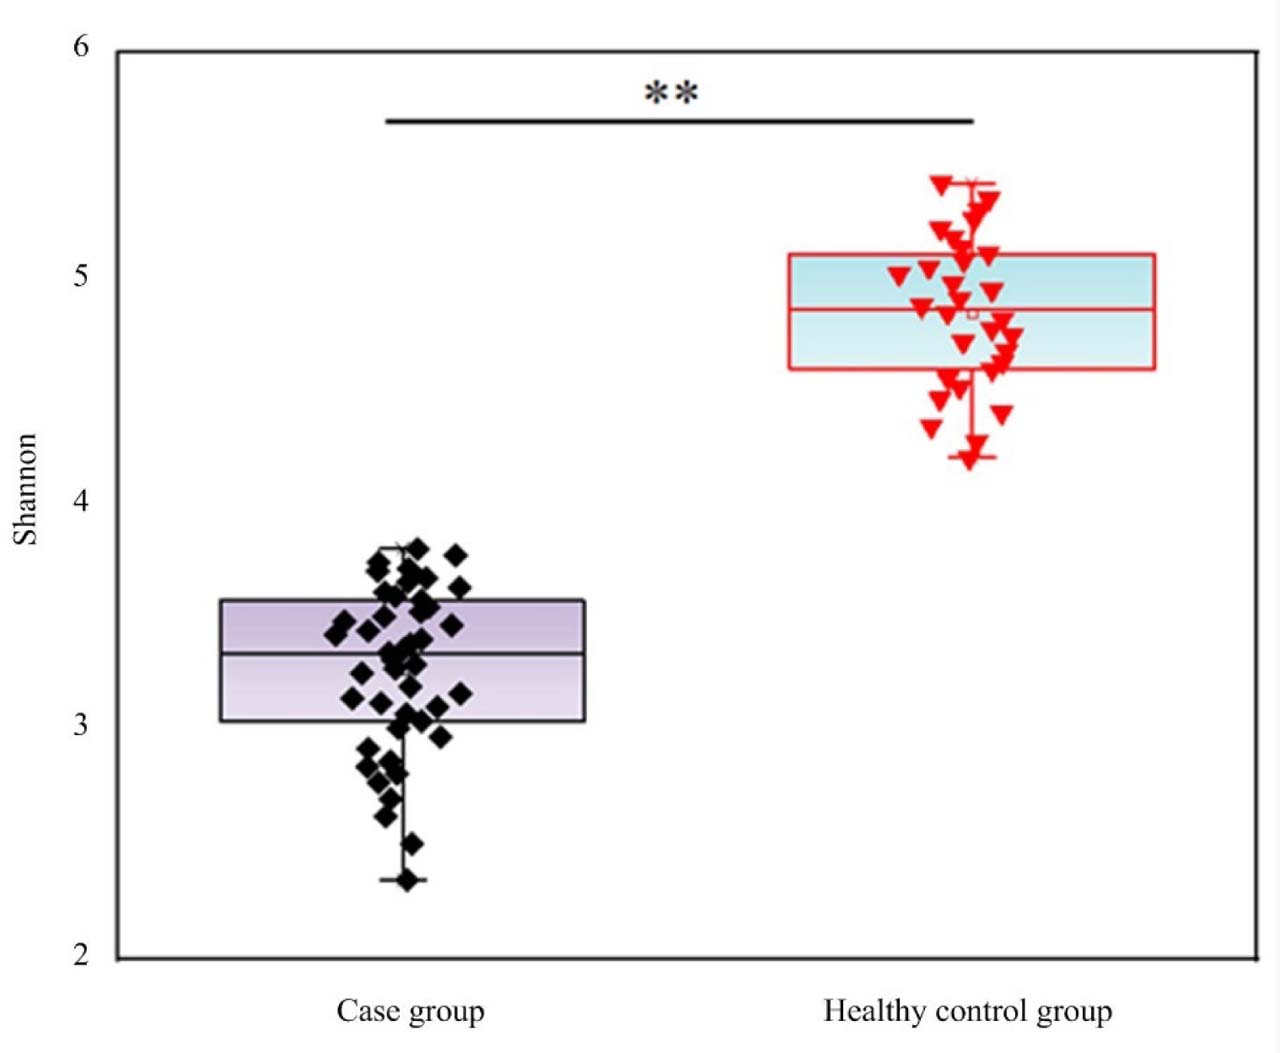
Fig. 1.
Shannon index of GM diversity in SA-AKI patients and healthy controls. Compared with the control group, the Shannon index of the case group, ** P <0.01
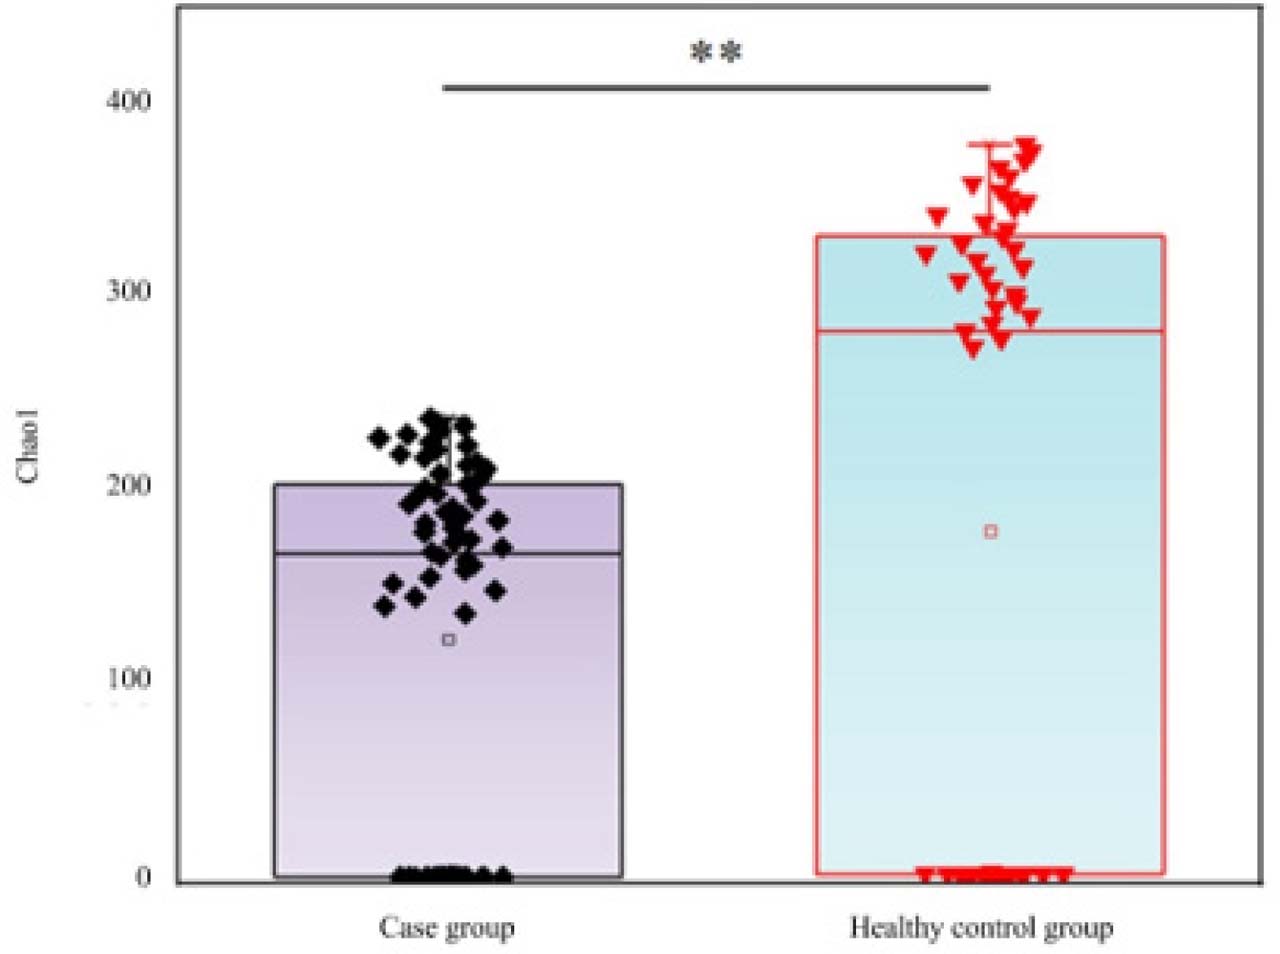
Fig. 2.
Chao1 index of GM diversity in SA-AKI patients and healthy controls. Compared with the control group, the Chao1 index in the case group, ** P <0.01
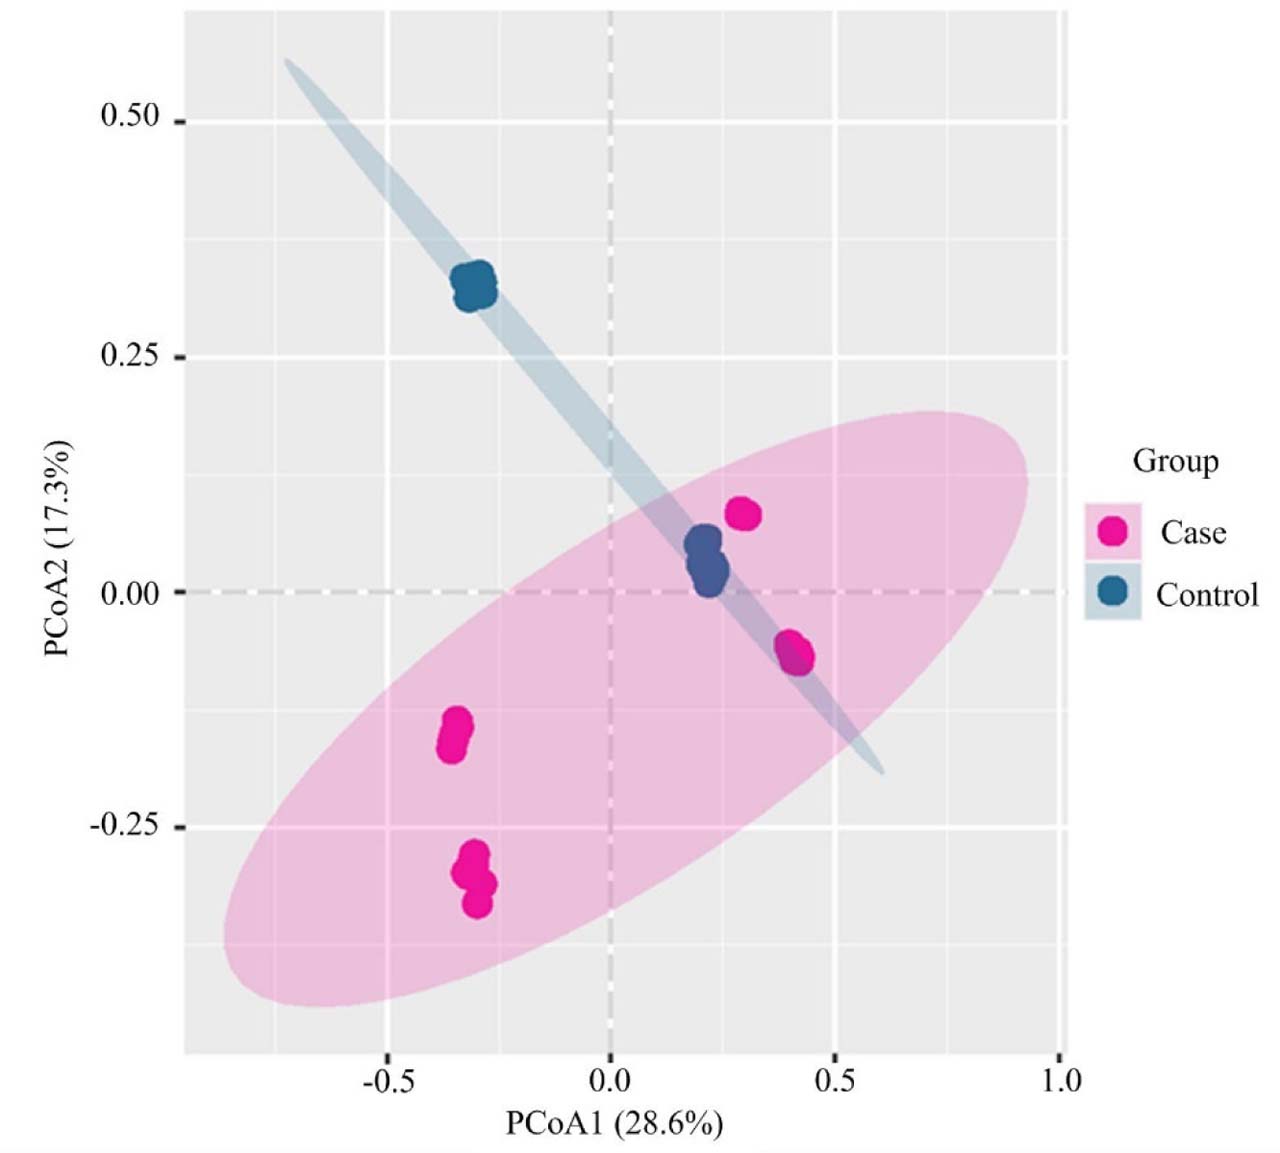
Fig. 3.
PCoA analysis based on Bray-Curtis distance. The high concentration of the control group is due to the homogenization of microbiota in healthy individuals
GM composition in SA-AKI patients
At the phylum level, compared with the BG group, the AG group exhibited a significantly higher relative abundance of Proteobacteria, while the abundances of Firmicutes and Bacteroidetes were significantly lower (Table III) (35.2% vs. 4.1%, P<0.001; 40.1% vs. 65.8%, P<0.001; 18.5% vs. 24.3%, P<0.05, respectively). At the genus level, the abundances of potential pathogenic bacteria such as Enterococcus, Klebsiella, Escherichia/Shigella, and Staphylococcus were significantly increased in the AG group, whereas butyrate-producing beneficial bacteria enriched in the BG group, including Faecalibacterium, Roseburia, Blautia, and Bifidobacterium, were significantly reduced in the AG group (Fig. 4). LEfSe analysis clearly identified differential signature microbiota between the two groups (LDA threshold = 2.0, P<0.05) (Fig. 5) and displayed their taxonomic status (Fig. 6).
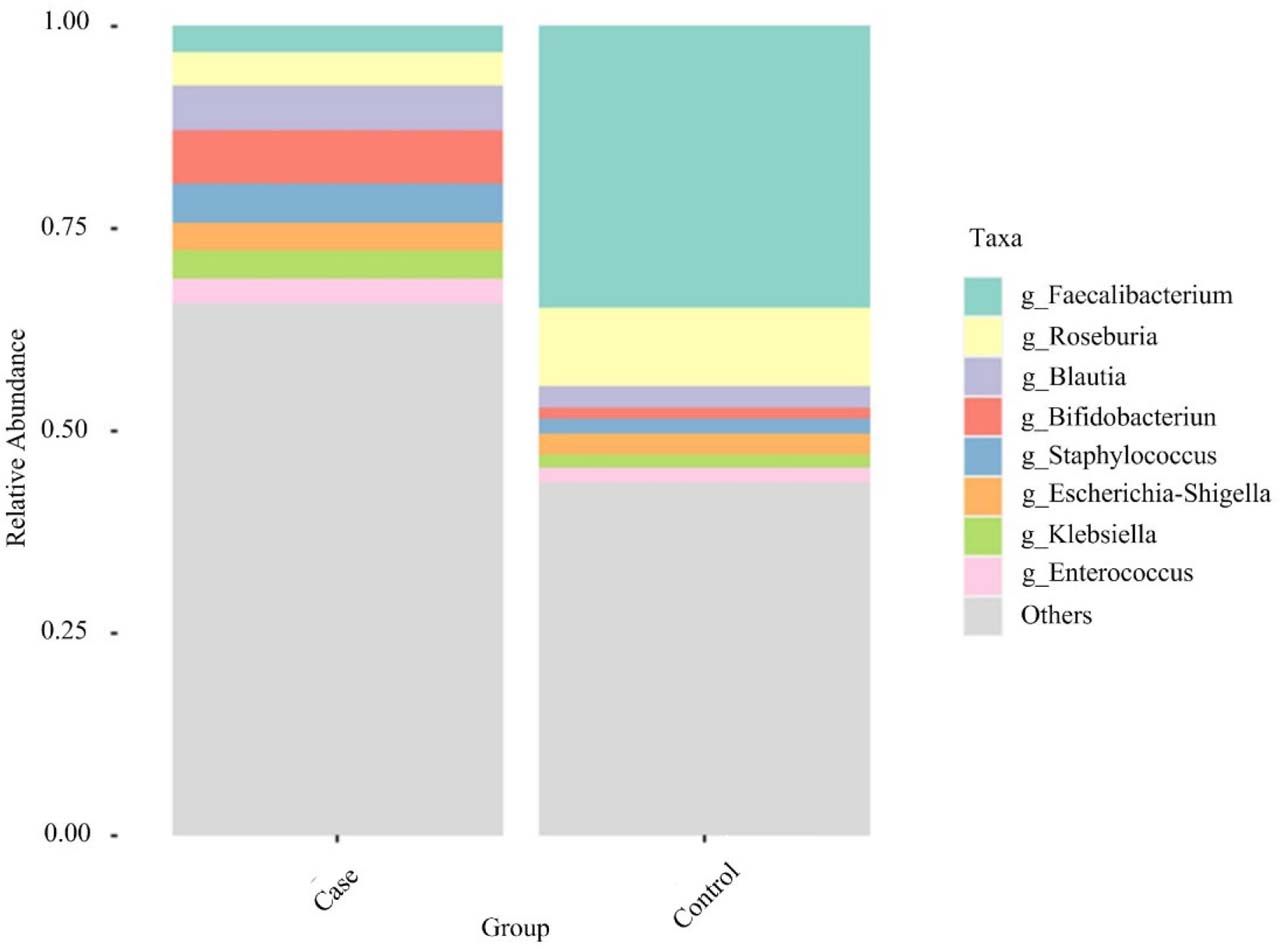
Fig. 4.
Stacked bar charts of RA of GM at genus level.
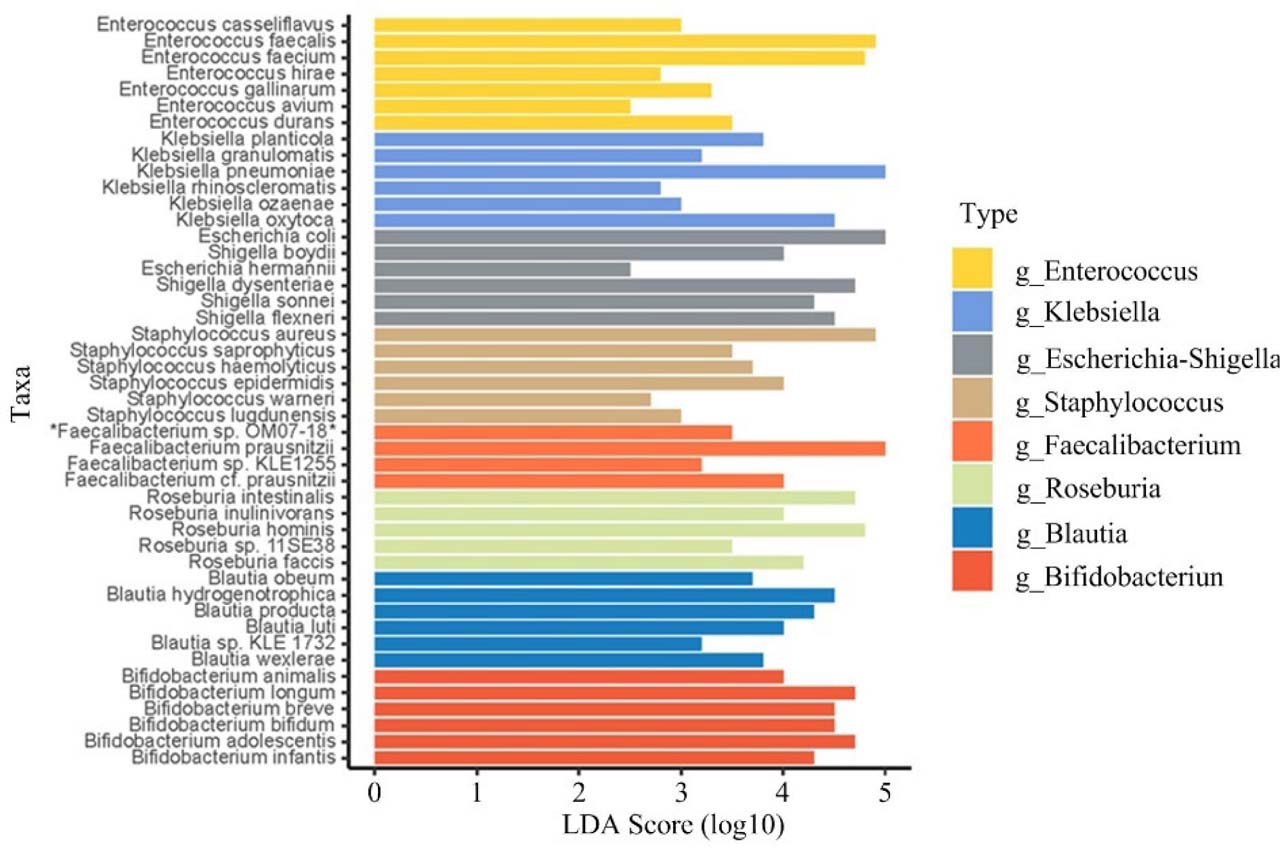
Fig. 5.
LEfSe analysis of signature microbiota with significant abundance differences.
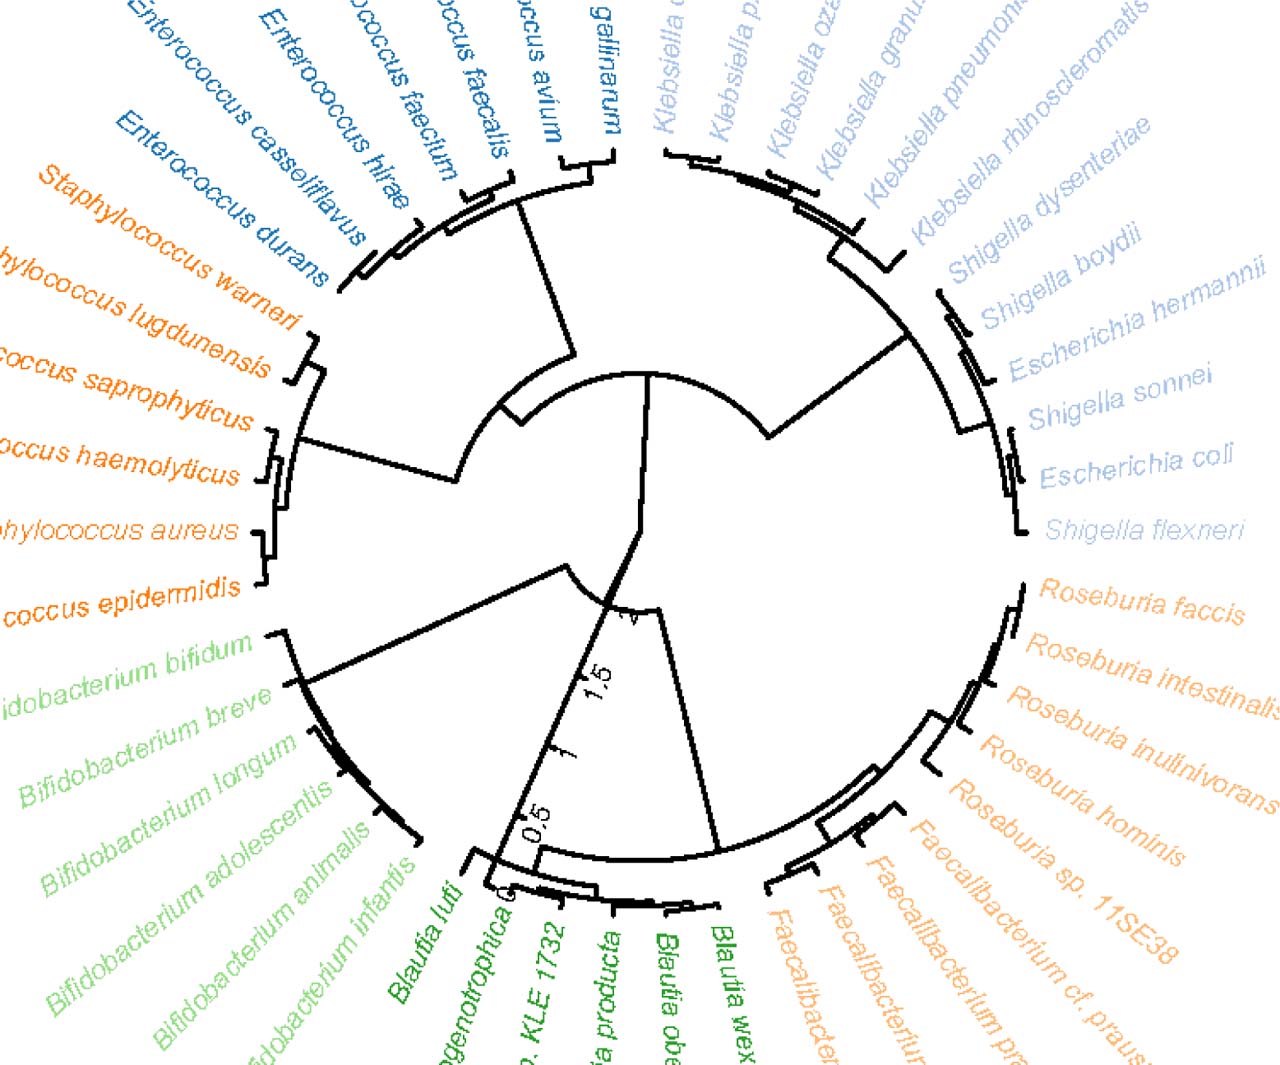
Fig. 6.
Cladogram from LEfSe analysis.
Correlation between GM and clinical indicators
Spearman correlation analysis (SCA) revealed significant correlations between the relative abundances of specific gut microbiota genera and clinical parameters in patients with SA-AKI (Fig. 7). Positive correlations: Enterococcus relative abundance with SOFA score (r = 0.58, P<0.001) and SCr (r = 0.45, P<0.01); Klebsiella abundance with CRP (r = 0.41, P<0.05). Negative correlations: F. prausnitzii relative abundance with IL-6 (r = −0.52, P<0.001); Roseburia abundance with APACHE II score (r = −0.38, P<0.05). The abundances of Blautia and Bifidobacterium showed negative correlations with inflammatory markers (CRP, IL-6) (all P>0.05).
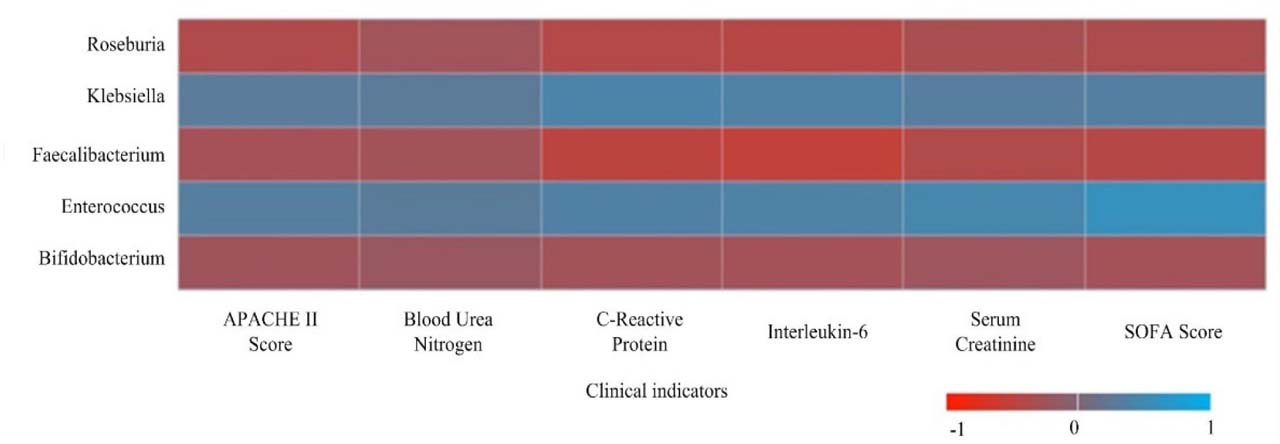
Fig. 7.
Heatmap of correlation between key genus abundance and clinical indicators in SA-AKI patients.
Concurrent analysis of the correlations between core differential bacterial genera and novel kidney injury biomarkers (NGAL, CysC, KIM-1, suPAR) revealed that Enterococcus abundance was positively correlated with NGAL (r = 0.42, P < 0.01) and suPAR (r = 0.39, P < 0.01); conversely, F. prausnitzii abundance showed significant negative correlations with CysC (r = −0.46, P < 0.001) and KIM-1 (r = −0.41, P < 0.01), as shown in Fig. 8.
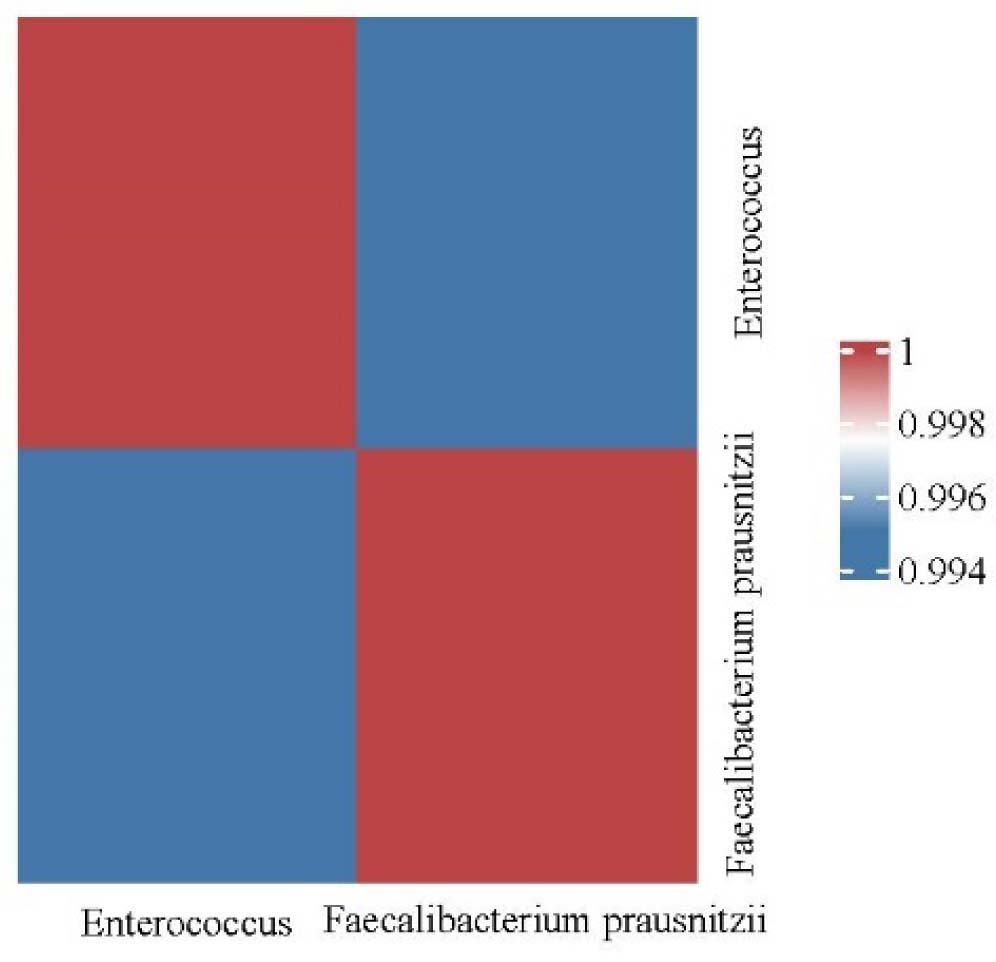
Fig. 8.
Correlation heatmap between key differential bacterial genera and novel renal injury markers.
Discussion
In this study, 16S rRNA gene sequencing revealed severe gut microbiota dysbiosis in patients with SAAKI, characterized by reduced diversity, altered structure, and significant correlations between specific microbiota and clinical parameters. First, the AG group showed significantly decreased Shannon and Chao1 indices, intuitively reflecting a collapse of gut microecological stability. Reduced diversity suggests diminished microbial resilience and resistance, which may weaken colonization resistance against pathogens and create conditions for the overgrowth of opportunistic pathogens. Second, the clear separation of samples between the two groups, supported by PERMANOVA (R2 = 0.35, P = 0.001), confirmed that SAAKI patients exhibit a microbiota structure distinctly different from that of healthy individuals (Tian et al. 2025; Noel et al. 2025; Mali et al. 2025). This global structural alteration suggests a deep association with the disease’s pathophysiological process. In terms of specific microbiota composition, the data demonstrate a clear pattern of imbalance. At the phylum level, SAAKI patients exhibited abnormal expansion of Proteobacteria (35.2% vs. 4.1%) and a marked reduction in Firmicutes (40.1% vs. 65.8%) (Luther et al. 2023; Huai and Ye 2025). The former is a major phylum containing many Gramnegative pathogenic bacteria, and its enrichment is directly associated with a potential increase in lipopolysaccharide (LPS) load (Wang et al. 2024; Tanoue et al. 2025); the latter reduction suggests an overall loss of beneficial shortchain fatty acid producing bacteria, collectively disrupting intestinal immune homeostasis and barrier function (Liu et al. 2024). At the genus level, the findings were further clarified: opportunistic pathogens such as Enterococcus and Klebsiella proliferated in the case group (Sun et al. 2025), presenting a sharp contrast to the abundance of butyrate producing bacteria, including Faecalibacterium and Roseburia, in the healthy control group (CorteIglesias et al. 2024). Crucially, SCA provided statistical support for this microbiota host interaction: Enterococcus relative abundance was significantly positively correlated with SOFA score and SCr, suggesting that its overgrowth is associated with organ dysfunction and the severity of kidney injury (Tyc et al. 2025); the mechanism may involve bacterial translocation and exacerbated systemic inflammation. As an important butyrate producing bacterium, the reduction of F. prausnitzii may lead to diminished intestinal anti-inflammatory signaling and impaired barrier integrity (Wang et al. 2025; Ou et al. 2024), failing to effectively contain the spread of systemic inflammation and thereby contributing to the progression of SAAKI.
This study observed a vicious cycle associated with gut microbiota dysbiosis in SAAKI: disease- and treatment-related stress may be associated with decreased microbial diversity and disrupted community structure, accompanied by the proliferation of opportunistic pathogens such as Enterococcus and Klebsiella, and a decrease in the abundance of beneficial bacteria such as F. prausnitzii and Roseburia. The former are positively correlated with disease severity, whereas the latter are negatively correlated with inflammatory levels. These microbiota alterations coexist with the disease course and may contribute to disease progression. Future research could focus on supplementing beneficial bacteria such as F. prausnitzii and metabolites like butyrate, as well as inhibiting pathogenic bacteria such as Enterococcus, thereby providing potential research directions for targeted microbiota interventions in SAAKI. However, the present study lacks relevant functional experimental validation, which is a limitation of this article.
The limitations of this study include the following aspects. First, the control group design is flawed, as only healthy controls were included, without patients with sepsis alone without acute kidney injury (AKI), nonseptic AKI, or severity matched patients without AKI in the same intensive care unit (ICU). Therefore, the observed differences in the gut microbiota may reflect the critical illness state in the ICU rather than being entirely specific to sepsis associated AKI (SAAKI). Second, although the total sample size of 75 met the requirements for alpha diversity comparisons based on power calculation, the statistical power remains limited when conducting correlation analyses involving multiple genera and multiple parameters, making false positive or false negative results possible. Third, this study was a single center, single time point investigation conducted in two hospitals in Zhangjiakou, Hebei Province, China, which introduces limitations concerning geographical region, diet, ethnicity, and hospital acquired microbiota, thereby restricting the generalizability of the findings. Moreover, only a single sample at enrollment was collected, precluding the assessment of dynamic changes in the microbiota. Fourth, this study relied solely on 16S rRNA sequencing for species classification analysis, without performing metagenomic or metabolomic testing. Changes in key functional metabolites such as endotoxin and butyrate, lack direct experimental data support, and the relevant mechanisms discussed in this paper are only reasonable inferences based on existing literature. Fifth, this study did not set up an independent external validation cohort. All correlation analysis data originated from our own study population, without external sample validation; therefore, the obtained correlation coefficients may be overestimated. Sixth, confounding factors are difficult to completely avoid. Antibiotic exposure is one of the most important factors affecting gut microbiota in ICU patients. Although this study used partial correlation analysis to adjust for confounding variables such as antibiotics and nutritional regimens, it still cannot eliminate the potential confounding interference of antibiotics on gut microbiota structure. Furthermore, the control group in this study only included healthy individuals, without subjects with sepsis without AKI, nonsepsis induced AKI, or ICU patients with matched disease severity but without AKI. Thus, it is difficult to distinguish whether the differences in gut microbiota between groups originate from SAAKI itself or from the critical illness state in the ICU, which is a key flaw in the study design. Additionally, the total sample size of this study was 75 cases (45 cases, 30 controls), which is limited. The statistical power for analyzing associations between multiple genera and multiple clinical indicators is insufficient, leading to potential false positive or false negative results. Moreover, the study was conducted only in two medical institutions in Zhangjiakou, Hebei Province, with samples collected at a single time point. The findings are constrained by regional dietary habits, population characteristics, hospital acquired microbiota, and other factors; therefore, the generalizability of the conclusions to other populations is limited. Finally, this study had a retrospective design, with data derived from medical records and a biobank, which introduces information bias and precludes the establishment of causal relationships.
Conclusion
This study investigated the structural characteristics of gut microbiota in patients with sepsis-associated acute kidney injury (SAAKI) and their associations with clinical indicators. The results showed that patients with SAAKI exhibited significant gut microbiota dysbiosis, characterized by decreased microbial diversity, enrichment of opportunistic pathogens, and reduced abundance of beneficial commensal bacteria. These alterations in microbiota structure were correlated with disease severity and inflammatory levels in the patients. Due to limitations such as retrospective study design, limited sample size, and lack of functional validation of the microbiota, the current data are insufficient to support the direct use of the identified microbiota as clinical diagnostic biomarkers or therapeutic targets. This study can only provide a basic reference for future research in this field. The clinical translational value of microbiota indicators remains to be further validated by multicenter, prospective studies incorporating metagenomic and metabolomic analyses.