
Table I
Primers used to detect Entamoeba species (Khairnar and Parija, 2007).
| Target name | Primer name | Product size | Primer sequence |
|---|---|---|---|
| Entamoeba | Forward | 898 bp | 5′ TAAGATGCACGAGAGCGAAA 3′ |
| Reverse | 5′ GTACAAAGGGCAGGGACGTA 3′ | ||
| E. dispar | Forward | 174 bp | 5′TCTAATTTCGATTAGAACTCT 3′ |
| Reversed | 5′ TCCCTACCTATTAGACATAGC 3′ | ||
| E. moshkovskii | Forward | 553 bp | 5′ GAAACC AAGAGTTTCACAAC 3′ |
| Reverse | 5′ CAATATAAGGC TTGGATGAT 3′ |
Table II
Frequency and percentage of Entamoeba species infection among symptomatic children.
| Microscopy Results for Entamoeba species | Frequency | Percentage |
|---|---|---|
| Negative | 267 | 82.7 |
| Positive | 56 | 17.3 |
| PCR Results for E. dispar | ||
| Negative | 281 | 87.0 |
| Positive | 42 | 13.0 |
| Total | 323 | 100 |
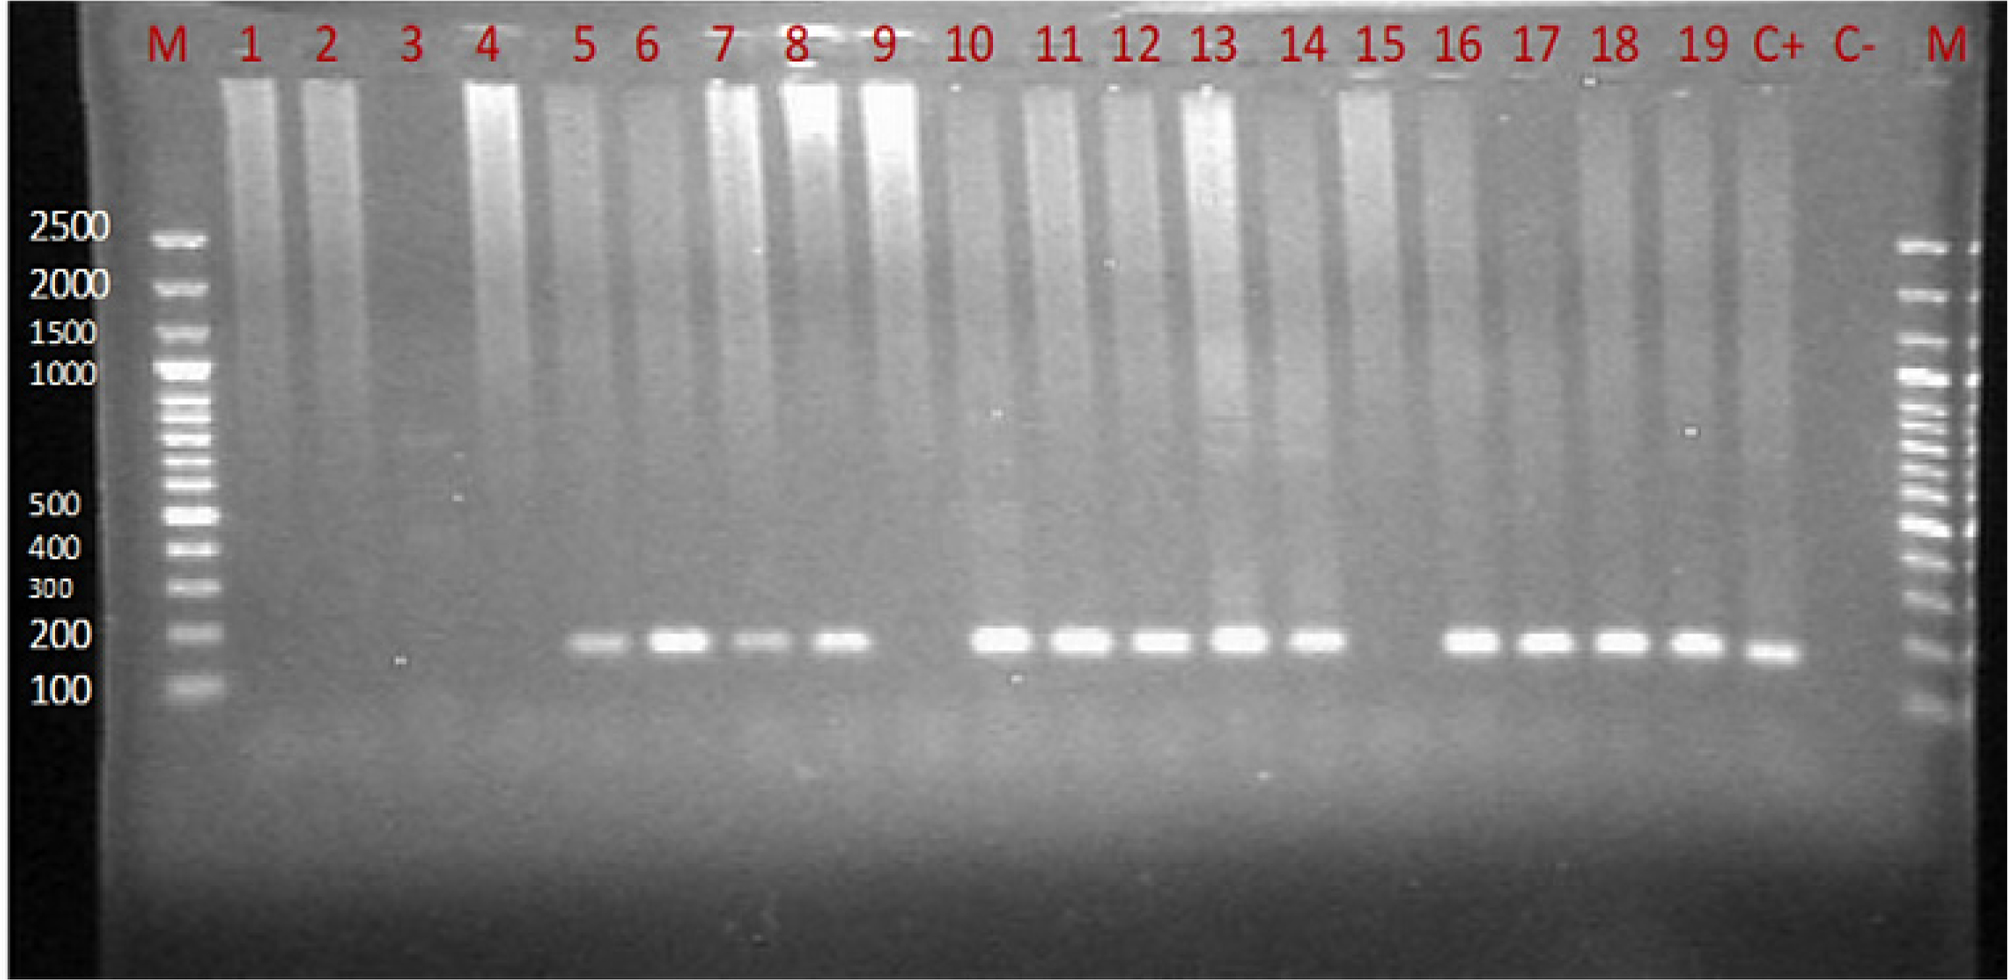
Fig. 1.
Gel electrophoresis under UV light using an agarose gel (2%) stained with 0.2 mg/ml of GelRed for analysis of the nested PCR product. Lanes (1–4, 9, and 15) are negative, lanes (5–8, 10–14, and 16–19) are 174 bp product representing positive samples using primers specific to amplify Entamoeba dispar. C+: Positive control, C-: Negative control, and M: 100 bp DNA marker.
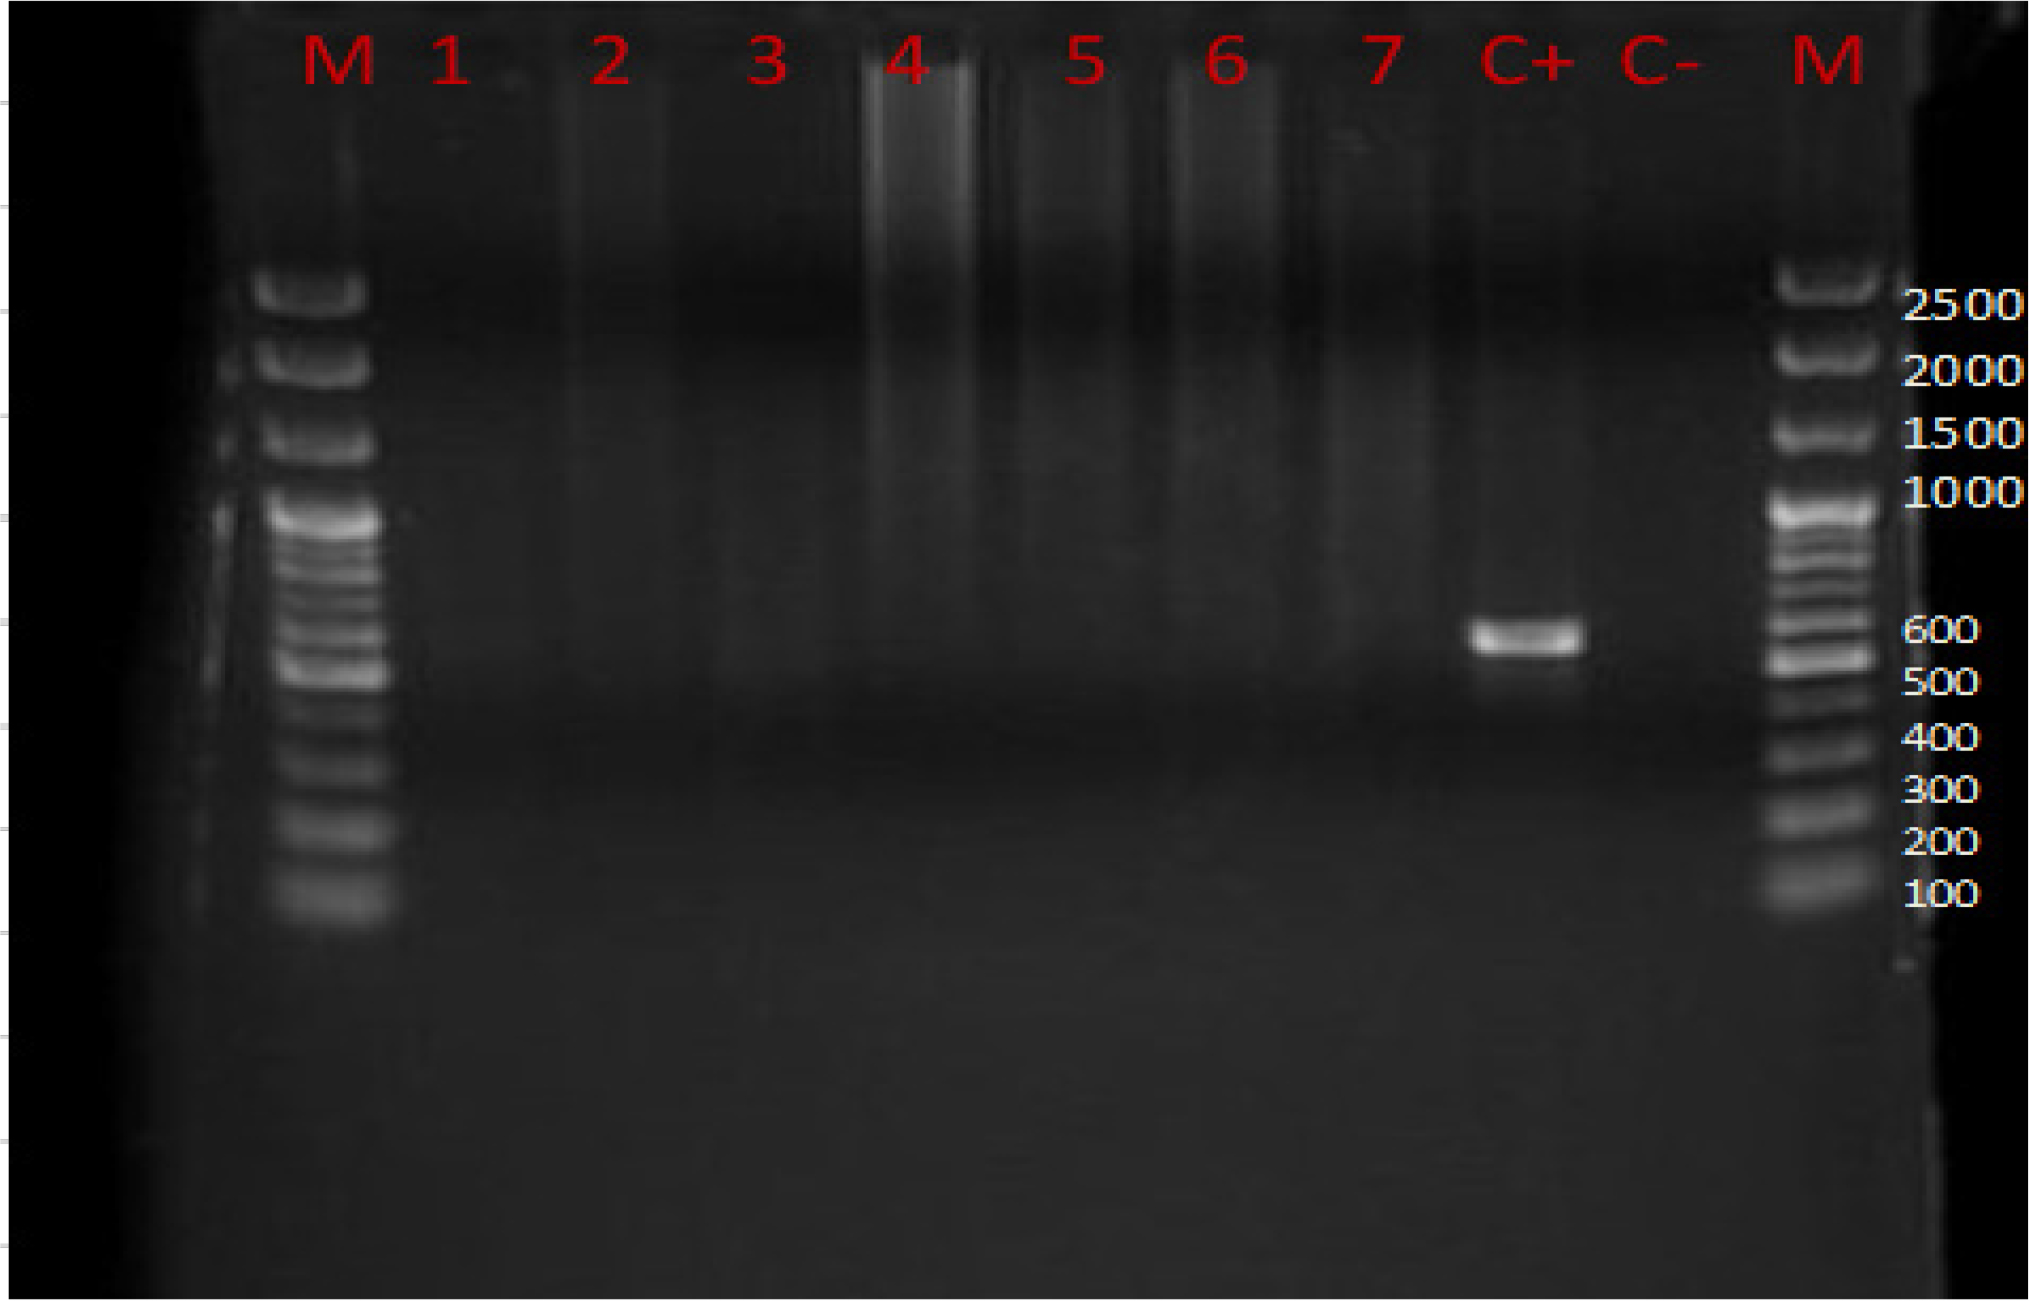
Fig. 2.
Gel electrophoresis under UV light using agarose gel (1%) stained with 0.2 mg/ml of GelRed for analysis of nested PCR product. Lanes (1–7) are negative, C+: Positive control revealed 550 bp product using primers specific to amplify Entamoeba moskovskii, C-: Negative control, and M: 100 bp DNA marker.
Table III
Sociodemographic factors of positive results by molecular examination for E. dispar.
| Parameters | Negative | Positive | p-value | |
|---|---|---|---|---|
| Frequency (percentages) | ||||
| Gender | Male | 162 (90.5) | 17 (9.5) | 0.037* |
| Female | 119 (82.6) | 25 (17.4) | ||
| Residence | Rural | 134 (82.7) | 28 (17.3) | 0.022* |
| Urban | 147 (91.3) | 14 (8.7) | ||
| Tape water or untreated water | Yes | 135 (81.8) | 30 (18.2) | 0.005* |
| No | 146 (92.4) | 12 (7.6) | ||
| Age group (Years) | <1 | 3 (100) | 0 (0.0) | 0.000* |
| 1–4 | 139 (82.7) | 29 (17.3) | ||
| 5–8 | 129 (96.3) | 5 (3.7) | ||
| ≥9 | 10 (55.6) | 8 (44.4) | ||