
Table I
Demographic and clinical characteristics of Pseudomonas aeruginosa isolates.
| Isolate ID | Age (years) | Gender | Source of isolate | Genome ID |
|---|---|---|---|---|
| 11A | 45 | M | wound swab | 287.4547 |
| 19 | 60 | F | urine | 2994495.16 |
| 23 | 34 | M | sputum | 287.45476 |
| 26 | 50 | F | wound swab | 287.45471 |
| 29 | 28 | M | blood | 287.45464 |
| 2A | 40 | F | urine | 287.45472 |
| 32 | 55 | M | burn infection | 287.45473 |
| 37 | 63 | F | sputum | 287.45474 |
| 3A | 30 | M | urine | 287.45475 |
| 44 | 48 | F | wound swab | 287.45482 |
| 7A | 52 | M | blood | 287.45477 |
| 80 | 36 | F | burn infection | 287.45478 |
| 92 | 41 | M | wound swab | 287.45479 |
Table II
Whole-genome sequencing quality metrics for the 13 Pseudomonas aeruginosa isolates.
| Isolate ID | Total bases (Gb) | Estimated coverage (×) | % Bases ≥ Q30 | GC (%) | AT (%) |
|---|---|---|---|---|---|
| 11A | 2.2 | ~333× | 97.4 | 67.1 | 32.9 |
| 19 | 3.5 | ~530× | 96.4 | 67.5 | 32.5 |
| 23 | 2.7 | ~409× | 97.2 | 67.1 | 32.9 |
| 26 | 2.4 | ~364× | 97.4 | 66.7 | 33.3 |
| 29 | 2.9 | ~439× | 97.3 | 66.9 | 33.1 |
| 2A | 2.5 | ~379× | 97.2 | 67.3 | 32.7 |
| 32 | 2.0 | ~303× | 97.1 | 67.2 | 32.8 |
| 37 | 2.1 | ~318× | 97.2 | 66.8 | 33.2 |
| 3A | 2.4 | ~364× | 97.2 | 67.1 | 32.9 |
| 44 | 3.5 | ~530× | 96.6 | 67.1 | 32.9 |
| 7A | 2.6 | ~394× | 97.3 | 67.1 | 32.9 |
| 80 | 2.3 | ~348× | 96.9 | 67.0 | 33.0 |
| 92 | 2.3 | ~348× | 97.3 | 66.6 | 33.4 |
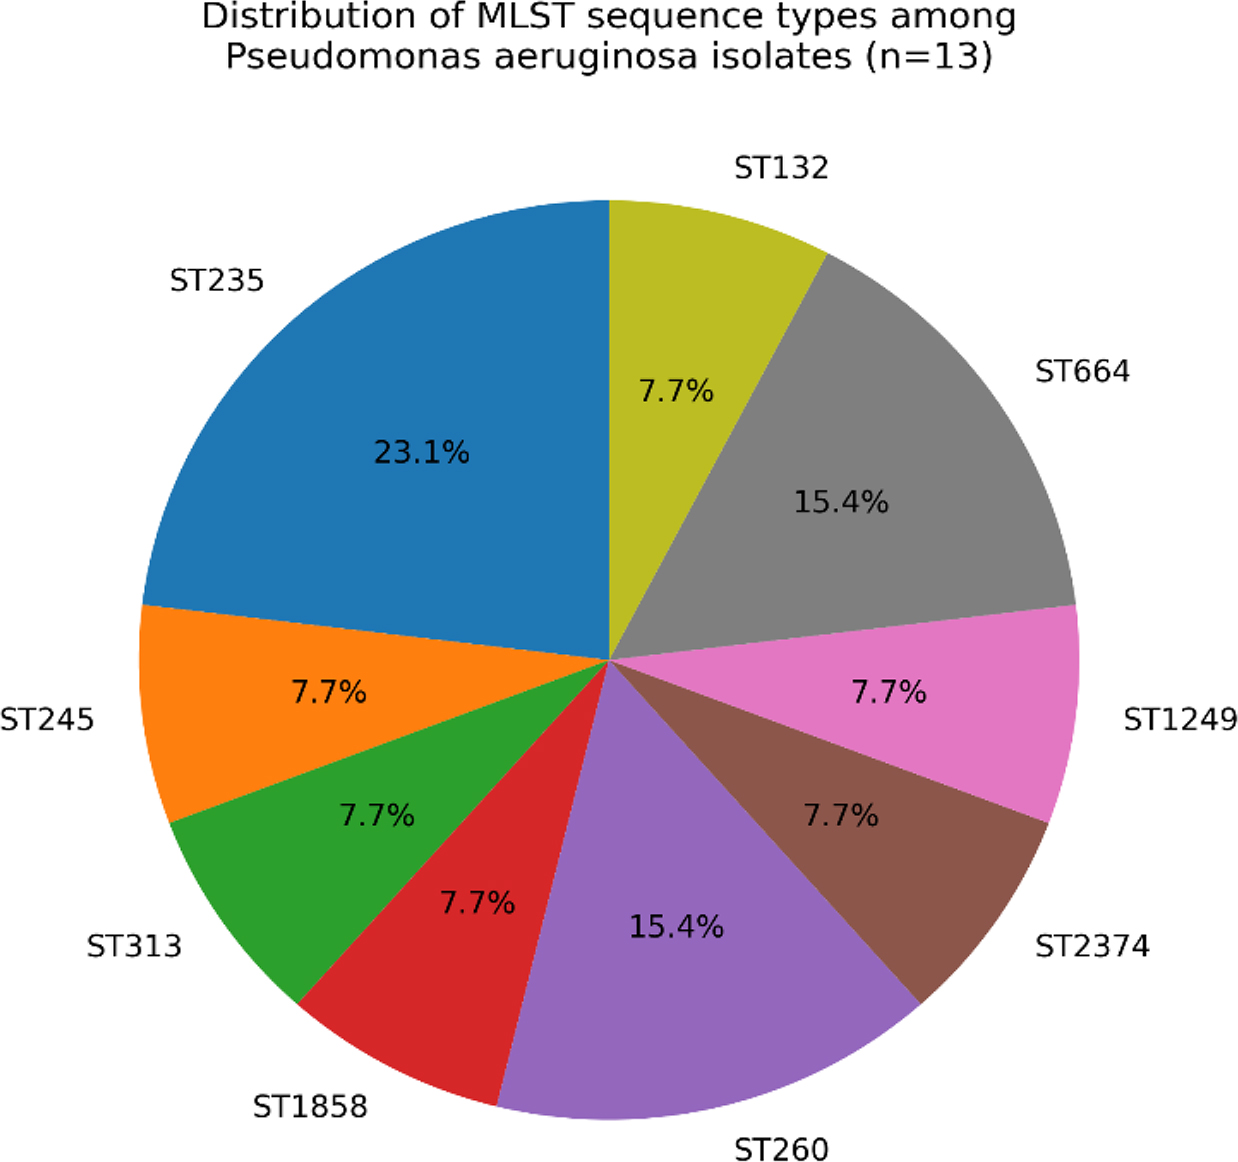
Fig. 1.
The distribution of MLST sequence types among Pseudomonas aeruginosa isolates (n=13).
Table III
In silico multilocus sequence typing (MLST) profiles of Pseudomonas aeruginosa isolates based on whole-genome sequencing.
| Isolate ID | Genome ID | acsA | AroE | guaA | mutL | nuoD | ppsA | trpE | ST |
|---|---|---|---|---|---|---|---|---|---|
| 11A | 287.4547 | 38 | 11 | 3 | 13 | 1 | 2 | 4 | 235 |
| 19 | 2994495.16 | 39 | 6 | 12 | 11 | 3 | 15 | 2 | 245 |
| 23 | 287.45476 | 47 | 8 | 7 | 6 | 8 | 11 | 40 | 313 |
| 26 | 287.45471 | 38 | 11 | 3 | 13 | 1 | 2 | 4 | 235 |
| 29 | 287.45464 | 17 | 2 | 11 | 3 | 81 | 38 | 3 | 1858 |
| 2A | 287.45472 | 14 | 5 | 10 | 7 | 4 | 13 | 7 | 260 |
| 32 | 287.45473 | 17 | 5 | 26 | 3 | 4 | 4 | 7 | 2374 |
| 37 | 287.45474 | 23 | 13 | 109 | 5 | 1 | 1 | 47 | 1249 |
| 3A | 287.45475 | 14 | 5 | 10 | 7 | 4 | 13 | 7 | 260 |
| 44 | 287.45482 | 9 | 5 | 11 | 3 | 4 | 40 | 18 | 664 |
| 7A | 287.45477 | 6 | 20 | 1 | 3 | 4 | 4 | 2 | 132 |
| 80 | 287.45478 | 38 | 11 | 3 | 13 | 1 | 2 | 4 | 235 |
| 92 | 287.45479 | 9 | 5 | 11 | 3 | 4 | 40 | 18 | 664 |
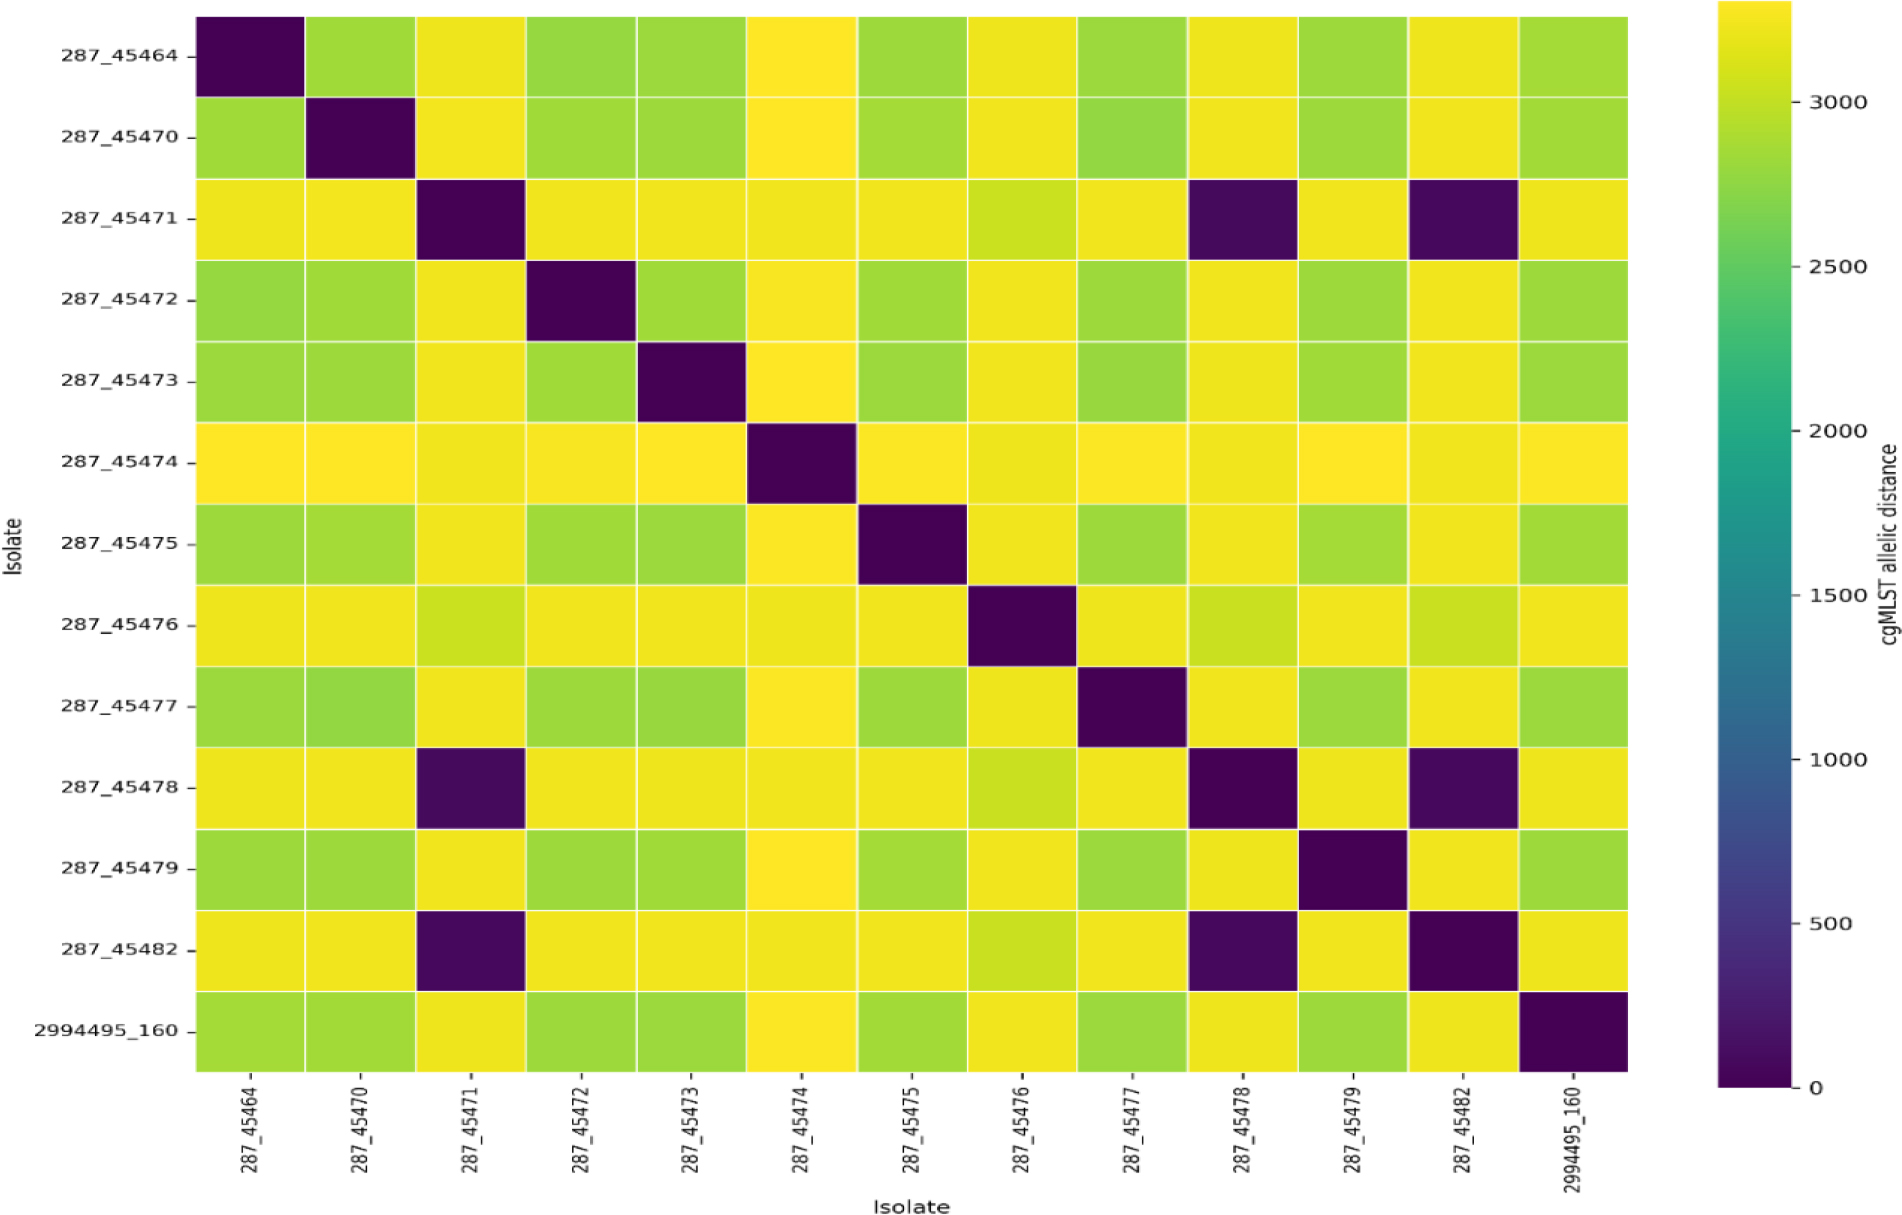
Fig. 2.
cgMLST allelic distances heatmap of the 13 clinical Pseudomonas aeruginosa isolates pairwise. Rows and columns (each cell) represent individual isolates, and the colors indicate the number of allelic differences across the core genome. Darker colors correspond to lower allelic distances (higher genetic similarity), whereas lighter colors indicate greater allelic distances (higher genetic divergence). The diagonal of the heatmap represents self-comparisons with zero allelic differences.
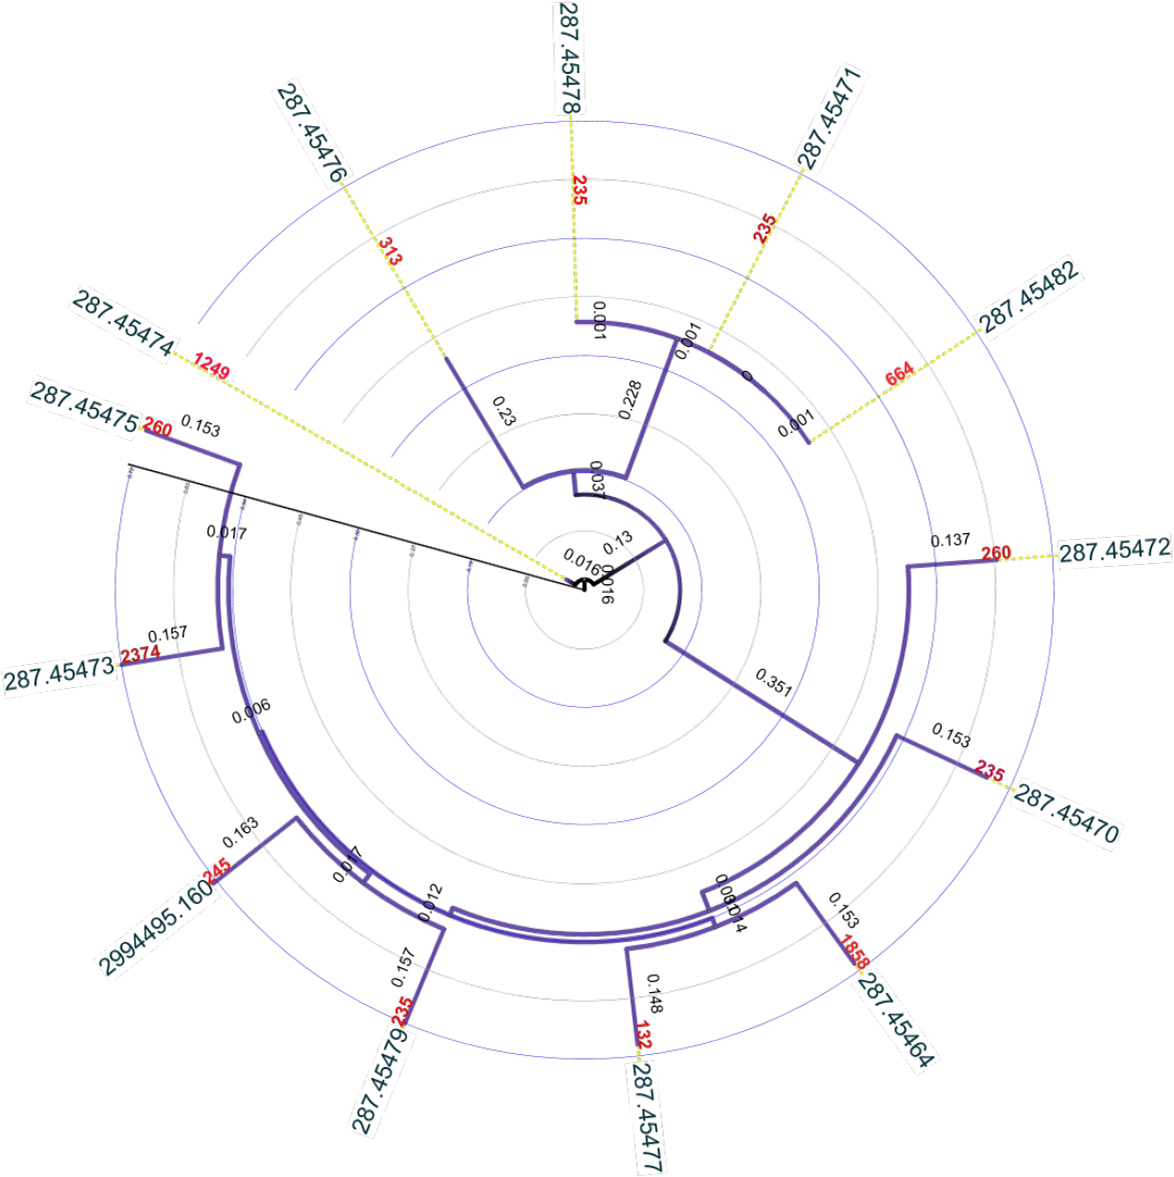
Fig. 3.
Core-genome SNP-based phylogenetic analysis of clinical Pseudomonas aeruginosa isolates. Maximum-likelihood phylogenetic tree inferred from core-genome single-nucleotide polymorphisms (SNPs) among 13 clinical Pseudomonas aeruginosa isolates. The tree was visualized using the Interactive Tree of Life (iTOL). Tip labels indicate genome ID, and corresponding MLST sequence types (STs). Branch lengths correspond to nucleotide substitutions per site. The phylogeny reveals substantial genetic diversity supporting the presence of multiple, genetically distinct lineages.
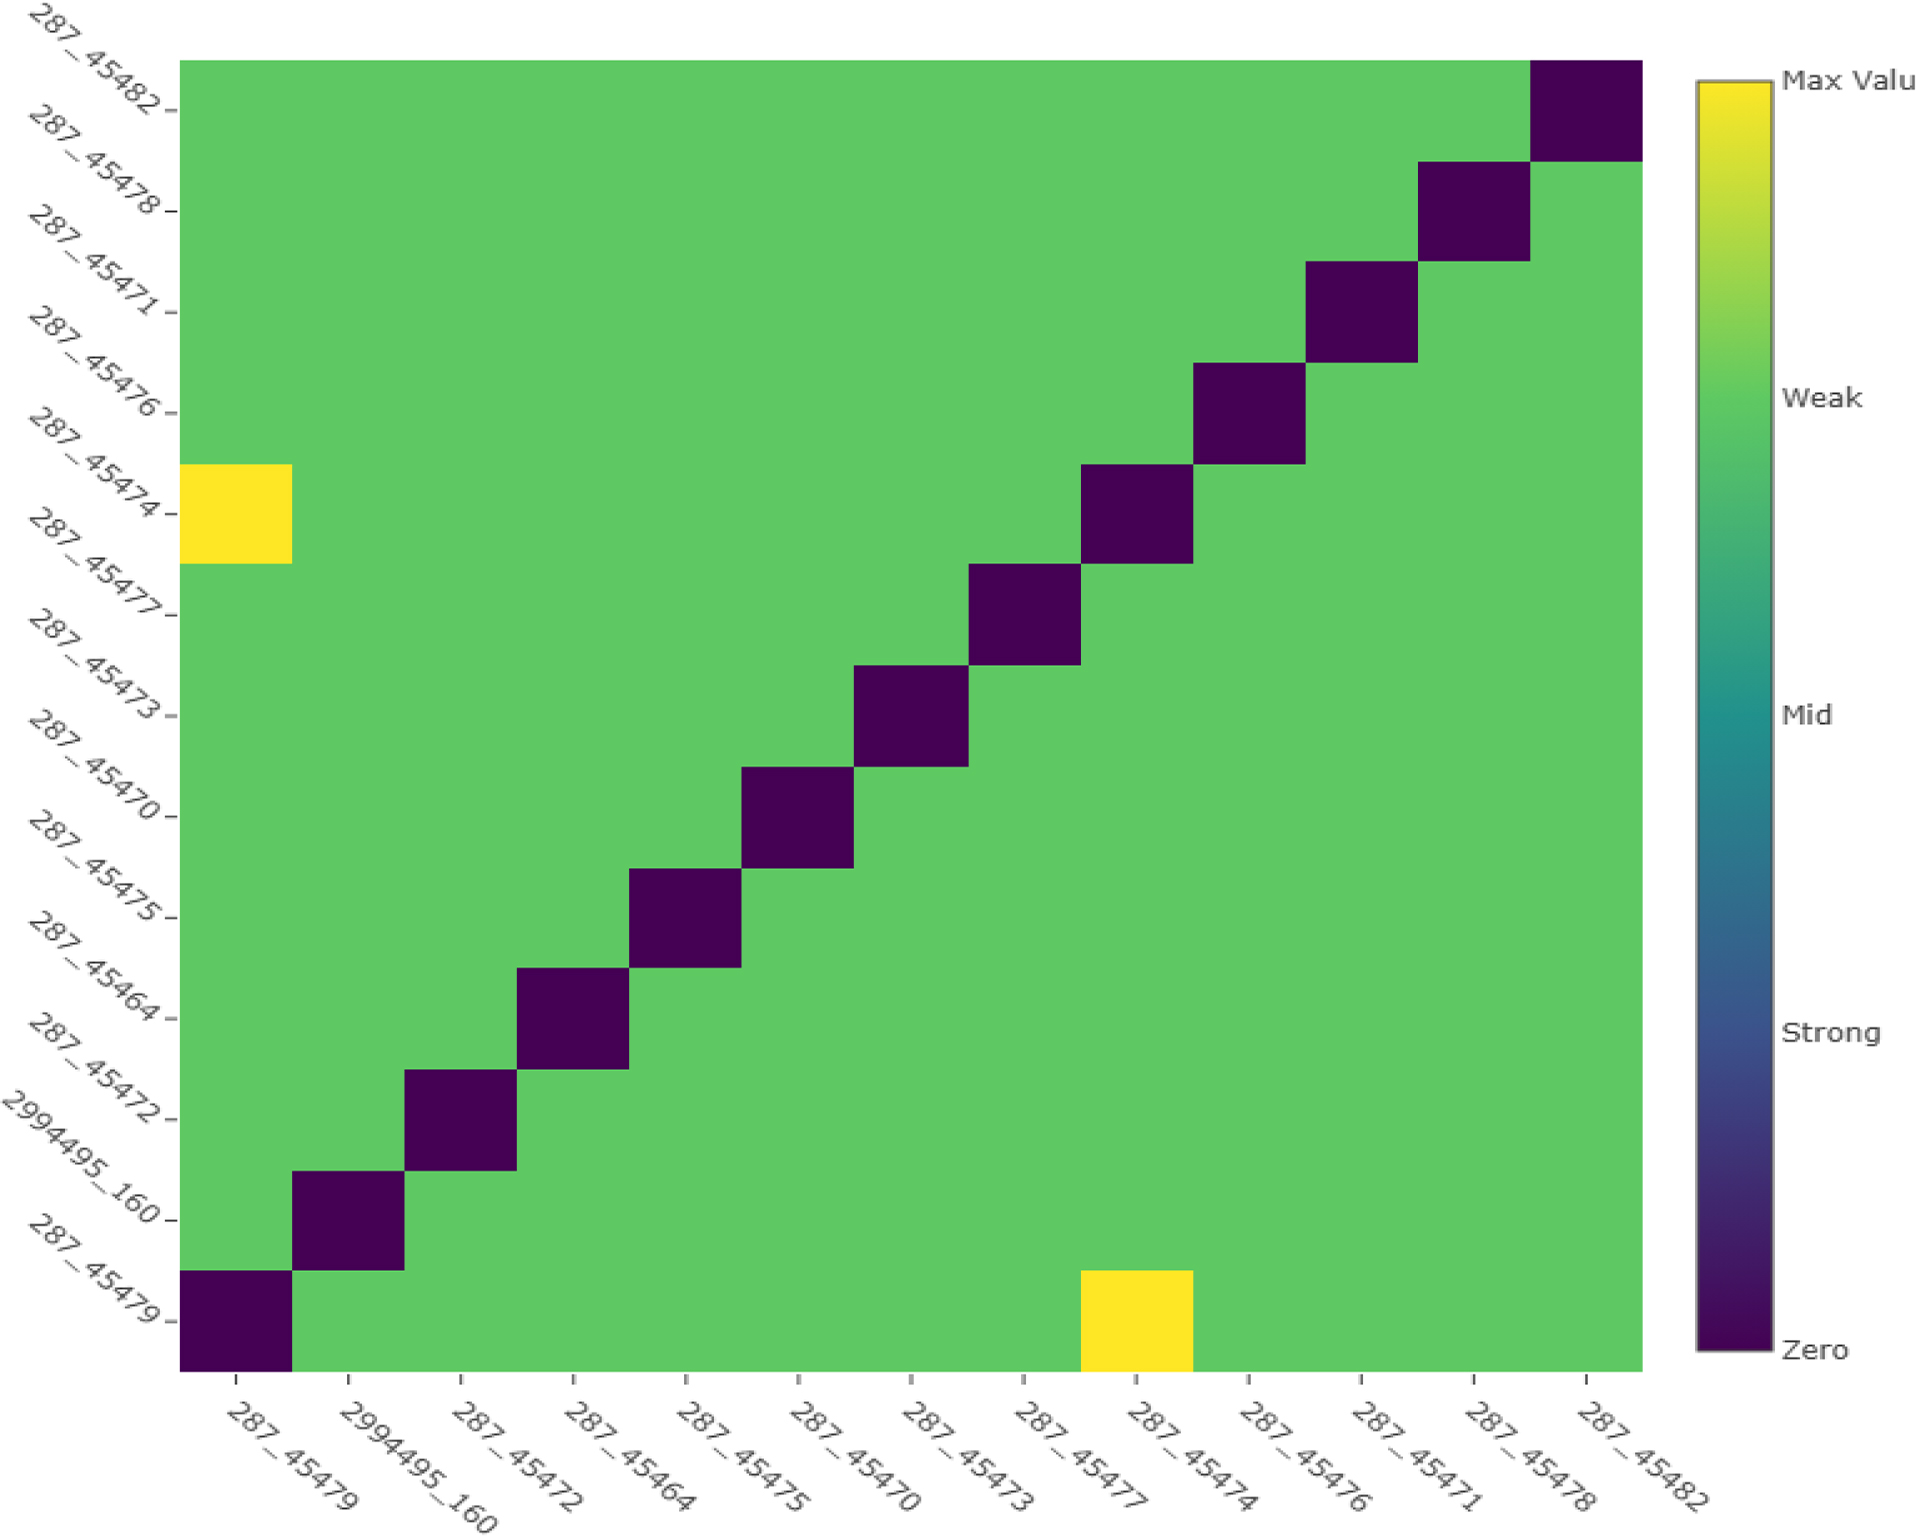
Fig. 4.
Heatmap of pairwise core-genome SNP distances among 13 Pseudomonas aeruginosa isolates. Each cell represents the number of single-nucleotide polymorphism (SNP) differences between isolate pairs, with lower values indicating closer genomic relatedness and higher values reflecting increased genetic divergence. The absence of low SNP-distance clusters consistent with recent transmission supports the presence of a genetically heterogeneous population.
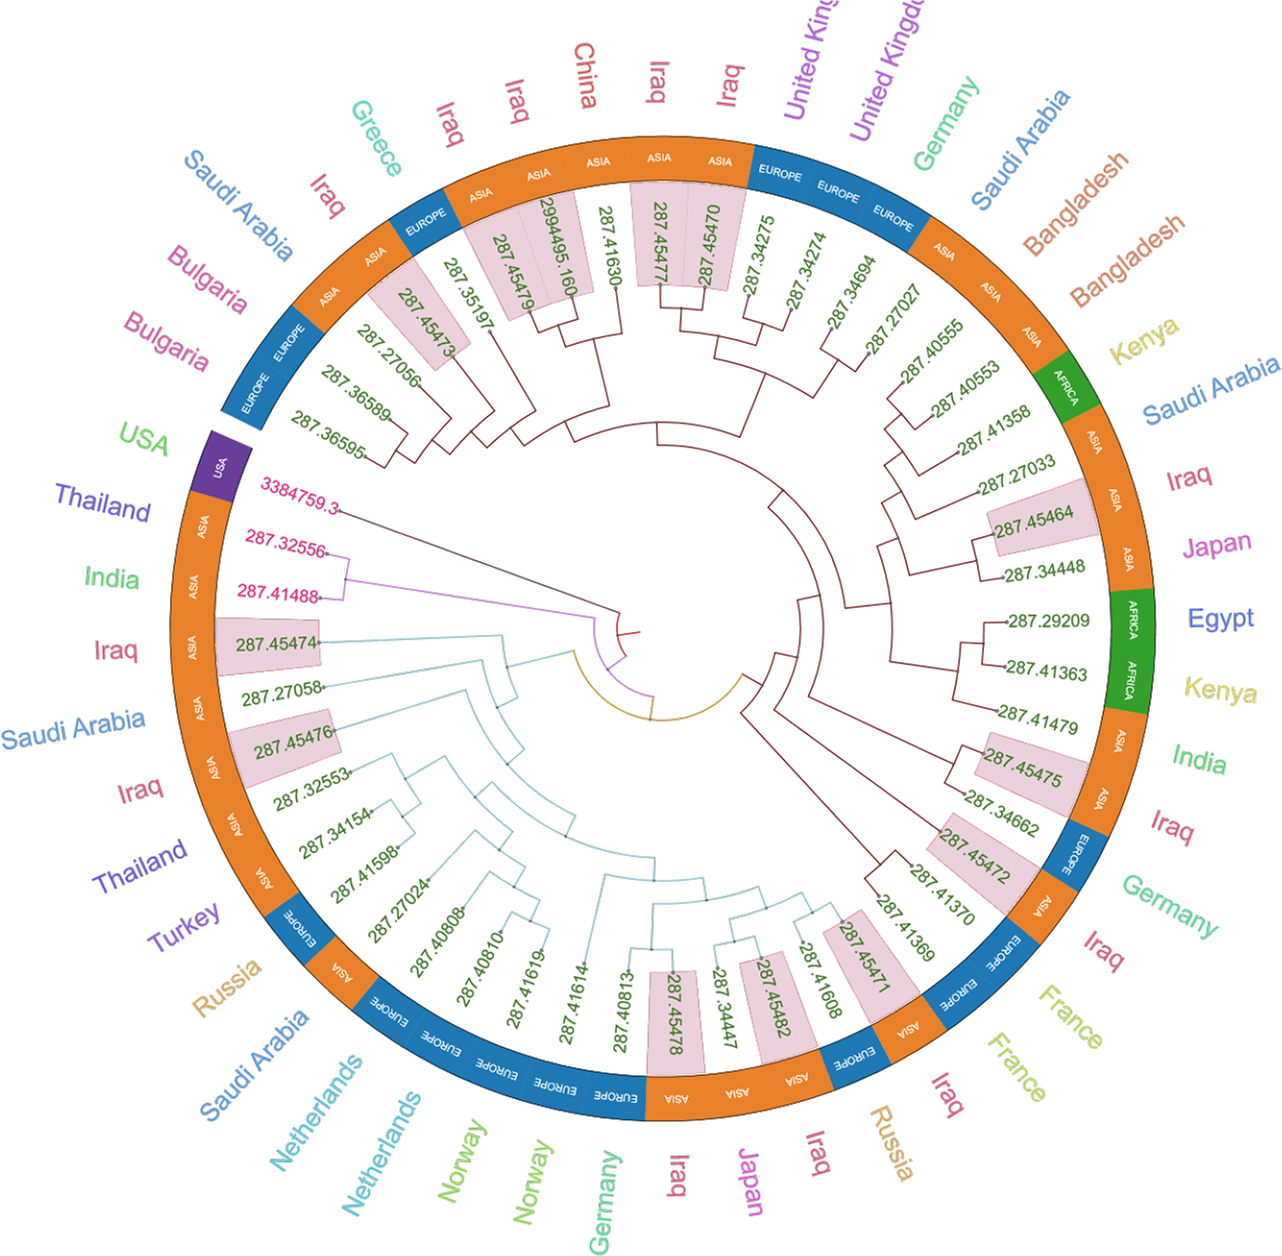
Fig. 5.
Core-genome SNP-based phylogenetic tree of Pseudomonas aeruginosa isolates with geographic annotation. The circular phylogenetic tree was constructed from core-genome single-nucleotide polymorphisms (SNPs) and visualized with iTOL, with branch lengths representing nucleotide substitutions per site. Genomic IDs are shown at the tips, while colored labels and outer rings indicate the country and continent of isolation for each strain.
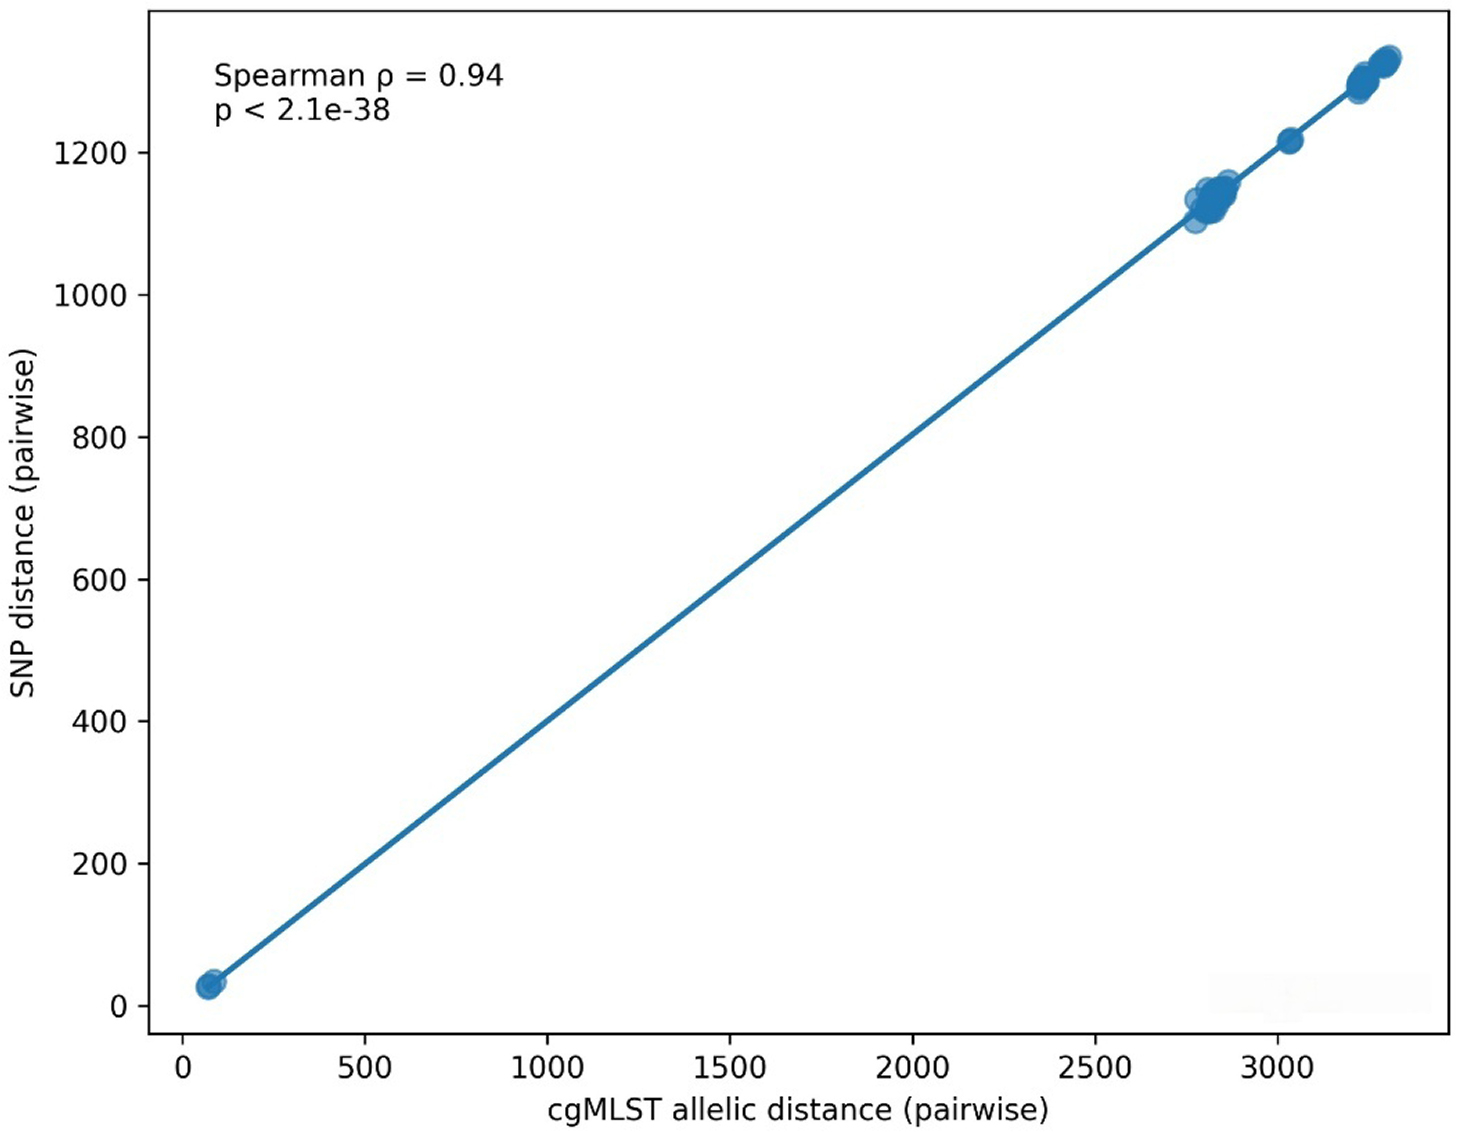
Fig. 6.
Correlation between pairwise cgMLST allelic distances and SNP distances among 13 clinical Pseudomonas aeruginosa isolates. Each point represents a pairwise comparison between two isolates. A strong positive correlation was observed (Spearman’s ρ = 0.94, p < 2.1 × 10−38), indicating high concordance between allele-base d and nucleotide-based measures of genomic relatedness. The solid line represents the linear regression fit.