Fig. 1.
Fig. 2.
Fig. 3.
Fig. 4.
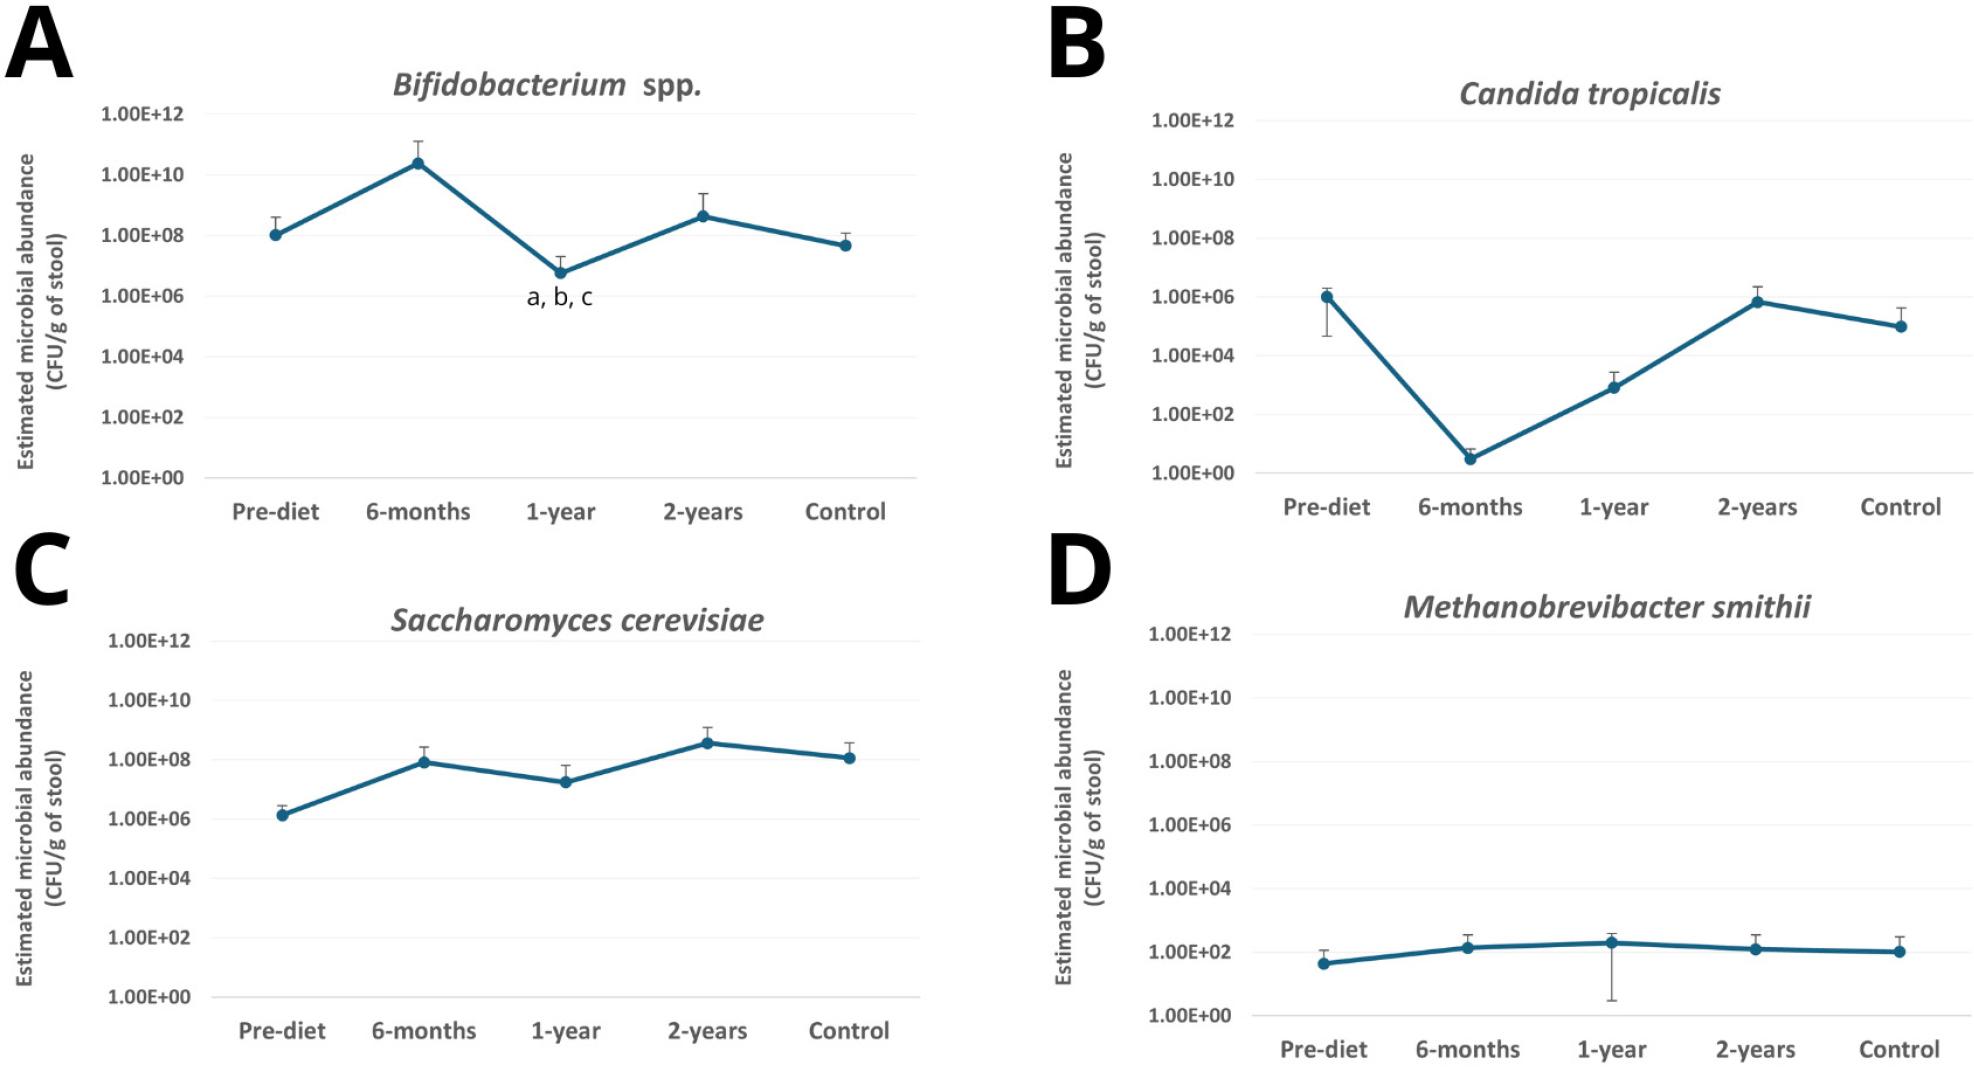
Fig. 5.
Primer and probe sequences for qPCR and corresponding thermal cycling parameters used for detection of the respective microorganisms_
| Microorganism | Sequence (5’ to 3’) | Thermal cycling conditions | References |
|---|---|---|---|
| Bifidobacterium | |||
| forward primer | CGCGTCYGGTGTGAAAG | 50°C – 2 min | Delroisse et al. 2008 |
| Candida tropicalis | |||
| forward primer | GCGGTAGGAGAATTGCGTT | 50°C – 2 min | Brinkman et al. 2003 |
| Saccharomyces cerevisiae | |||
| forward primer | GAAATGCCACCGTGAATGC | 95°C – 5 min | Farmani et al. 2025 |
| Methanobrevibacter smithii | |||
| forward primer | CCGGGTATCTAATCCGGTTC | 95°C – 15 min | Dridi et al. 2009 |
Mean microbial load (CFU/g of stool) of selected microorganisms in positive samples determined by qPCR_
| Microorganism | Group | ||||
|---|---|---|---|---|---|
| Pre-diet | 6-month follow-up | 1-year follow-up | 2-year follow-up | healthy control | |
| Bifidobacterium spp.* [mean microbial load per gram of stool in positive samples] | 1.03 × 10⁸ CFU/g (n = 21) | 2.40 × 10¹⁰CFU/g (n = 19) | 5.71 × 10⁶ CFU/g (n = 22) | 4.26 × 10⁸ CFU/g (n = 22) | 4.57 × 10⁷ CFU/g (n = 22) |
| Candida tropicalis | 1.01 × 10⁶ CFU/g (n = 4) | 3.02 × 100 CFU/g (n = 4) | 8.04 × 10² CFU/g (n = 7) | 6.74 × 10⁵ CFU/g (n = 13) | 9.57 × 10⁴ CFU/g (n = 13) |
| Saccharomyces cerevisiae | 1.34 × 10⁶ CFU/g (n = 5) | 8.05 × 10⁷ CFU/g (n = 7) | 1.74 × 10⁷ CFU/g (n = 10) | 3.61 × 10⁸ CFU/g (n = 9) | 1.14 × 10⁸ CFU/g (n = 14) |
| Methanobrevibacter. smithii | 4.35 × 101 CFU/g (n = 5) | 1.36 × 10² CFU/g (n = 5) | 1.97 × 10² CFU/g (n = 2) | 1.22 × 10² CFU/g (n = 7) | 1.02 × 10² CFU/g (n = 8) |