Coeliac disease (CeD) is a chronic immune-mediated enteropathy of the small intestine that develops in genetically predisposed individuals because of dietary gluten exposure (Ludvigsson et al. 2013). The disease is characterized by an increased number of intraepithelial lymphocytes, crypt hyperplasia, and villous atrophy, leading to a reduced absorptive surface of the small intestine and impaired nutrient absorption (Cukrowska 2020). Based on serological screening studies, its global prevalence is approximately 1.4%, whereas the prevalence of biopsy-confirmed disease is approximately 0.7%. Although coeliac disease more often manifests in childhood, it can develop at any stage of life (Singh et al. 2018). Interestingly, despite being a genetically determined condition, an increasing number of cases are diagnosed for the first time in adulthood, suggesting that genetic predisposition alone is insufficient for disease onset (Salamon et al. 2026). Coeliac disease may therefore remain asymptomatic for many years before clinical symptoms appear, and its manifestation is likely dependent on the presence of additional environmental triggers beyond genetic factors (Lionetti et al. 2015; Caio et al. 2019). Consequently, higher detection rates in children may reflect earlier disease manifestation or more intensive diagnostic screening, whereas disease onset in adulthood is more likely related to the cumulative or delayed impact of environmental influences (Lionetti et al. 2015; Lebwohl and Rubio-Tapia 2021). Predisposing factors for the development of CeD can be divided into genetic and environmental factors. The disease occurs in individuals carrying specific Human Leukocyte Antigen (HLA) allotypes, primarily HLA-DQ2.5, as well as HLA-DQ2.2 and HLA-DQ8. The HLA-DQ2.5 allotype is the most frequently detected among patients with coeliac disease (Iversen and Sollid 2023). The presence of these HLA variants is considered a necessary but not sufficient condition for disease development (Iversen and Sollid 2023). Environmental factors that may increase the risk of coeliac disease include gastrointestinal infections, exposure to antibiotics and proton pump inhibitors, and alterations in the composition of the gut microbiota (Sarno et al. 2015). Dietary gluten intake is an essential trigger for the development of coeliac disease. Gluten is a complex of water-insoluble storage proteins present in cereals such as wheat, rye, and barley. In individuals with CeD, gluten peptides penetrate the intestinal mucosa and are deamidated by tissue transglutaminase (tTG), which facilitates their binding to HLA-DQ2 and HLA-DQ8 molecules and induces an immune response that leads to intestinal inflammation (Ludvigsson et al. 2013).
Currently, the only effective treatment for CeD is lifelong strict adherence to a gluten-free diet (Al-Toma et al. 2019; Luque et al. 2024). A gluten-free diet involves the elimination of products containing wheat, barley, rye, triticale, spelt, and kamut, as well as foods potentially contaminated with gluten, such as oats (Ludvigsson et al. 2013; Al-Toma et al. 2019). According to the Codex Alimentarius standards, products labeled as gluten-free must not contain more than 20 mg of gluten per kilogram of product (Codex Alimentarius Commission 2015). Following a gluten-free diet leads to symptom resolution and gradual regeneration of the small intestinal mucosa (Tye-Din 2022), but also modifies the intestinal environment, potentially affecting the composition and activity of the gut microbiota (Sarno et al. 2015).
The human gastrointestinal tract harbors a complex ecosystem of microorganisms, including bacteria, archaea, and eukaryotes, which contribute to intestinal barrier integrity, protection against pathogens, and immune regulation (Thursby and Juge 2017; Sokol 2019). Gut microbiota composition is dynamic and influenced by diet, lifestyle, and medications such as antibiotics (Grice and Segre 2012; El-Sayed et al. 2021). Alterations in gut microbiota composition have been observed in patients with coeliac disease compared to healthy individuals, and growing evidence suggests that these changes may play a role in disease pathogenesis. It has been hypothesized that certain microorganisms, present in excess, can modify gluten peptides, thereby increasing their immunogenicity and activating gluten-specific T cells in genetically predisposed individuals (Marasco et al. 2016; Caminero et al. 2016). Conversely, probiotic bacteria such as Lactobacillus (Di Cagno et al. 2011), which are often found in reduced numbers in patients, not only fail to generate immunogenic peptides but may even reduce their immunogenicity (Caminero et al. 2016). On the other hand, some of the observed microbial changes may not be directly related to disease pathogenesis but rather to adherence to a gluten-free diet (Kaliciak et al. 2022). Despite these observations, longitudinal studies examining how the composition of selected gut microorganisms’ changes before and during the implementation of a gluten-free diet, especially in pediatric populations, remain limited.
Considering the above considerations, the aim of our study was to perform a longitudinal analysis of gut microbiota in pediatric patients with CeD before dietary intervention and at 0.5, 1, and 2 years after initiating a gluten-free diet. These findings were then compared with data from healthy children assessed at a single time point to better understand the dynamics of gut microbiota in pediatric coeliac disease.
The study material consisted of 120 microbial DNA isolates previously extracted from stool samples of pediatric patients with CeD (n = 24) and healthy controls (n = 24) aged 2–18 years, who had been recruited at the Department of Pediatrics, Gastroenterology and Nutrition of the University Children’s Hospital in Krakow as part of a different scientific project (Salamon et al. 2024, Salamon et al. 2026). Samples from healthy controls were collected once (n = 24). Healthy controls served as a reference group representing baseline microbiota composition in children without coeliac disease. The DNA isolates analyzed in the present study originated from stool samples collected within the original study, in which individuals with recent antibiotic or probiotic use were excluded to minimize factors that could influence gut microbiota composition.
Samples from CeD patients (n = 24 per time point) were collected longitudinally and categorized into four sampling time points according to the timing of collection: 1) pre-diet time point (samples collected prior to gluten-free diet initiation); 2) 6-month follow-up point (samples collected after six months of dietary treatment); 3) 1-year follow-up point (samples collected after one year of diet); 4) 2-year follow-up point (samples collected after two years of dietary treatment).
All CeD patients had completed longitudinal sampling, and microbial DNA from the isolates was available for all four time points. The use of DNA from the isolates for the present study was approved by the Committee for Research Ethics of Jagiellonian University Medical College (No. 118.0043.1.356.2025, September 30, 2025). In the present study, repeated sampling was performed exclusively in the CeD group to capture potential microbiome changes associated with the introduction and long-term adherence to a gluten-free diet. The healthy controls were sampled once and served as a reference group representing baseline microbial composition in children without coeliac disease. This approach is supported by evidence indicating that the gut microbiota in healthy individuals remains relatively stable over time in the absence of major dietary or clinical interventions (Faith et al. 2013; Mortensen et al. 2018; He et al. 2025).
DNA samples used in the present study were previously extracted from stool samples using the Genomic Mini AX Stool kit according to the manufacturer’s protocol (A&A Biotechnology, Gdansk, Poland), with an additional pre-treatment step including enzymatic lysis of bacterial cells using lysozyme (Sigma Aldrich, Poznan, Poland), lysostaphin (A&A Biotechnology, Gdansk, Poland), and mutanolysin (A&A Biotechnology, Gdansk, Poland), and fungal cells using lyticase (A&A Biotechnology, Gdansk, Poland). Approximately 120–150 mg of stool was used for DNA extraction from each sample. The exact mass of each stool sample was recorded prior to DNA extraction and subsequently used in the calculations to express microbial quantities as CFU equivalents per gram of stool. This approach allowed normalization of qPCR-derived microbial counts to the original sample mass and ensured comparability between samples. Prior to analysis, the concentration and purity of the stored DNA samples were measured again using a NanoDrop spectrophotometer (Thermo Fisher Scientific, Waltham, MA, USA) to verify their suitability for further experiments. DNA concentrations ranged from approximately 45 to 150 ng/μl, and the A260/A280 purity ratios were ≥ 1.7 for all samples. In addition, the presence of amplifiable microbial DNA was verified by conventional PCR targeting the bacterial 16S rRNA gene and fungal ITS-1 region, followed by agarose gel electrophoresis. All samples yielded visible amplicons, confirming successful DNA extraction and adequate DNA quality for downstream qPCR analysis. DNA samples were not normalized prior to qPCR amplification, as microbial quantities were subsequently calculated and expressed as CFU equivalents per gram of stool using microorganism-specific standard curves.
Previously extracted microbial DNA was used to detect and quantify selected intestinal microorganisms, including the fungi S. cerevisiae and C. tropicalis, the methanogenic archaeon M. smithii, and bacteria of the genus Bifidobacterium. Quantitative real-time polymerase chain reaction (qPCR) was performed using TaqMan probes labeled with the FAM fluorophore (Genomed, Warsaw, Poland). Each qPCR reaction mixture included 2 μl of template DNA, 5 μl of the qPCR-HS Mix Probe (A&A Biotechnology, Gdańsk, Poland), 0.2 μl of each primer (20 μM; Genomed, Warsaw, Poland), 0.6 μl of the corresponding TaqMan probe (10 μM; Genomed, Warsaw, Poland), and 2 μl of nuclease-free water (A&A Biotechnology, Gdansk, Poland). The primer and probe sequences used in the study are presented in Table I. Reactions were prepared in optical PCR strips (Genoplast, Rokocin, Poland) and run on a CFX96 real-time PCR detection system (Bio-Rad, California, USA). Positive controls consisted of DNA from appropriate reference strains (C. tropicalis ATCC 13803, M. smithii DSM 861, S. cerevisiae ATCC 4098, Bifidobacterium ATCC 15700), whereas negative controls contained nuclease-free water (A&A Biotechnology, Gdańsk, Poland) instead of template DNA. The thermal parameters applied for each target are shown in Table I.
Primer and probe sequences for qPCR and corresponding thermal cycling parameters used for detection of the respective microorganisms.
| Microorganism | Sequence (5’ to 3’) | Thermal cycling conditions | References |
|---|---|---|---|
| Bifidobacterium | |||
| forward primer | CGCGTCYGGTGTGAAAG | 50°C – 2 min | Delroisse et al. 2008 |
| Candida tropicalis | |||
| forward primer | GCGGTAGGAGAATTGCGTT | 50°C – 2 min | Brinkman et al. 2003 |
| Saccharomyces cerevisiae | |||
| forward primer | GAAATGCCACCGTGAATGC | 95°C – 5 min | Farmani et al. 2025 |
| Methanobrevibacter smithii | |||
| forward primer | CCGGGTATCTAATCCGGTTC | 95°C – 15 min | Dridi et al. 2009 |
Amplification was monitored by fluorescence detection, and quantification was based on quantification cycle (Cq) values. Standard curves generated from 10-fold serial dilutions of reference strain DNA were used to determine the quantity of target microorganisms in the samples. Cq values from the standard curve allowed estimation of the numbers of microorganisms in positive samples. Amplification plots were visually inspected to confirm the presence of characteristic exponential amplification curves indicative of true positive reactions, and only such amplification profiles were considered positive. Negative controls were included in each qPCR run and consistently showed no amplification. An overview of the study design and analytical workflow is presented in Fig. 1.
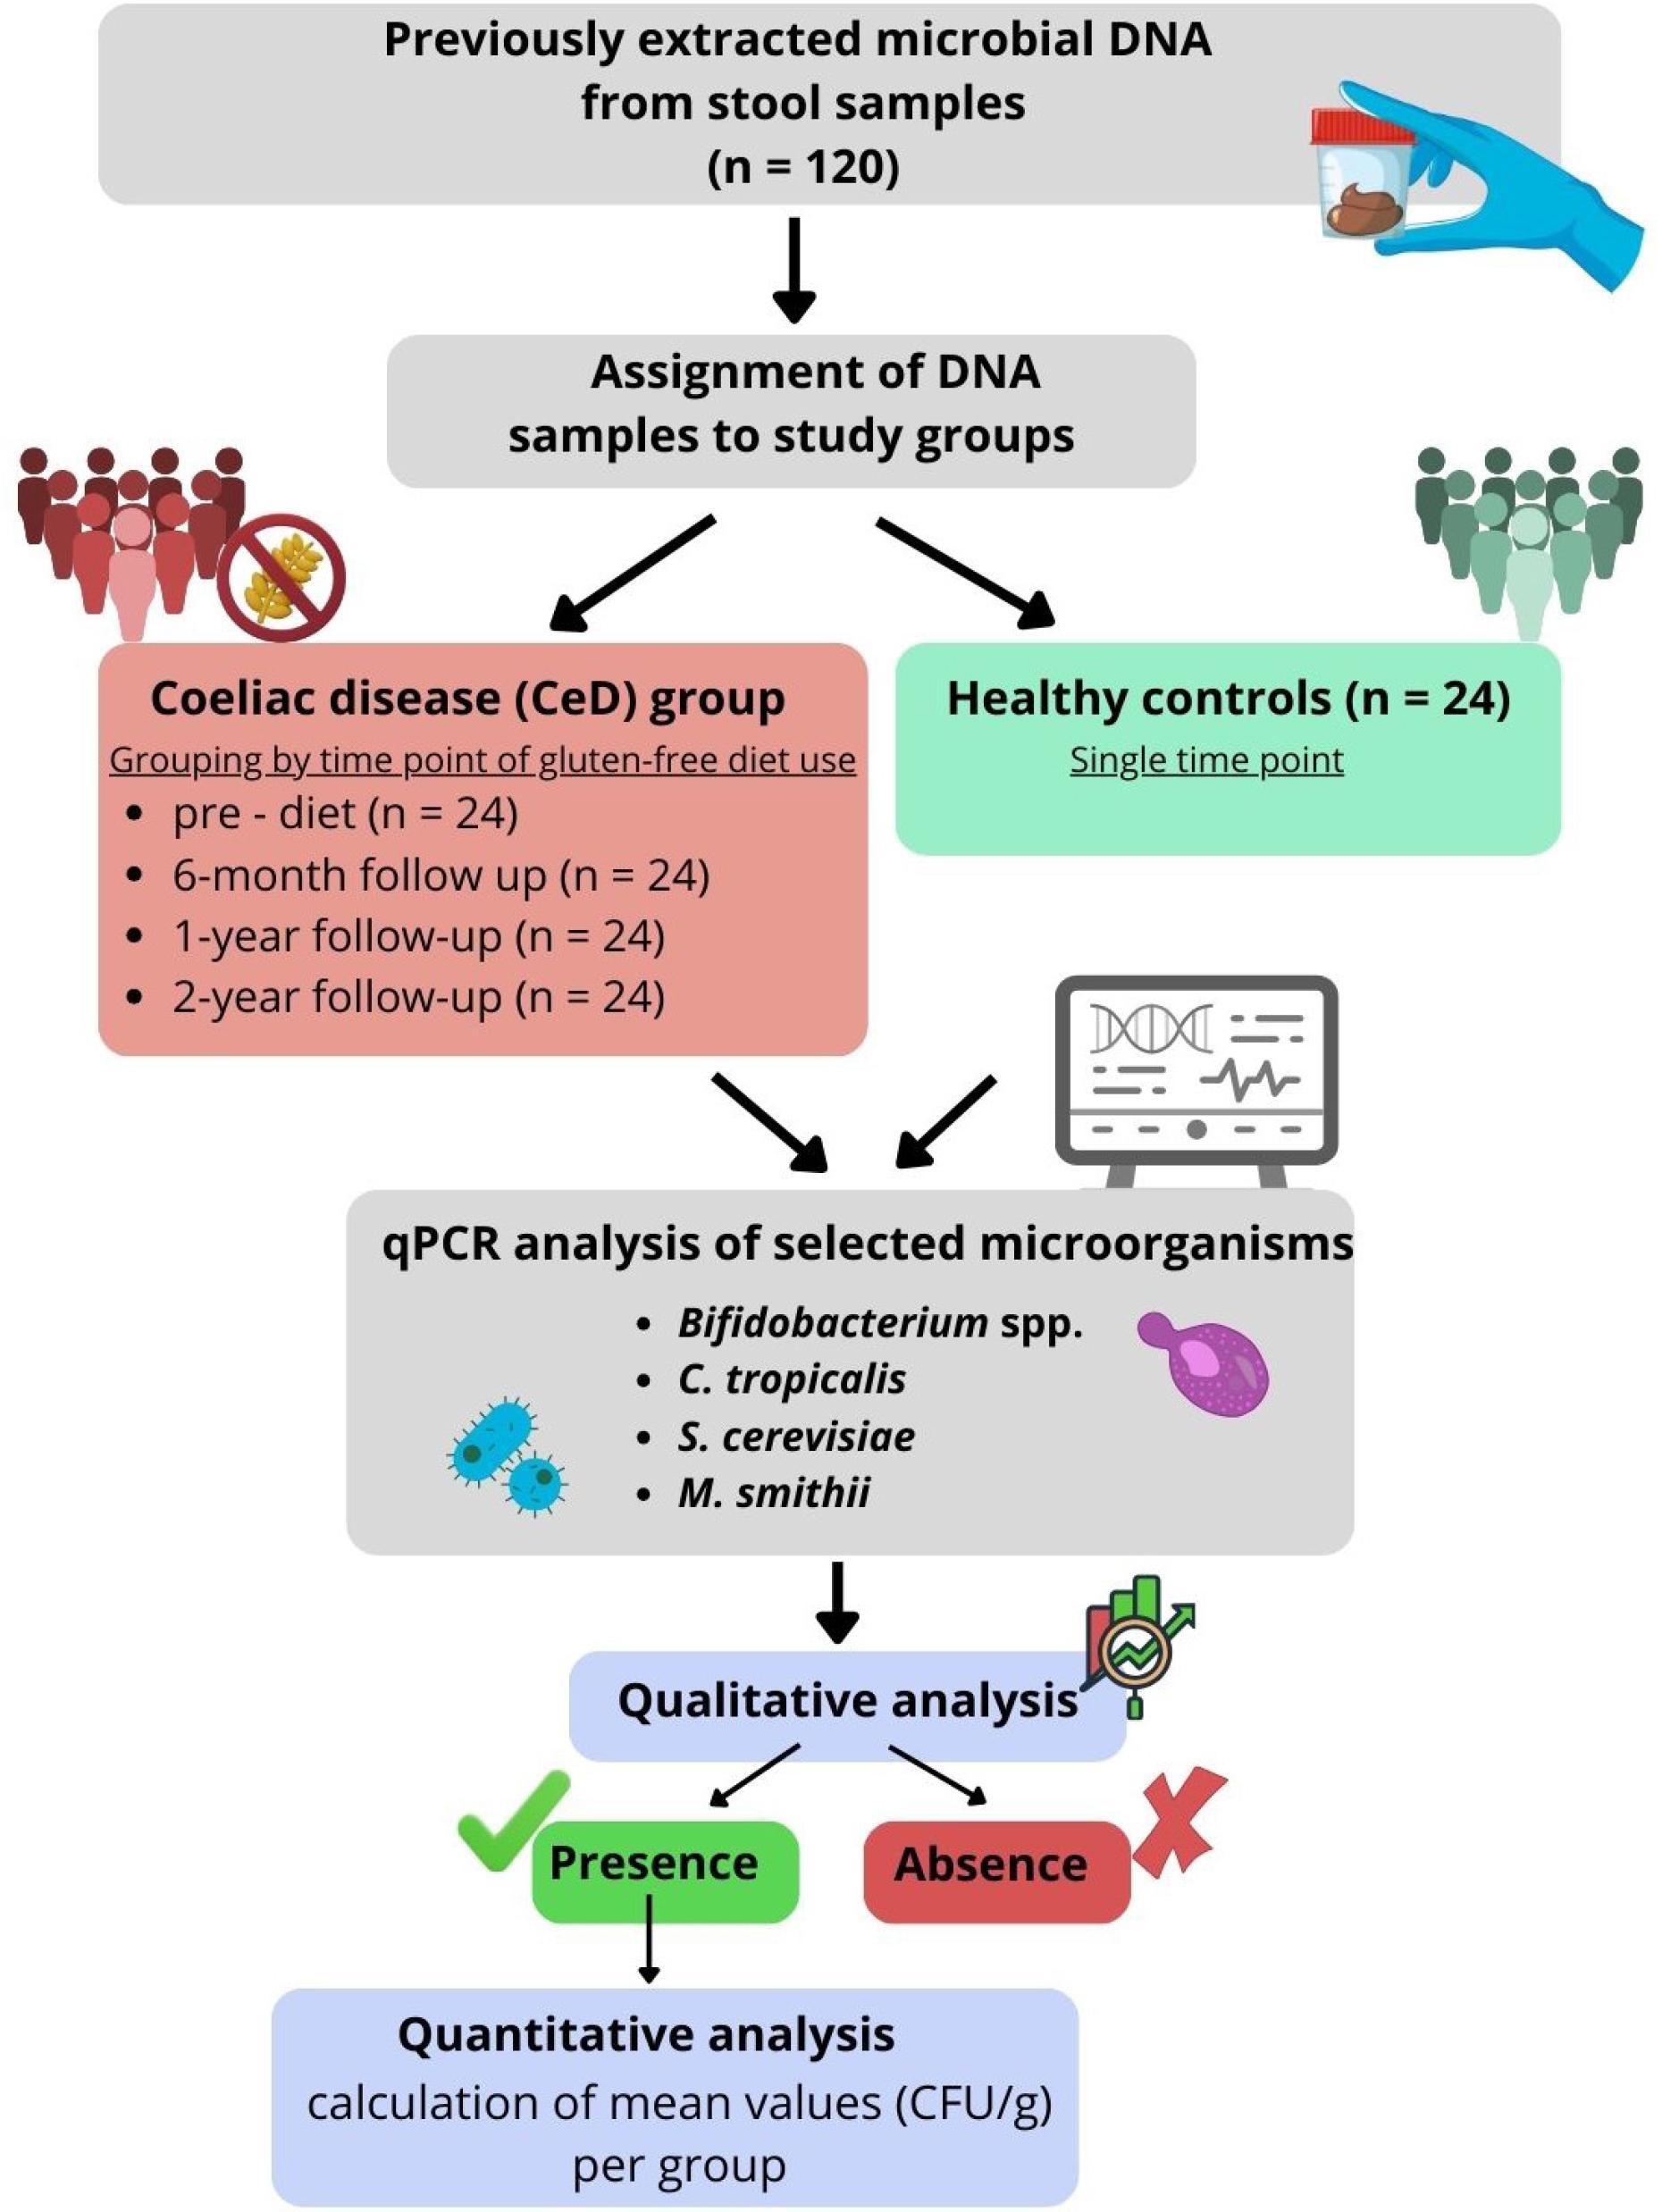
Study workflow illustrating the assignment of DNA samples to study groups and subsequent qPCR analysis.
Statistical analyses were performed using IBM SPSS Statistics 29.0.2.0 (Armonk, NY, USA). The prevalence of individual microorganisms was compared between groups using the χ2 test. When expected cell counts were below 5, the Fisher–Freeman–Halton exact test was applied. For statistical analysis, each sampling time point was treated as a separate comparison group to evaluate temporal changes in the prevalence and abundance of microorganisms during dietary treatment.
Microbial concentrations (colony-forming units per gram, CFU/g) were analyzed using the non-parametric Kruskal–Wallis test. When the test indicated significance, post-hoc Dunn’s test was used to identify group differences. A p-value < 0.05 was considered statistically significant.
At the pre-diet time point in CeD group, Bifidobacterium were detected in 87.5% of samples. At the 6-month follow-up, they were detected in 79.2%. At the 1-year follow-up, the prevalence increased to 91.7% of samples, and the same percentage was observed at the 2-year follow-up time point (91.7%). In the control group, Bifidobacterium spp. was present in 91.7% of samples. No significant differences in the presence of Bifidobacterium were observed between the study groups (p = 0.718).
At the pre-diet time point in the CeD group, C. tropicalis was detected in 16.7% of samples. Detection remained unchanged at 16.7% of samples at the 6-month follow-up, increased to 29.2% at the 1-year follow-up, and then rose to 54.2% at the 2-year follow-up. In the control group, C. tropicalis was detected in 54.2% of samples. The presence of C. tropicalis differed significantly between the study groups (χ2 (4) = 15.34, p = 0.004).
At the pre-diet time point in the CeD group, S. cerevisiae was detected in 20.8% of samples. After six months, the prevalence increased to 29.2%. At the 1-year follow-up, it reached 41.7% and slightly decreased to 37.5% at the 2-year follow-up. In the control group, S. cerevisiae was detected in 58.3% of samples. No significant differences in the presence of S. cerevisiae were observed between the study groups (χ2 (4) = 8.18, p = 0.096).
At the pre-diet time point in the CeD group, M. smithii was observed in 20.8% of samples. Detection remained stable at 20.8% of samples at the 6-month follow-up, decreased to 8.3% at the 1-year follow-up, and increased to 29.2% at the 2-year follow-up. In the control group, M. smithii was found in 33.3% of samples. No significant differences in the presence of M. smithii were observed between the study groups (χ2 (4) = 5.07, p = 0.322). No amplification was observed in negative controls.
Percentages of positive samples for all four microorganisms are summarized in Fig. 2. To further illustrate colonization heterogeneity within the studied cohort, the overlap between detected microorganisms was analyzed across all sampling time points. A microorganism was considered present if it was detected in at least one of the samples analyzed. The distribution of single and combined detection patterns is presented as a Venn diagram (Fig. 3).
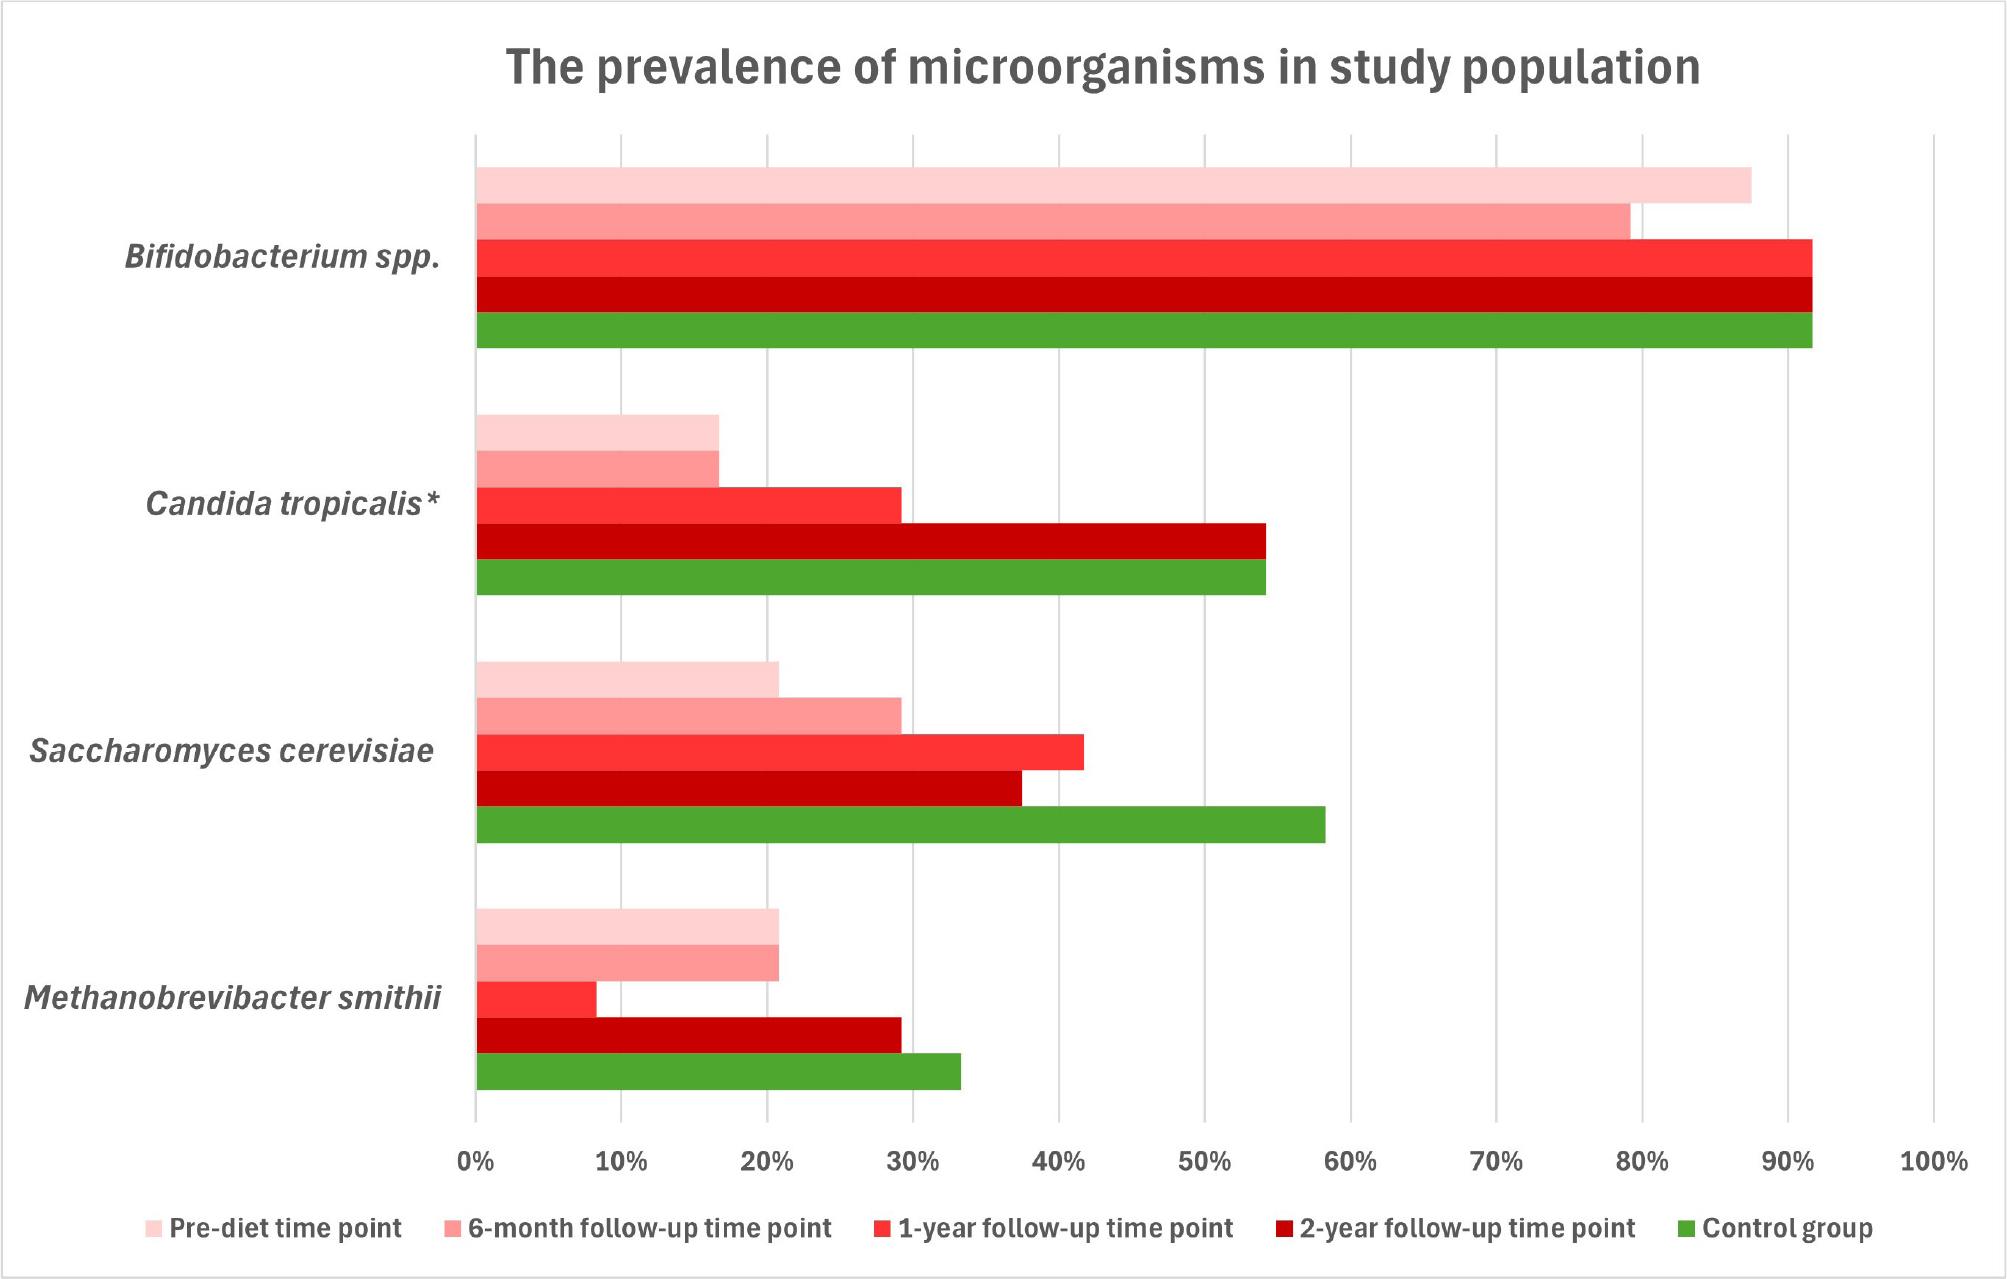
The prevalence of Bifidobacterium spp., Candida tropicalis, Saccharomyces cerevisiae, and Methanobrevibacter smithii in stool samples from pediatric coeliac patients and healthy controls.
* – statistically significant differences between the study groups (χ2(4) = 15.34; p = 0.004)
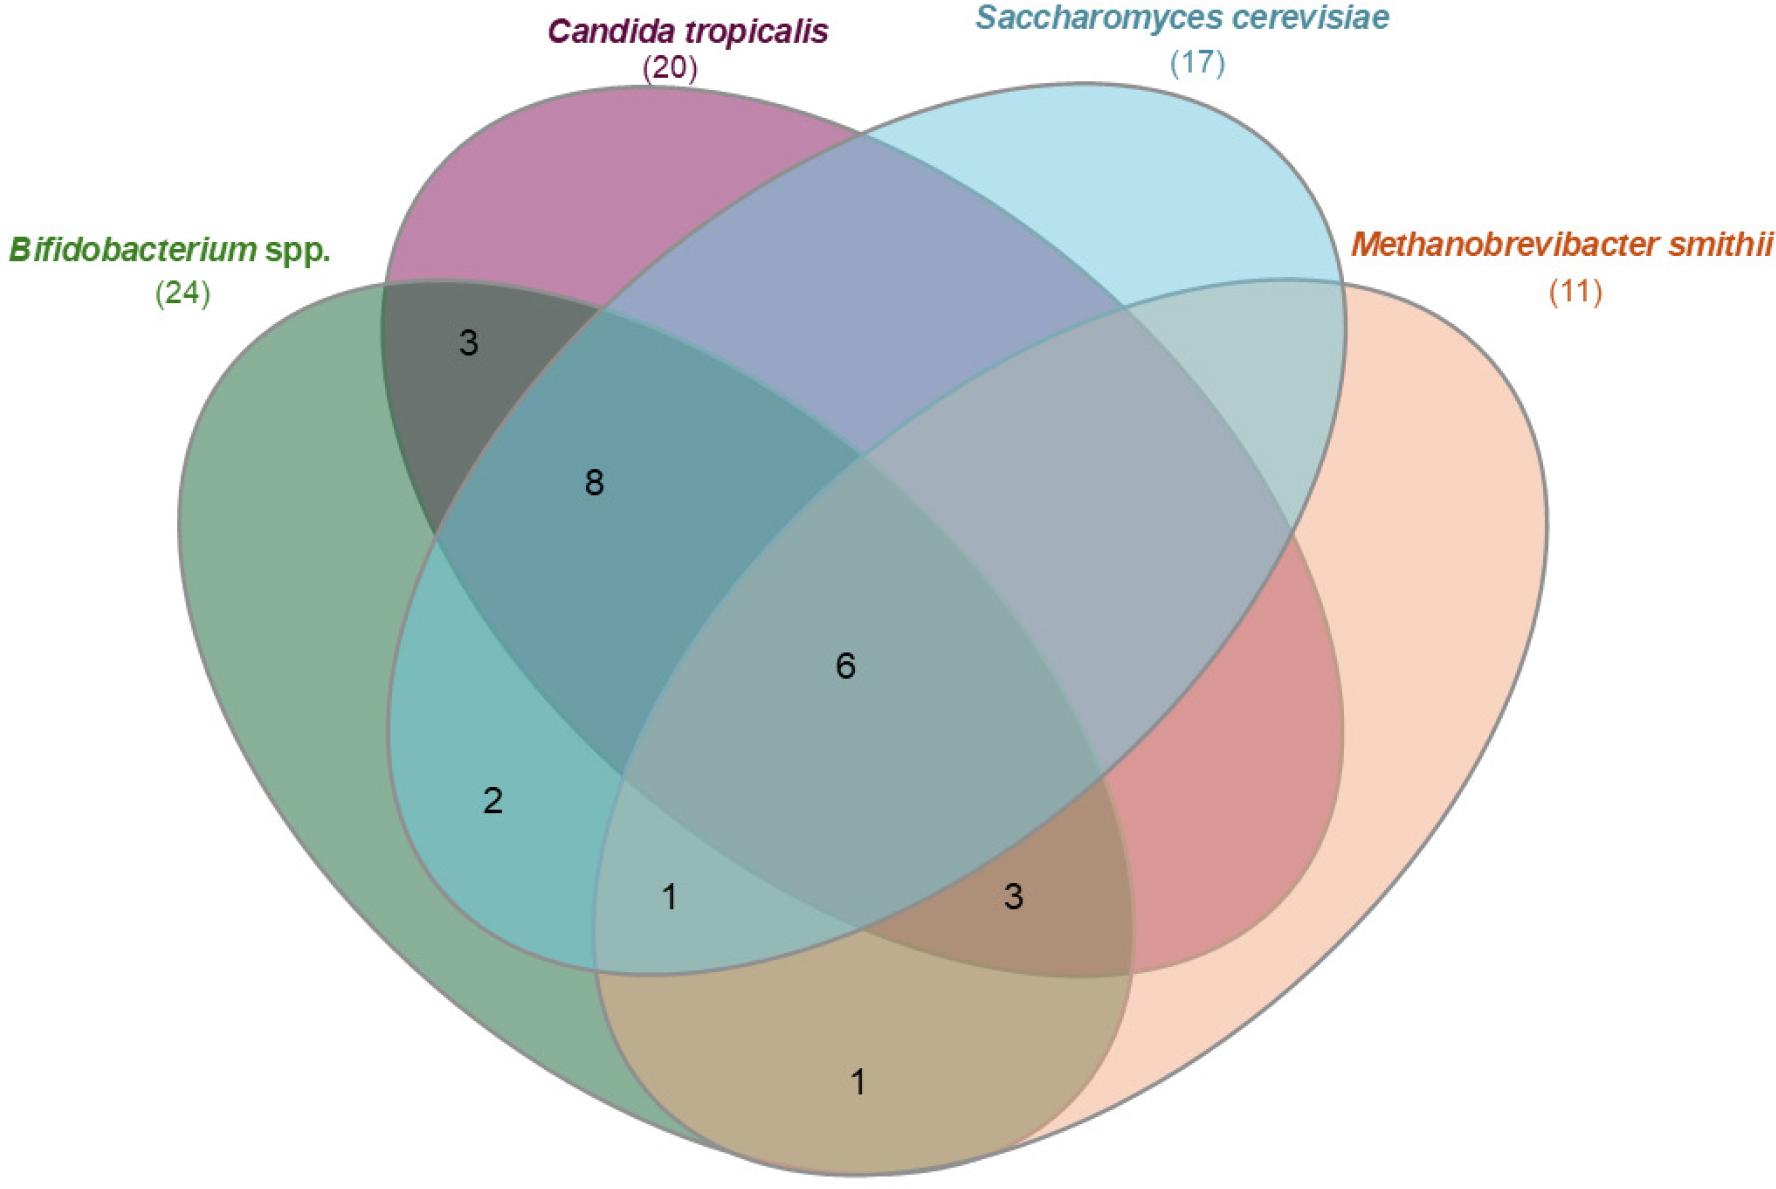
Venn diagram illustrating the overlap of detected microorganisms in stool samples from pediatric coeliac disease. Each set represents samples positive for the given microorganism in at least one of the longitudinal sampling time points. Numbers indicate the number of samples harboring individual microorganisms or their combinations.
Quantitative analysis was performed only on samples in which the presence of a given microorganism was detected by qPCR. The microbial load in each positive sample was calculated based on standard curves generated from the reference strains. Subsequently, the mean microbial load for each group (pre-diet, 6-month follow-up, 1-year follow-up, 2-year follow-up, healthy control) was determined. The results are summarized in Table II and in Fig. 4.
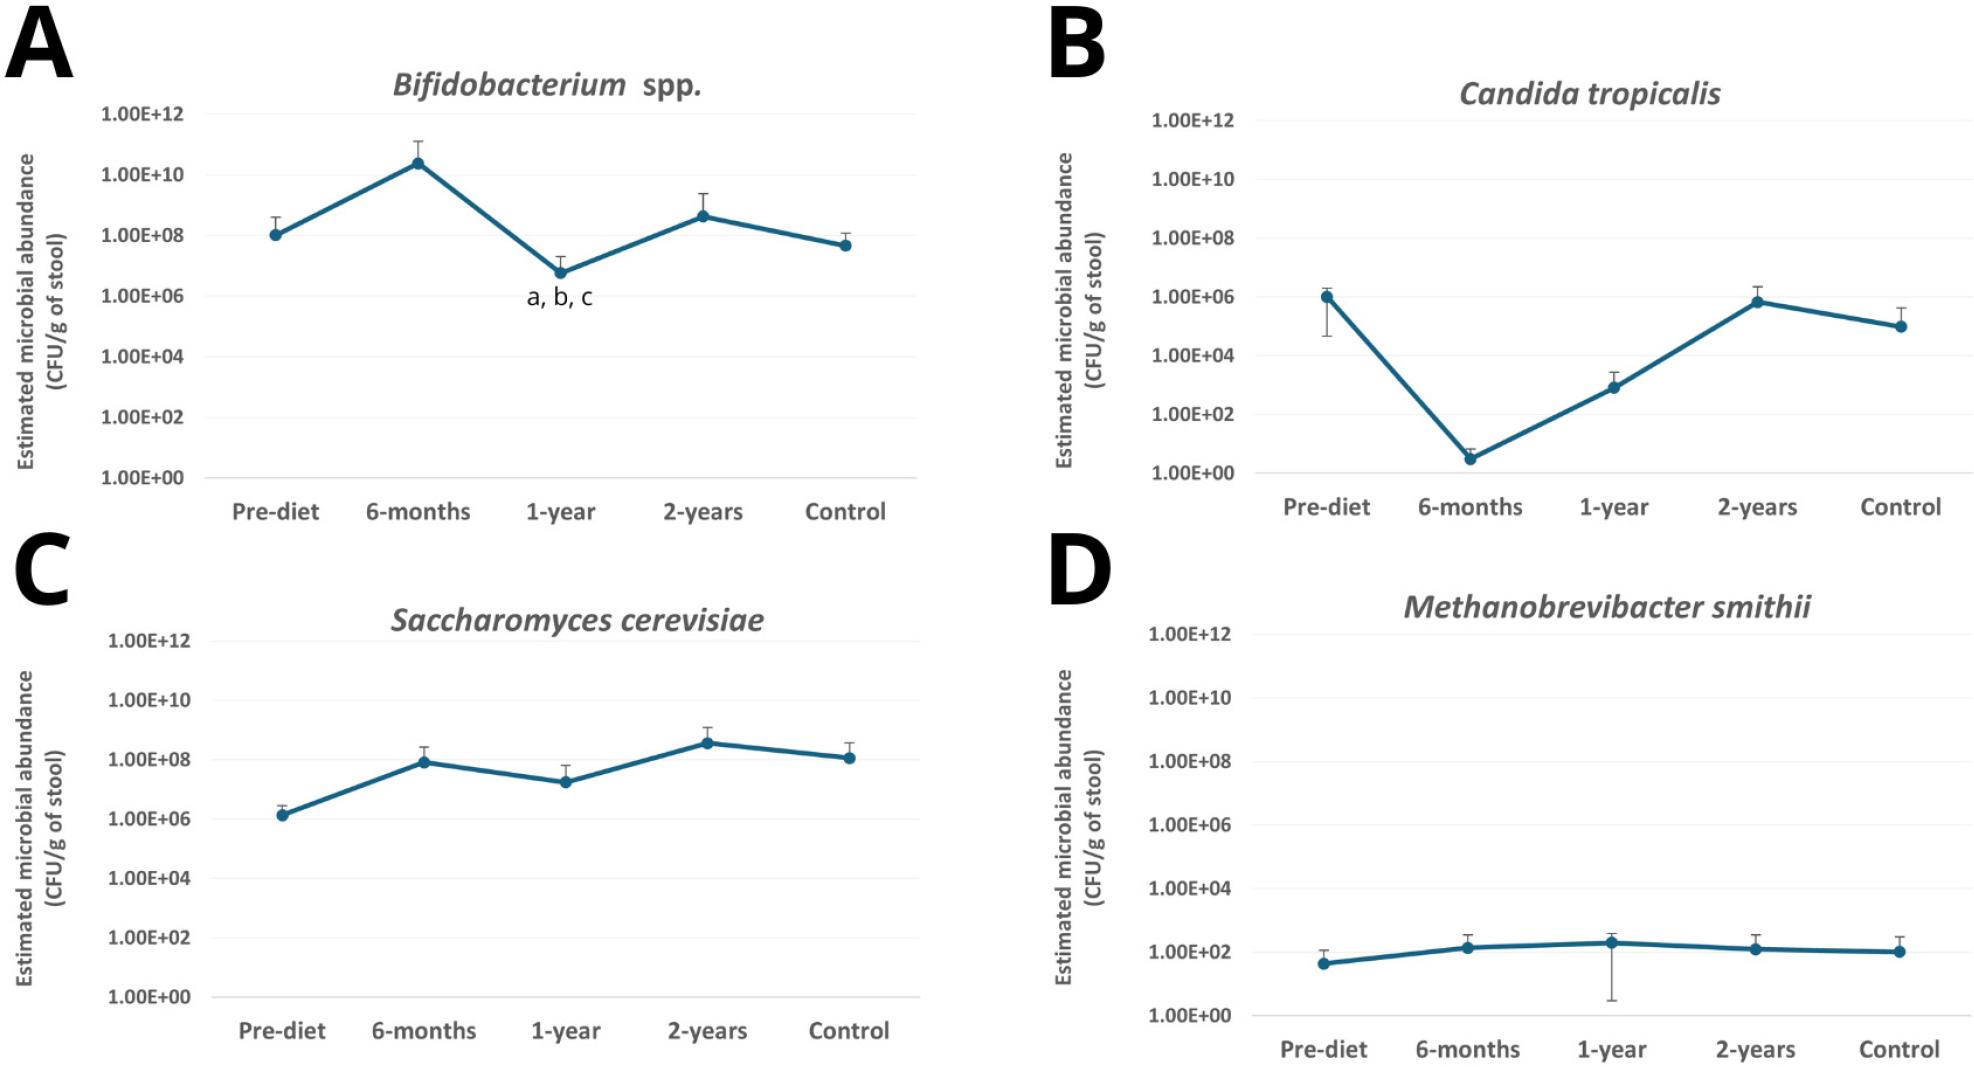
Estimated abundance of selected intestinal microorganisms in stool samples collected from children with coeliac disease before and during adherence to a gluten-free diet and from healthy controls. Microbial abundance was calculated based on qPCR standard curves and expressed as CFU/g of stool. Panels: (A) Bifidobacterium spp., (B) Candida tropicalis, (C) Saccharomyces cerevisiae, (D) Methanobrevibacter smithii. Values represent mean abundance calculated from positive samples. Error bars represent standard deviation calculated from positive samples.
a – statistically significant difference between pre-diet and 1-year follow-up (p = 0.038)
b – statistically significant difference between 1-year and 2-year follow-up (p = 0.031)
c – statistically significant difference between 1-year follow-up and control (p = 0.018)
Mean microbial load (CFU/g of stool) of selected microorganisms in positive samples determined by qPCR.
| Microorganism | Group | ||||
|---|---|---|---|---|---|
| Pre-diet | 6-month follow-up | 1-year follow-up | 2-year follow-up | healthy control | |
| Bifidobacterium spp.* [mean microbial load per gram of stool in positive samples] | 1.03 × 10⁸ CFU/g (n = 21) | 2.40 × 10¹⁰CFU/g (n = 19) | 5.71 × 10⁶ CFU/g (n = 22) | 4.26 × 10⁸ CFU/g (n = 22) | 4.57 × 10⁷ CFU/g (n = 22) |
| Candida tropicalis | 1.01 × 10⁶ CFU/g (n = 4) | 3.02 × 100 CFU/g (n = 4) | 8.04 × 10² CFU/g (n = 7) | 6.74 × 10⁵ CFU/g (n = 13) | 9.57 × 10⁴ CFU/g (n = 13) |
| Saccharomyces cerevisiae | 1.34 × 10⁶ CFU/g (n = 5) | 8.05 × 10⁷ CFU/g (n = 7) | 1.74 × 10⁷ CFU/g (n = 10) | 3.61 × 10⁸ CFU/g (n = 9) | 1.14 × 10⁸ CFU/g (n = 14) |
| Methanobrevibacter. smithii | 4.35 × 101 CFU/g (n = 5) | 1.36 × 10² CFU/g (n = 5) | 1.97 × 10² CFU/g (n = 2) | 1.22 × 10² CFU/g (n = 7) | 1.02 × 10² CFU/g (n = 8) |
– Statistically significant differences: pre-diet vs. 1-year follow-up (p = 0.038); 1-year follow-up vs. 2-year follow up (p = 0.031); 1-year follow-up vs. control (p = 0.018). All samples (n = 24 per group) were analyzed by qPCR. Quantitative values are presented for positive samples only.
n – the number of positive samples in each group
Quantitative analysis was restricted to positive samples to avoid artificially inflating zeros. The distribution of Cq values across study groups is presented in Fig. 5, illustrating variability in detection thresholds between microorganisms and time points. Higher Cq values observed for fungal and archaeal targets likely reflect their lower abundance in stool samples compared with dominant bacterial taxa such as Bifidobacterium spp.
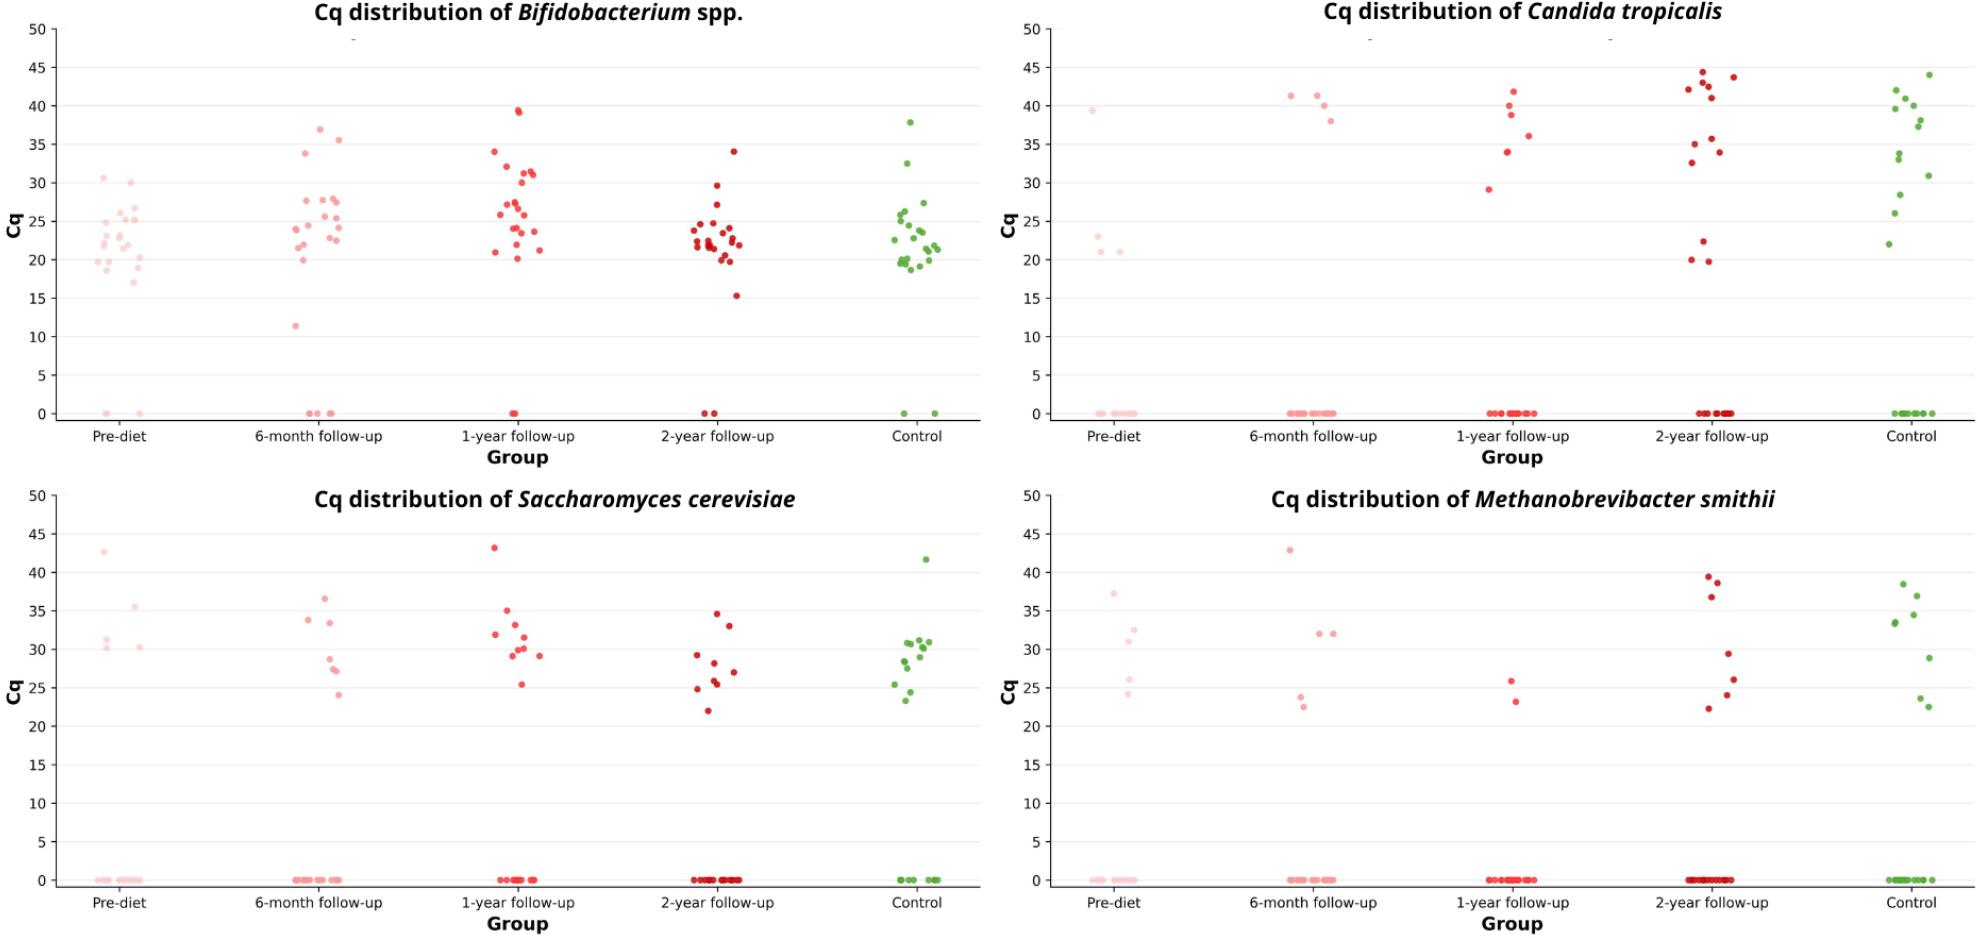
Distribution of Cq values of selected microorganisms across study groups.
The Kruskal–Wallis test revealed significant differences in the number of Bifidobacterium between the study groups (p = 0.003). Further pairwise comparisons showed that the number of these bacteria in the 1-year follow-up time point was significantly lower than in the pre-diet time point (p = 0.038). Statistically significant differences were also found between 1-year follow-up and 2-year follow-up time points (p = 0.031) and between 1-year follow-up time point and the healthy controls (p = 0.018). No significant differences were observed for the other microorganisms. It should be noted that the quantitative analysis included only samples that tested positive by qPCR, which in some groups represented a small number of cases. The limited sample size may therefore have affected the statistical power and contributed to the lack of significant differences between groups.
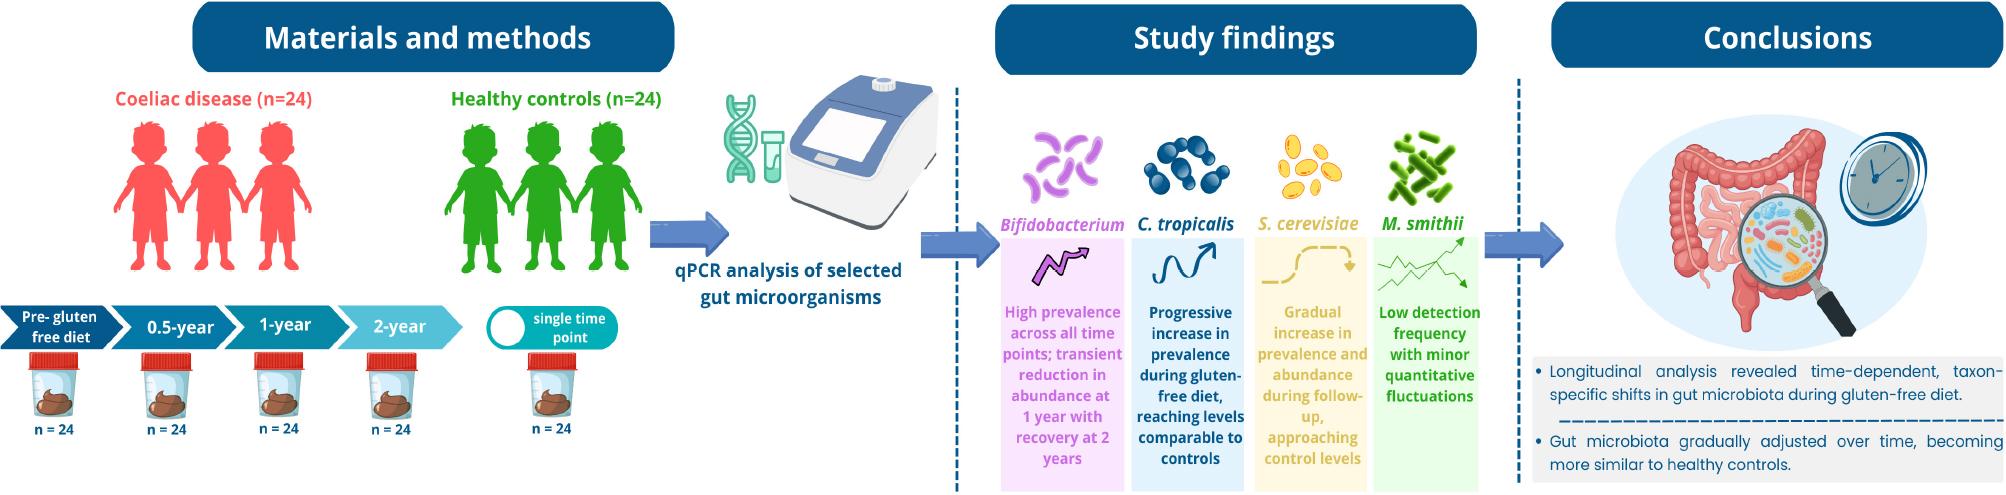
In this longitudinal study, we primarily focused on temporal changes in selected gut microorganisms within pediatric patients with coeliac disease during adherence to a gluten-free diet. The comparison with the control group provided a baseline reference for microbial composition, whereas the primary focus of the present study was to evaluate temporal changes in microbial prevalence and abundance within the same patient cohort during dietary treatment. We observed dynamic changes in the prevalence of selected gut microorganisms over time.
Bifidobacterium spp. was detected in most pre-diet samples, with a slight transient decrease at six months, followed by a gradual increase at one and two years, reaching levels comparable to those observed in healthy controls (Fig. 2). These temporal patterns suggest a microorganism-specific response to dietary intervention and may reflect adaptation of the gut environment to long-term gluten elimination. Importantly, these changes were observed within the same patient cohort over time, highlighting microbiome dynamics during dietary treatment rather than fixed differences between patients and controls.
Notably, microbial load showed dynamic shifts over time. Initially, mean bacterial load (CFU/g) of Bifidobacterium was similar to that observed in healthy controls. After six months of a gluten-free diet, their abundance increased substantially, followed by a marked decrease at one year, and finally returned to levels comparable to baseline and to those in the control group by two years, which was statistically significant (Table II, Fig. 3). These rapid fluctuations may reflect temporary disturbances in the gut environment caused by the sudden introduction of a strict gluten-free diet, including changes in nutrient availability, reduced intake of fermentable fibers and prebiotics, and alterations in carbohydrate composition, with gradual microbial adaptation over the following months restoring a more stable composition. When interpreted in a longitudinal context, these fluctuations likely reflect transitional adaptation phases rather than persistent dysbiosis.
Previous studies have reported heterogeneous findings regarding Bifidobacterium in coeliac disease, often influenced by differences in study design, population, and duration of dietary treatment. Several studies conducted in adult populations have reported significantly lower abundance of Bifidobacterium spp. in CeD compared with healthy controls, even during long-term adherence to a gluten-free diet, suggesting that microbiota imbalance may persist despite dietary treatment (Golfetto et al. 2014; Wacklin et al. 2014; Naseri et al. 2021). Similar trends have also been described in pediatric populations (Collado et al. 2008; De Palma et al. 2010). Importantly, most of these studies were cross-sectional and did not include intermediate follow-up time points, which may explain discrepancies with the present longitudinal observations. This difference in study design highlights the value of longitudinal sampling, as applied in the present study, when interpreting Bifidobacterium dynamics during dietary treatment. Beyond abundance, species-level diversity may also differ. Sanz et al. reported significantly lower Bifidobacterium species diversity in children with coeliac disease than in healthy children, and Bifidobacterium adolescentis was not detected in coeliac samples but was characteristic of healthy children (Sanz et al. 2007). These findings suggest that not only quantitative but also qualitative alterations within the genus may contribute to disease-associated dysbiosis. While most observational studies report lower Bifidobacterium levels in CeD, genetic evidence offers a more complex perspective. In a two-sample Mendelian randomization study, Xu et al. found that a higher genetically predicted relative abundance of the Bifidobacterium genus was associated with an increased risk of coeliac disease, suggesting that the relationship between Bifidobacterium and disease may depend on context, including host genetics, strain or species composition, and immune status (Xu et al. 2022). Taken together, these findings highlight the multifactorial nature of host-microbiome interactions and support the interpretation that temporal fluctuations, such as those observed in our study, may reflect adaptive rather than purely pathogenic processes.
Probiotic interventions involving Bifidobacterium spp. have been explored as potential adjunctive approaches in coeliac disease; however, their effects appear to be strain-specific and not consistently associated with changes in overall microbial abundance (Klemenak et al. 2015; De Almeida et al. 2020; Khorzoghi et al. 2023; Zolnikova et al. 2023).
The prevalence of S. cerevisiae showed a gradual upward trend from 20.8% pre-diet to 29.2% at six months and 41.7% at one year, with a slight decrease to 37.5% at two years, remaining lower than in healthy controls (58.3%) at all time points (Fig. 2). The microbial load of these fungi was highly variable, with relatively lower counts observed prior to starting the gluten-free diet, followed by a gradual increase over the course of dietary treatment, approaching levels similar to those in healthy children (Table II). Notably, S. cerevisiae is generally considered a nonpathogenic commensal fungus, so the observed increase does not indicate harmful overgrowth but rather a normalization of the gut fungal community. When interpreted in a longitudinal context, the gradual increase in both prevalence and abundance suggests progressive adaptation of the intestinal fungal community during gluten-free diet adherence rather than a stable difference between coeliac patients and healthy controls. Although no statistically significant differences were detected, it should be noted that the relatively small group sizes may have limited the statistical power to detect significant changes over time. Thus, the observed trends should be interpreted as indicative of temporal dynamics rather than definitive group differences.
Previous studies have reported heterogeneous findings regarding S. cerevisiae in coeliac disease. For example, El Mouzan et al., observed a significantly higher abundance of Saccharomyces spp., including S. cerevisiae, in children with newly diagnosed CeD compared with healthy controls, indicating a potential role of fungal dysbiosis in disease pathogenesis (El Mouzan et al. 2022). In contrast, Harnett et al., reported higher detection frequency of Saccharomyces spp. in adults with CeD adhering to a long-term gluten-free diet who continued to report gastrointestinal symptoms compared with symptomatic non-CeD controls (33.3% vs 10.7%) (Harnett et al. 2017). These discrepancies may be explained by differences in study populations, disease stage, and study design, particularly the lack of longitudinal follow-up in most previous studies. To complement these microbiological observations, several studies have examined anti-Saccharomyces cerevisiae antibodies (ASCA) as an indirect marker of host-microbiota interaction in coeliac disease (Mallant-Hent et al. 2006; Toumi et al. 2007). Toumi et al. demonstrated a significantly higher prevalence of ASCA in untreated patients with CeD disease compared with healthy controls (27.2% vs 3.7%; p < 0.001) with absence of ASCA IgG in children adhering to a strict gluten-free diet (Toumi et al. 2007). Mallant-Hent et al. reported a decrease in ASCA prevalence from 18% at diagnosis to 1% after dietary treatment (Mallant-Hent et al. 2006). Although these findings do not directly reflect fungal abundance, they support the concept that gluten–free diet is associated with restoration of intestinal barrier function and altered host-microbiota interactions (Duerksen et al. 2005). Taken together, the observed temporal trends in S. cerevisiae suggest gradual normalization of the intestinal fungal community during dietary treatment, rather than persistent fungal dysbiosis.
Focusing further on the fungal microbiota, we observed a gradual change in the prevalence of C. tropicalis during adherence to a gluten-free diet. The prevalence of this fungus was lowest at the pre-diet time point (16.7%) and remained unchanged after six months (16.7%), followed by an increase to 29.2% after one year and reaching 54.2% after two years of dietary adherence, achieving a level comparable to that observed in healthy controls (54.2%). This progressive increase indicates a time-dependent shift in colonization patterns within the same patient cohort.
The highest C. tropicalis microbial load was observed at baseline, prior to initiation of the gluten-free diet. After 6 months of dietary treatment, the mean microbial load decreased markedly to values near the detection limit. This was followed by a gradual increase, with levels at two years approaching those observed in healthy controls. Importantly, the mean microbial load was calculated solely from positive samples, and at early time points, the number of positive cases was limited. Consequently, mean values derived from only a few positive samples should be interpreted with caution, as they may not fully represent the variability within the broader cohort. Therefore, temporal trends in prevalence may provide a more robust indicator of microbial dynamics than quantitative estimates alone in this setting.
In contrast, comparisons based on time points with a comparable number of positive samples, such as the two-year follow-up and the control group, provide a more stable reference for quantitative assessment. These findings indicate that the observed divergence between prevalence and microbial load reflects not only changes in the number of colonized individuals but also fluctuations in fungal quantity among positive samples, particularly when measured values approach the detection threshold. Importantly, the presence of positive samples itself represents a biologically meaningful parameter, as shifts in prevalence may occur independently of absolute fungal counts and may better capture changes in colonization dynamics over time. When interpreted in a longitudinal context, the convergence of C. tropicalis prevalence towards levels observed in healthy controls suggests gradual microbiome normalization during dietary treatment rather than persistent fungal overgrowth.
To our knowledge, most studies in CeD have mainly focused on the genus level (Candida spp.) rather than on individual species such as C. tropicalis. El Mouzan et al., reported higher mucosal abundance of Candida in children with newly diagnosed CeD compared with healthy controls (El Mouzan et al. 2022). In contrast, Harnett et al. reported that Candida spp. were detected in 33% of the fecal samples from adults with CeD adhering to a gluten-free diet for at least 12 months, whereas Candida spp. was not detected in non-coeliac controls. However, these findings are difficult to compare due to differences in study population and design (Harnett et al. 2017). Such discrepancies may partly reflect differences in study design, particularly the lack of longitudinal follow-up in most previous studies. Taken together, these findings suggest that Candida dynamics in CeD may vary across disease stages and dietary status, which is consistent with the gradual increase in C. tropicalis prevalence observed in the present longitudinal cohort rather than indicating persistent overgrowth. Although direct evidence linking C. tropicalis to CeD pathogenesis remains limited, some hypotheses involving related species propose that fungal components may influence immune activation and epithelial barrier function. For example, Candida albicans has been suggested to contribute to disease initiation through molecular mimicry mechanisms involving hyphal wall protein 1 (HWP1), potentially enhancing immune responses to gluten-related antigens (Nieuwenhuizen et al. 2003). Beyond CeD, experimental evidence suggests that C. tropicalis may act as a pro-inflammatory agent under certain conditions (Hoarau et al. 2016; Di Martino et al. 2022). However, in the context of the present longitudinal study, the observed patterns are more consistent with adaptive microbial shifts than with sustained pathogenic expansion.
M. smithii was detected in a minority of pre-diet samples (20.8%). Prevalence remained unchanged after six months, decreased to 8.3% after one year, and reached 29.2% after two years of adherence to a gluten-free diet, approaching the level observed in healthy controls (33.3%). This pattern indicates temporal variability in archaeal colonization within the same patient cohort during dietary treatment.
In contrast, the mean microbial load remained relatively low, with only minor fluctuations across time points, and values at two years were comparable to those observed in controls. Importantly, quantitative estimates were derived exclusively from positive samples, and at certain times, particularly at the one-year follow-up, the number of positive cases was limited, which may have influenced the stability of mean values. Therefore, these findings should be interpreted with caution, and prevalence-based observations may better reflect temporal trends in this context. Methanogenic archaea, including M. smithii, remain underexplored in coeliac disease, as conventional microbiome studies focus primarily on bacteria and may not reliably capture archaeal taxa due to methodological limitations (Pausan et al. 2019). M. smithii is the dominant methanogen in the human gastrointestinal tract, using H2 and CO2 to produce methane (CH4) (Avelar Rodriguez et al. 2019). Increased prevalence of M. smithii has been associated with higher breath CH4 levels and constipation severity (Villanueva-Millan et al. 2025). Rawson et al. reported that Methanobrevibacter was detected only in non-coeliac individuals consuming a gluten-containing diet and was not identified in either coeliac patients adhering to a gluten-free diet or non-coeliac individuals on a gluten-free diet, suggesting that dietary gluten restriction may influence archaeal detectability. However, these findings should be interpreted cautiously due to limited sample size and known methodological constraints in archaeal detection (Rawson et al. 2023). Although direct evidence in coeliac disease remains limited, findings from diarrhea-predominant inflammatory bowel diseases suggest that accelerated intestinal transit may be associated with reduced methane production, potentially due to the loss of slow-growing methanogens (Scanlan et al. 2008, Krawczyk et al. 2021, Krawczyk et al. 2023). Consistent with this, Ghavami et al. reported a significantly lower fecal load of M. smithii in inflammatory bowel disease patients compared with healthy controls (Ghavami et al. 2018). These mechanisms may partly explain the low and variable prevalence of M. smithii, observed in our study. Taking together, the low prevalence and temporal fluctuations observed in this study suggest that M. smithii may be sensitive to dietary changes; however, due to limited detection rates, these observations require cautious interpretation.
Long-term adherence to a gluten-free diet may be associated with nutritional imbalances, such as insufficient intake of complex carbohydrates and fiber and excessive consumption of fat (especially saturated fatty acids) and simple sugars (Cardo et al. 2021). Such dietary patterns may alter the availability of fermentable substrates for gut microorganisms and influence microbial metabolism (Koh et al. 2016; Myhrstad et al. 2021). In the context of the present longitudinal study, these diet-related changes may partly explain the temporal variability observed in the prevalence and abundance of selected microorganisms during follow-up.
This study has several limitations that should be considered when interpreting the results. First, the relatively small cohort size and the presence of numerous negative samples for some microorganisms limited the statistical power and precluded the use of more advanced individual-level longitudinal models. Second, quantitative analyses were restricted to positive samples, which may affect comparability between time points with low detection rates. Third, the use of targeted qPCR enabled precise quantification of selected microorganisms but did not capture the full complexity of the gut microbiome. Future studies using high-throughput sequencing approaches may provide more comprehensive insight into longitudinal microbiome dynamics. Despite these limitations, the longitudinal design of the study represents a major strength, allowing assessment of temporal changes during dietary treatment.
In conclusion, adherence to a gluten-free diet in pediatric coeliac disease was associated with time-dependent changes in selected gut microorganisms within the same patient cohort. Although Bifidobacterium spp. remained highly prevalent throughout follow-up; their abundance varied over time. In contrast, C. tropicalis prevalence differed significantly across study groups and increased during follow-up, ultimately reaching levels similar to those observed in healthy controls. Overall, these findings highlight the dynamic nature of microbial adaptation during dietary treatment rather than fixed differences between coeliac patients and healthy individuals. Gut microorganisms assessment may therefore serve as a complementary tool for understanding intestinal adaptation during dietary treatment, although its routine clinical use requires further validation.