
Table I
Demographic characteristics (overall) and body composition parameters of participants assessed at four time points.
| 1st | 2nd | 3rd | 4th | |
|---|---|---|---|---|
| Age (years) | 25.67 ± 3.98 | |||
| Gender (male/female) | 10 / 5 | |||
| Height (cm) | 169.20 ± 7.36 | |||
| Body weight (kg) | 64.90 ± 12.06 | 66.19 ± 13.19 | 67.53 ± 12.54 | 67.05 ± 11.78 |
| Body-mass index (kg/m2) | 22.62 ± 3.43 | 23.04 ± 3.71 | 23.54 ± 3.66 | 23.40 ± 3.51 |
| Skeletal muscle percentage (%) | 42.41 ± 5.00 | 41.97 ± 5.20 | 42.03 ± 5.80 | 41.55 ± 5.62 |
| Body fat percentage (%) | 23.75 ± 8.31 | 24.29 ± 8.84 | 24.45 ± 9.63 | 25.34 ± 9.58 |
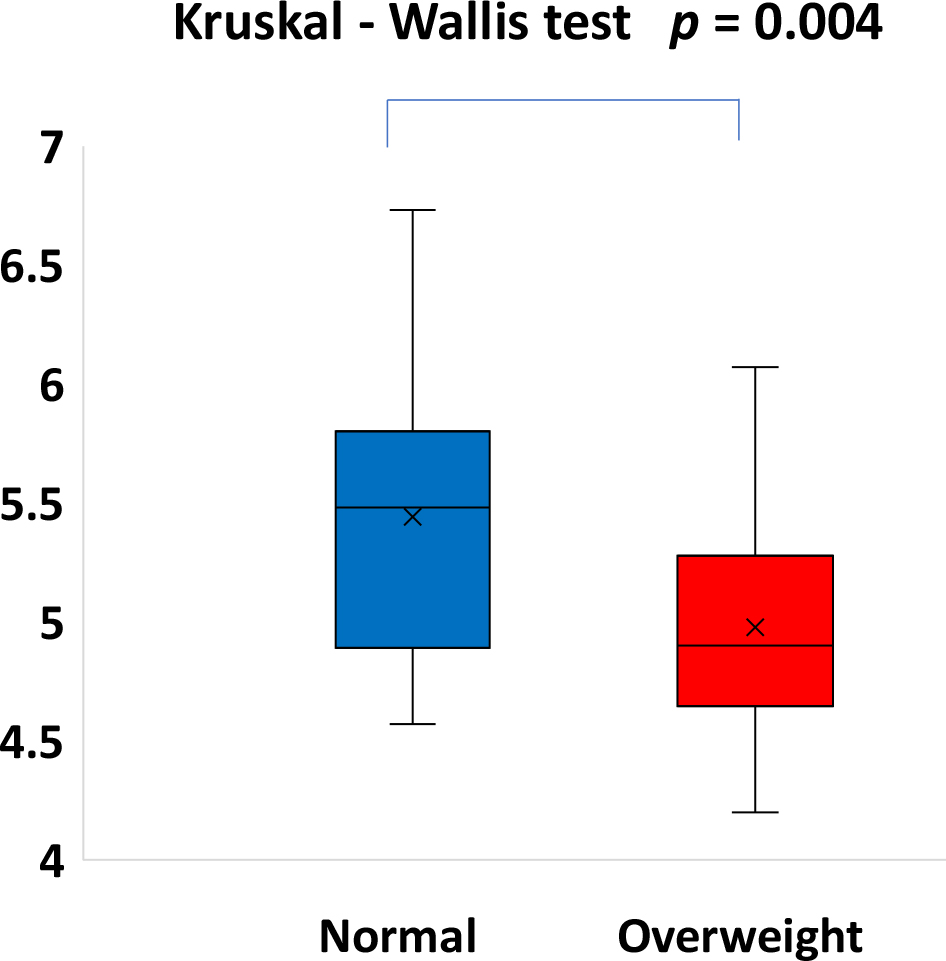
Fig. 1.
Comparison of alpha diversity between the normal and overweight groups.
Consistent with the exploratory nature of this pilot study, the analysis uses pooled data collected across all available time points from the 15 participants. The y-axis represents Shannon entropy, and differences between the two groups were assessed using the Kruskal-Wallis test. Participants were categorized based on their BMI status (< 25 kg/m2 for normal weight and ≥ 25 kg/m2 for overweight) recorded at the time of each sampling. Statistical significance was determined at a p value threshold of 0.05.
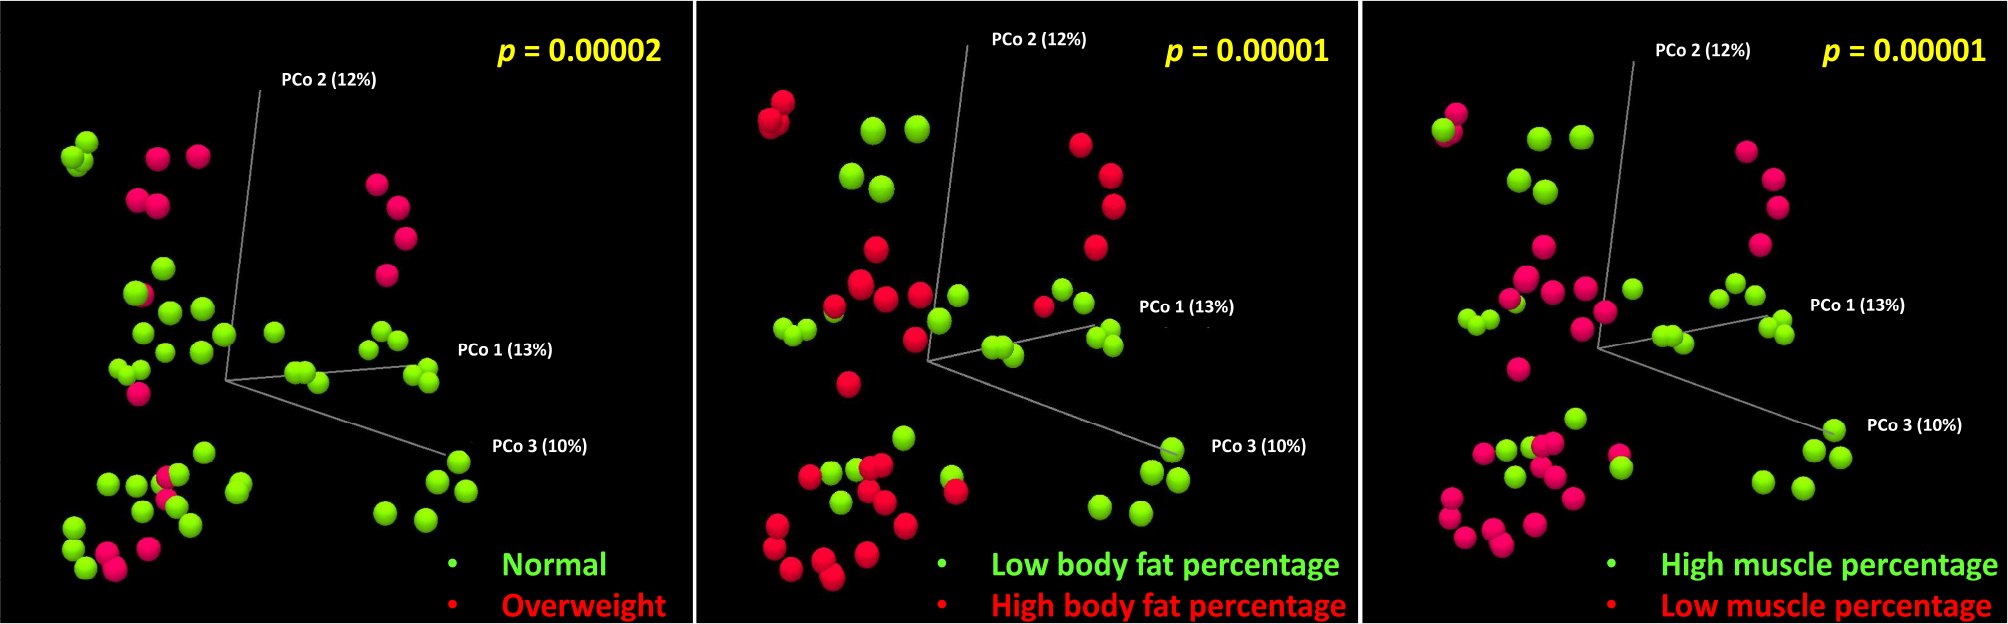
Fig. 2.
Bray-Curtis distance analysis of beta diversity among the groups.
The overall data relationship is shown for (a) normal weight vs. overweight groups, (b) low body fat percentage vs. high body fat percentage groups, and (c) high muscle percentage vs. low muscle percentage groups. Statistical significance was determined at a p-value threshold of 0.05.
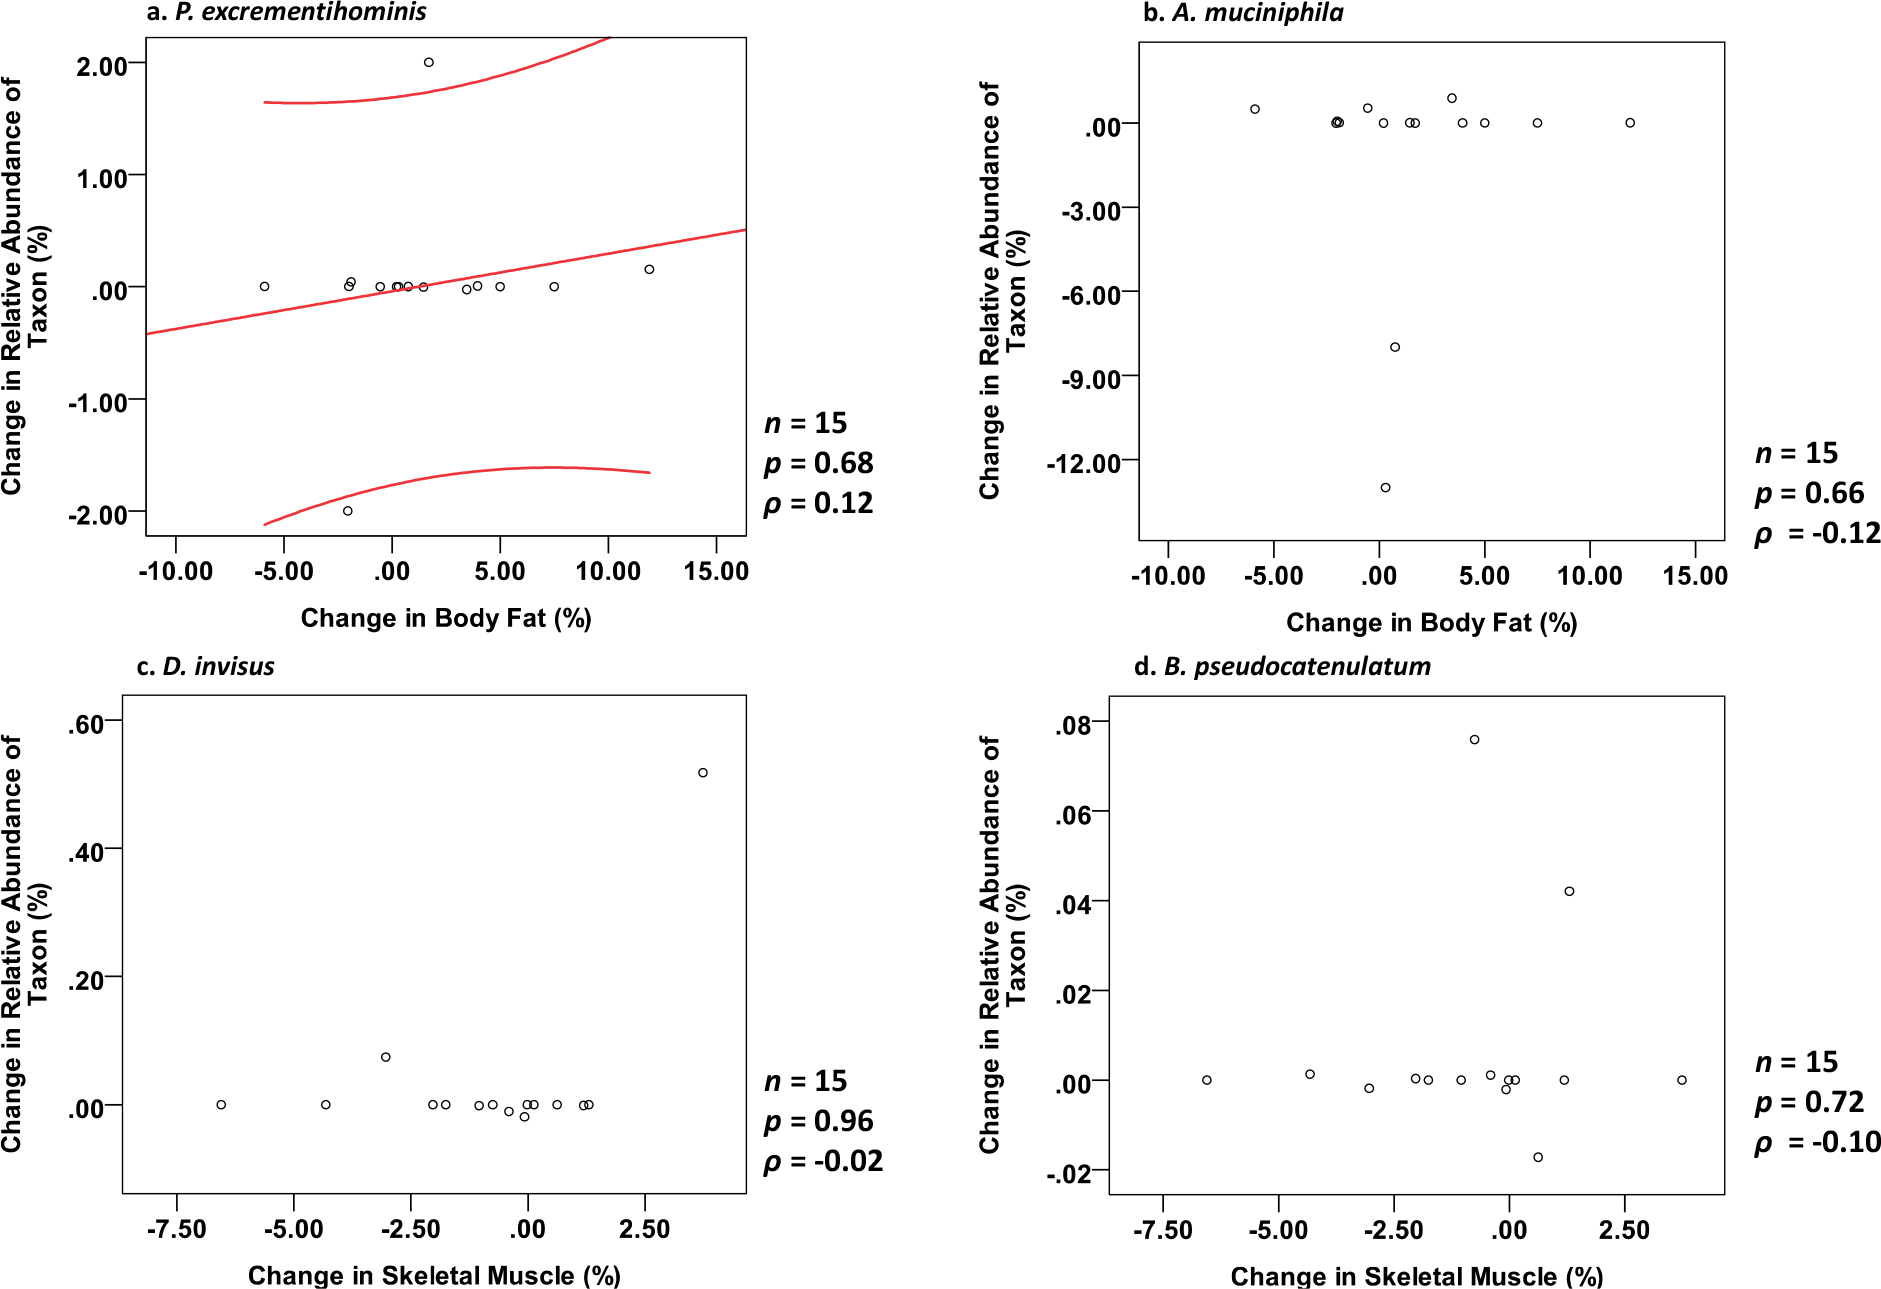
Fig. 3
Exploratory Spearman correlation analyses between within-subject changes in fecal microbial relative abundance and body composition parameters.
The scatter plots illustrate the relationship between the 9-month longitudinal change in the relative abundance of specific taxa (y-axis) and the corresponding shift in body composition parameters (x-axis). Each panel represents a sample size of n = 15. Consistent with the exploratory nature of this pilot study, all correlations remained statistically non-significant (p > 0.05). The ρ value denotes Spearman’s rank correlation coefficient. (a) P. excrementihominis vs. change in body fat percentage. The solid red line represents the linear regression, while the flanking red curves indicate the 95% confidence intervals, provided solely to visualize the potential trend observed in this taxon, (b) A. muciniphila vs. change in body fat percentage, (c) D. invisus vs. change in skeletal muscle percentage, and (d) B. pseudocatenulatum vs. change in skeletal muscle percentage. For these panels, regression lines were omitted because there was no discernible or consistent linear relationship between the variables.
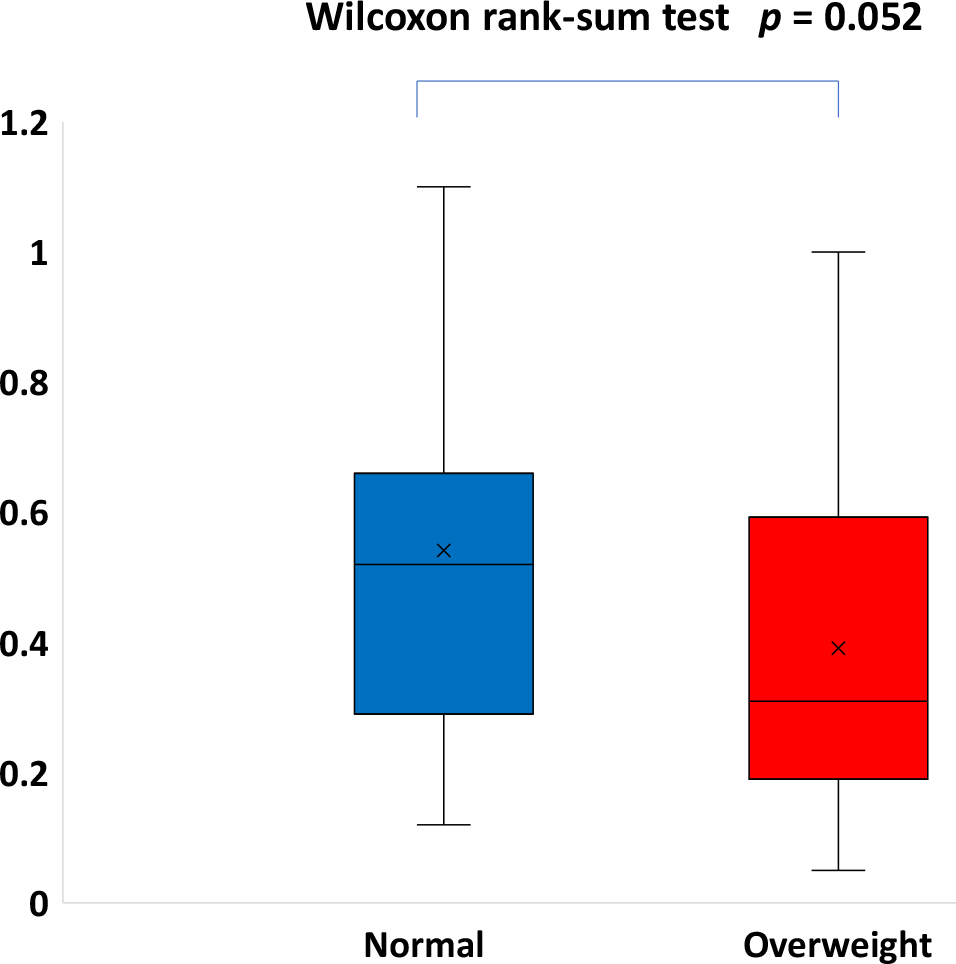
Fig. 4.
Firmicutes/Bacteroidetes (F/B) ratio between the normal and overweight groups.
Consistent with the exploratory nature of this pilot study, this analysis uses pooled data collected across all available time points from the 15 participants. The y-axis shows the F/B ratio for each measurement, with samples categorized by body weight status at each time point. Marginal statistical significance was determined using the Wilcoxon rank-sum test (p = 0.052).