
Introduction
The gut microbiome was proven to be important to human physiological functioning, including protection and immune function (Mills et al. 2019), synthesis and metabolism, and nutrition absorption (Gomaa 2020), and is even related to emotions and cognitive function (Liang et al. 2022). However, the diversity of the gut microbiome fosters the complexity of those mechanisms, and there are differences in the gut microbiome between individuals (Robles-Alonso and Guarner 2013; Ursell et al. 2012).
These inter-individual variations may be influenced by a variety of host-related factors, including body composition. The body’s composition is a vital marker for evaluating a person’s overall health. It is well-established that excessive body fat and obesity are correlated with numerous chronic diseases, including type 2 diabetes, cardiovascular diseases, stroke, malignancies, and arthritis (WHO 2000). These chronic conditions are increasingly supplanting infectious diseases as the primary threats to human health in today’s world (Maffetone et al. 2017). Moreover, muscle strength is profoundly influenced by skeletal muscle mass, which, in turn, affects motor performance and balance (Abramowitz et al. 2018). As individuals age, muscle mass can diminish by 30% to 40% compared to their younger years (Lexell et al. 1983). This reduction is particularly pronounced in sarcopenic patients, where the ratio of the limb skeletal muscle mass to body weight is frequently employed to predict the extent of functional impairment and mortality following an illness (Bijlsma et al. 2013). In recent years, gut microbiota has been extensively investigated as a critical factor closely linked to body composition.
The gut microbiome impacts skeletal muscle mass and body fat. Short-chain fatty acids (SCFAs) relate to fat synthesis and consumption (Morrison and Preston 2016), with A. muciniphila and Veillonella associated with SCFA synthesis from carbohydrates (Li et al. 2023; Scheiman et al. 2019). The Firmicutes phylum correlates with increased weight (Afzaal et al. 2022; Duranti et al. 2017), while overweight children often exhibit higher Staphylococcus aureus and lower Bifidobacterium (Kal-liomäki et al. 2008). Specifically, butyrate increases insulin sensitivity and triggers the mammalian target of rapamycin (mTOR) and AMP-activated protein kinase (AMPK) signaling, resulting in protein synthesis (Hawley 2020). Dietary unsaturated fats can increase butyrate-producing Faecalibacterium prausnitzii and Roseburia (Muralidharan et al. 2019). Furthermore, microbiome-mediated inflammation inhibition enhances muscle mass, while Proteobacteria can increase gut permeability and insulin resistance (Di Vincenzo et al. 2024), butyrate, A. muciniphila, and Bifidobacterium breve improve amino acid absorption and reduce muscle injury, promoting muscle mass (Di Vincenzo et al. 2024; Li et al. 2023).
Previous research identified certain phyla of the gut microbiome that influence body composition. However, most studies focused on specific phyletic interventions through biotics. Some cross-sectional studies found that Bacteroides, Blautia, A. muciniphi-la, Prevotella, Lactobacillus, Faecalibacterium, and Bifidobacterium were associated with better body composition, characterized by greater muscle mass and less body fat. In contrast, Firmicutes and Proteobacteria showed adverse effects (Afzaal et al. 2022; Chew et al. 2023; Di Vincenzo et al. 2024; Lustgarten 2019; Sugimura et al. 2022). Most of the existing research was either cross-sectional or involved biotic interventions, lacking long-term observations of individual subjects. Understanding the relationship between the fecal microbiome and body composition requires accounting for individual variabilities. In this study, we focused on comparing changes in body composition within the same person over time to explore the gut microbiome’s impacts.
Experimental
Materials and Methods
Study participants
This research used a repeated-measures design to investigate the relationships and simultaneous changes between body composition and the fecal microbiome. Fifteen participants were enrolled. Our inclusion criteria were (1) healthy adults aged 20 to 65 years without known metabolic, cardiovascular, or chronic gastrointestinal diseases, and (2) individuals who engaged in regular physical activity, defined as at least 150 minutes of exercise per week or exercising at least three times per week. Eligible activities included aerobic exercise (e.g., running, swimming), sports (e.g., basketball, badminton), resistance training (e.g., weightlifting), and brisk walking.
Exclusion criteria were (1) any gastrointestinal disease or hospitalization within the past month; (2) a history of long-term medication use or smoking; (3) severe neurological, or musculoskeletal disease; or (4) use of antibiotics or any treatment within the past week that may impact the fecal microbiome.
A healthy body-mass index (BMI) was defined as 18.5–24.9 kg/m2, and overweight as BMI ≥ 25 kg/m2, according to the World Health Organization (WHO) classification (WHO 2000).
All participants provided written informed consent before enrollment. The research was approved by the Taipei Medical University – Joint Institutional Review Board (IRB No.: N202201015).
Body composition
In our study, the InBody Home Use Bluetooth Smart Full Body Composition Analyzer Scale (InBody H20B; InBody Co., Ltd., Seoul, South Korea) was used as a non-invasive tool to measure the body weight, skeletal muscle mass, body fat percentage, and BMI through multi-frequency and eight-electrode technology. Skeletal muscle percentage was defined as skeletal muscle mass divided by body weight. According to the manufacturer’s manual, the InBody H20B shows a 93% correlation with dual-energy X-ray absorptiometry (DEXA), has obtained U.S. Food and Drug Administration (FDA) 510(k) clearance, and is classified as a Class II medical device, thereby supporting its validity as a tool for body composition assessment.
Research design
Fifteen healthy adults were scheduled to provide fecal and body composition samples at four time points (baseline and at approximately 3-month intervals up to 9 months). Minor deviations occurred due to scheduling constraints. Results were analyzed based on body composition patterns. The BMI, calculated as weight (kg) divided by height squared (m2), classified individuals as overweight or normal.
Median values of body weight, skeletal muscle percentage, and body fat percentage were used to categorize samples into high (≥ median) and low (< median) groups for each parameter at each time point. These time point-specific medians were used only to define group membership, whereas comparisons of fecal microbiota composition between the high and low groups were performed across all time points combined. This median-based grouping provided a balanced, distribution-free classification suitable for the small exploratory cohort and helped minimize the influence of outliers.
Fecal microbiota
Participants collected fecal samples at home using a self-administered kit. DNA was extracted from approximately 200 mg of a stool sample using the QIAamp Fast DNA Stool Mini Kit (catalog no. 51604; Qiagen, Germantown, MD, USA), following the manufacturer’s instructions. The volume of buffer was adjusted according to the stool quantity. In this study, 16S ribosomal (r)RNA gene amplification and library preparation were carried out following Illumina’s protocol [https://support.illumina.com/down-loads/l6s_metagenomic_sequencing_library_preparation.html (accessed 22 February 2022)]. The V3–V4 region of the bacterial 16S rRNA gene was amplified via a polymerase chain reaction (PCR) using the universal primers 341F (5'-CCTACGGGNGGCWGCAG-3') and 805R (5'-GACTACHVGGGTATCTAATCC-3'), incorporating Illumina overhang adapter sequences in the forward (5'-TCGTCGGCAGCGTCAGATGTG-TATAAGAGACAG-3') and reverse (5'-GTCTCGTG-GGCTCGGAGATGTGTATAAGAGACAG-3') primers. The kit protocol (Nextera XT, Illumina Inc., San Diego, CA, USA) was used to attach Illumina sequencing adapters and dual-index barcodes to the amplicon targets. The library quantity and quality were evaluated using the QSepl00 Analyzer (BiOptic, New Taipei City, Taiwan). The libraries were then normalized, pooled in equimolar concentrations, and sequenced on an Illumina MiSeq System (Hong et al. 2022).
Statistical analysis
Demographic characteristics and body composition parameters are presented as mean ± standard deviation (SD). Taxonomic classification and operational taxonomic unit (OTU) abundances were analyzed using QIAGEN CLC Genomics Workbench 23.0.3 at 99% similarity, with reference to the SILVA database (v138.1). Although results are presented at the species level for readability, these assignments represent 99% similarity OTUs rather than confirmed species, given the taxonomic resolution limits of 16S rRNA sequencing. Alpha diversity (Shannon’s entropy), beta diversity (Bray-Curtis), and Firmicutes-to-Bacteroidetes (F/B) ratios were analyzed via Kruskal-Wallis, Wilcoxon rank-sum, and Permutational Multivariate Analysis of Variance (PERMANOVA). To evaluate longitudinal and group effects while accounting for repeated measures, linear mixed models (LMM) were applied with time, group, and their interaction as fixed effects and subjects as random effects. Given the limited sample size and high inter-individual variability, no significant time × group interactions were detected. Participants were categorized into normal weight (BMI 18.5–24.9 kg/m2) and overweight (BMI ≥ 25 kg/m2) groups. Although four measurements met the WHO criteria for obesity (BMI > 30 kg/m2), they were combined with the overweight group for all statistical comparisons to maintain adequate statistical power. To better examine temporal patterns and explore potential within-subject trends, an ANOVA-like method implemented in the CLC Genomics Workbench was used in an exploratory manner. This approach compared baseline and 9-month samples to examine temporal changes in microbiota composition and was also applied to compare microbial profiles between groups stratified by body composition parameters (e.g., high vs. low body fat or skeletalmuscle percentage) at each time point. For the four representative taxa identified from this analysis, with-in-subject differences between baseline and 9 months were further examined using Wilcoxon signed-rank tests to validate their associations with body-composition changes. Although the study was longitudinal in design, the analyses were exploratory and focused on within-subject comparisons between baseline and 9-month samples rather than a full longitudinal model, given the pilot nature of the study. This approach was chosen to provide stable, interpretable results while accounting for the dataset’s repeated-measures structure. All statistical analyses were conducted using IBM SPSS Statistics (version 17.0; IBM Corp., Armonk, NY, USA) and QIAGEN CLC Genomics Workbench (version 23.0.3; QIAGEN, Aarhus, Denmark). Results were considered statistically significant if p < 0.05. Due to the study’s exploratory nature and small cohort (n = 15), nominal p-values were reported without formal multiple testing correction. This strategy was chosen to avoid inflation of type II errors, which would otherwise mask potentially meaningful biological signals. These findings should therefore be viewed as preliminary and hypothesis-generating rather than definitive, acknowledging the inherent risk of type I errors. A post-hoc power analysis was conducted based on the Wilcoxon signed-rank test statistics. To complement the group-based comparisons and address potential information loss from dichotomizing continuous variables, Spearman’s rank correlation was performed. This rank-based approach assessed associations between baseline-to-endpoint changes in microbial abundance and body composition parameters, reducing outlier influence to better characterize these longitudinal shifts. The estimated post hoc statistical power ranged from approximately 0.05 to 0.43 at α = 0.05, indicating that these analyses were exploratory and should be interpreted with caution due to the limited sample size.
Use of large language models
ChatGPT (OpenAI, USA) was used to assist in language refinement during manuscript preparation. The authors take full responsibility for the accuracy and integrity of the content.
Results
The research ran from April 2022 to September 2023, and 15 participants were recruited to analyze their fecal microbiome and body composition. The age of participants ranged from 20 to 31 years. Ten males and five females participated in the study, and all exercised at least 150 min/week. Demographic information is included in Table I.
Table I
Demographic characteristics (overall) and body composition parameters of participants assessed at four time points.
| 1st | 2nd | 3rd | 4th | |
|---|---|---|---|---|
| Age (years) | 25.67 ± 3.98 | |||
| Gender (male/female) | 10 / 5 | |||
| Height (cm) | 169.20 ± 7.36 | |||
| Body weight (kg) | 64.90 ± 12.06 | 66.19 ± 13.19 | 67.53 ± 12.54 | 67.05 ± 11.78 |
| Body-mass index (kg/m2) | 22.62 ± 3.43 | 23.04 ± 3.71 | 23.54 ± 3.66 | 23.40 ± 3.51 |
| Skeletal muscle percentage (%) | 42.41 ± 5.00 | 41.97 ± 5.20 | 42.03 ± 5.80 | 41.55 ± 5.62 |
| Body fat percentage (%) | 23.75 ± 8.31 | 24.29 ± 8.84 | 24.45 ± 9.63 | 25.34 ± 9.58 |
The body composition of subjects was measured a total of 4 times, with measurements taken at 3-month intervals. Heights ranged 158–185 cm, body weights ranged 50.9–106.9 kg, BMI ranged 17.68–33.74 kg/m2, skeletal muscle percentages ranged 31.1%–50.1%, and body fat percentages ranged 11.6%–45.1%. According to WHO criteria, a BMI ≥ 25 kg/m2 was classified as overweight. Sixteen measurements were defined as being overweight in the study.
Taxonomic comparisons were based on OTUs clustered at 99% similarity and annotated to the closest matching reference species in the SILVA v138.1 database. For readability, taxa are referred to by their representative species names throughout the Results section.
Stratifying participants by a BMI threshold of 25 kg/m2 revealed significantly lower microbiota alpha diversity in the overweight group compared to the normal weight group (p < 0.01) (Fig. 1). No significant differences in alpha diversity were found between high and low body fat or skeletal muscle groups (p = 0.3–0.7). The beta diversity analysis using principal coordinates analysis (PCoA) based on Bray-Curtis distances showed significant differences in microbiota composition across all body composition groupings, including overweight vs. normal weight, high vs. low skeletal muscle percentage, and high vs. low body fat (PERMANOVA, p < 0.01) (Fig. 2).
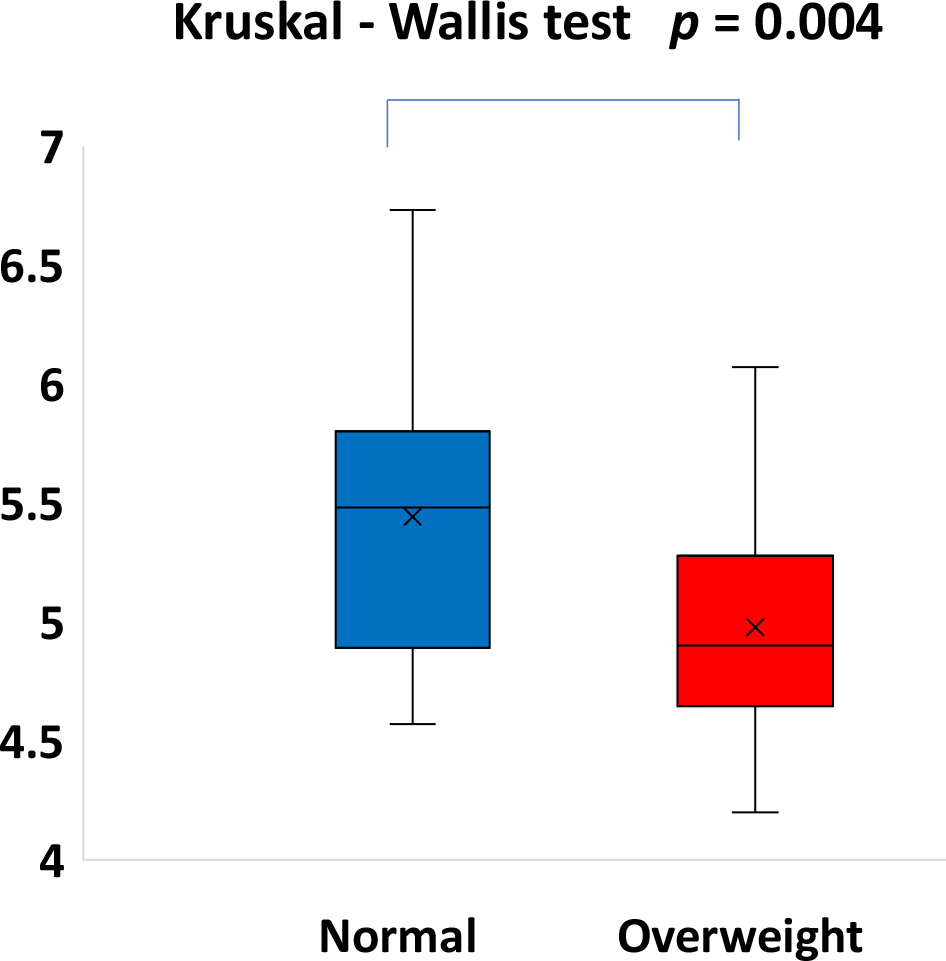
Fig. 1.
Comparison of alpha diversity between the normal and overweight groups.
Consistent with the exploratory nature of this pilot study, the analysis uses pooled data collected across all available time points from the 15 participants. The y-axis represents Shannon entropy, and differences between the two groups were assessed using the Kruskal-Wallis test. Participants were categorized based on their BMI status (< 25 kg/m2 for normal weight and ≥ 25 kg/m2 for overweight) recorded at the time of each sampling. Statistical significance was determined at a p value threshold of 0.05.
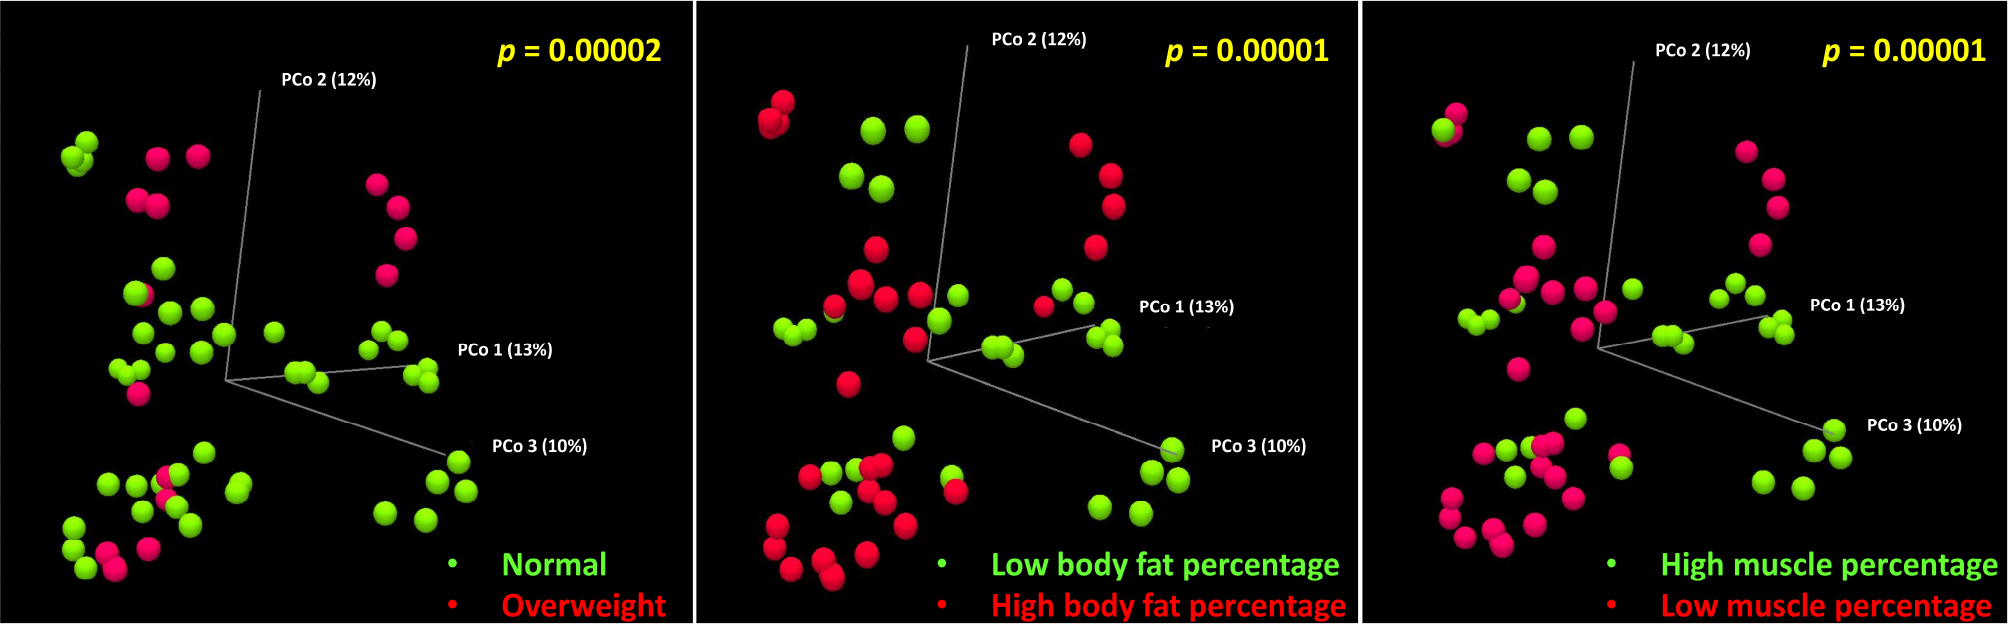
Fig. 2.
Bray-Curtis distance analysis of beta diversity among the groups.
The overall data relationship is shown for (a) normal weight vs. overweight groups, (b) low body fat percentage vs. high body fat percentage groups, and (c) high muscle percentage vs. low muscle percentage groups. Statistical significance was determined at a p-value threshold of 0.05.
A total of 16 measurement points (not necessarily from distinct participants), each corresponding to a BMI value ≥ 25 kg/m2 across the four sampling time points, were classified as overweight.
LMM analyses incorporating time, group, and their interaction were first performed to account for repeated measures. Analyses of 139 core taxa (prevalence > 20%) revealed overall stability, with most taxa showing no significant time × group interactions (Supplementary Tables SI, SII), likely reflecting the small sample size and inter-individual variability. While Bifidobacterium adolescentis reached significance in the LMM (p = 0.04), it was excluded from primary discussion due to non-significant baseline-to-9-month changes in stratified analyses. Therefore, exploratory analyses using a stratified baseline-to-endpoint approach were conducted to visualize potential trends in microbiota related to body composition changes.
At the final measurement, nine participants showed an increase in the body fat percentage and BMI, while the remaining six exhibited a decrease. Similarly, the skeletal muscle percentage decreased in 10 participants, while it increased in the other five. After comparing different body compositions and their changes over time, several putative fecal microbial species were observed that showed consistent trends in relation to both the body composition and its changes.
In participants with an increased body fat percentage, the OTU annotated as Parasutterella excrementihominis showed a within-subject increase in abundance between baseline and 9 months, as supported by the Wilcoxon signed-rank test (Z = –0.94, p = 0.35, r = 0.39), indicating a medium effect. Conversely, in participants with lower body fat percentage, the abundance of this species declined over the same interval (Z = –0.36, p = 0.72, r = 0.18), indicating a small effect. While Spearman’s rank correlation analysis between changes in microbial abundance and body fat percentage showed only a weak association (p = 0.68, ρ = 0.12), the directional consistency observed here remains a preliminary observation and should be interpreted with caution, as it lacks robust statistical significance in this small cohort (Fig. 3a).
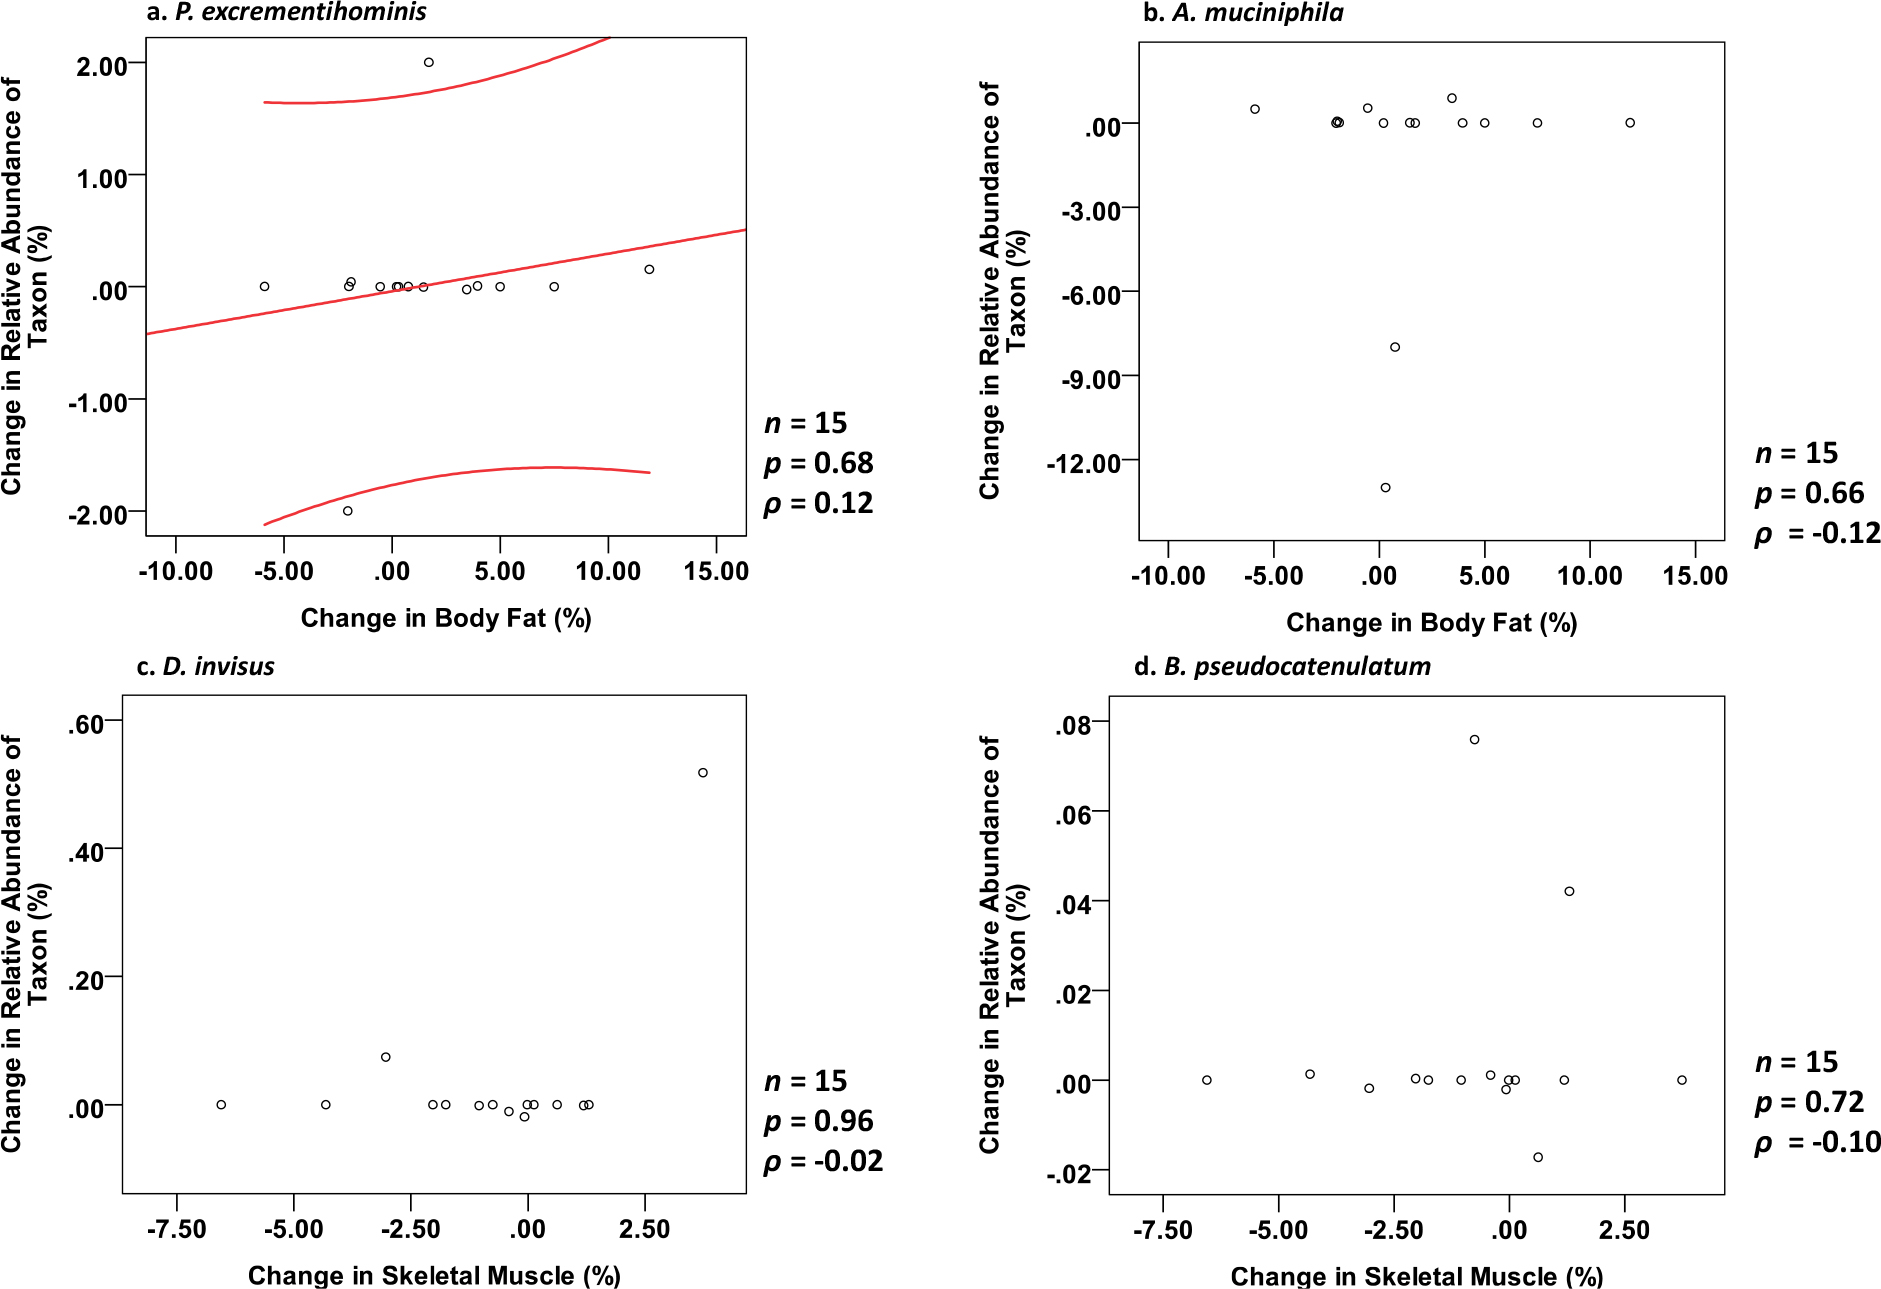
Fig. 3
Exploratory Spearman correlation analyses between within-subject changes in fecal microbial relative abundance and body composition parameters.
The scatter plots illustrate the relationship between the 9-month longitudinal change in the relative abundance of specific taxa (y-axis) and the corresponding shift in body composition parameters (x-axis). Each panel represents a sample size of n = 15. Consistent with the exploratory nature of this pilot study, all correlations remained statistically non-significant (p > 0.05). The ρ value denotes Spearman’s rank correlation coefficient. (a) P. excrementihominis vs. change in body fat percentage. The solid red line represents the linear regression, while the flanking red curves indicate the 95% confidence intervals, provided solely to visualize the potential trend observed in this taxon, (b) A. muciniphila vs. change in body fat percentage, (c) D. invisus vs. change in skeletal muscle percentage, and (d) B. pseudocatenulatum vs. change in skeletal muscle percentage. For these panels, regression lines were omitted because there was no discernible or consistent linear relationship between the variables.
The sequences assigned to A. muciniphila showed higher relative abundance in participants with lower body fat percentage. Additionally, in participants with increased body fat, the abundance of this species decreased at 9 months compared with baseline, as supported by the Wilcoxon signed-rank test (Z = –1.40, p = 0.16, r = 0.50), indicating a medium-to-large effect size. However, Spearman’s rank analysis showed only a weak and non-significant inverse relationship between the changes in A. muciniphila and body fat (p = 0.66, ρ = –0.12). This discrepancy suggests that while a potential trend may exist, it should be regarded strictly as a preliminary observation and interpreted with caution, particularly given the small sample size (Fig. 3b).
The OTU representative of Dialister invisus showed a higher relative abundance in participants with greater skeletal muscle mass, and the ANOVA-like model indicated a significant overall trend across the baseline and 9-month assessments. However, the paired comparison within individuals did not reach statistical significance (Z = 0.00, p = 1.00, r = 0.00). Consistent with this, Spearman’s rank analysis showed virtually no linear relationship between the changes in D. invisus and skeletal muscle percentage (p = 0.96, ρ = –0.02). The lack of consistency between group-level trends and individual longitudinal shifts suggests that the observed differences may primarily reflect baseline variations or overall temporal patterns rather than meaningful with-in-individual changes (Fig. 3c).
Conversely, participants with a lower muscle proportion had a higher relative abundance of the sequences assigned to Bifidobacterium pseudocatenu-latum. In addition, this putative species showed a 9-month increase compared with baseline among participants whose muscle proportion had decreased, as supported by the Wilcoxon signed-rank test (Z = 0.94, p = 0.35, r = 0.42), indicating a medium effect size. However, this trend was less evident in the continuous analysis; Spearman’s rank correlation showed only a weak and non-significant inverse relationship between the changes in B. pseudocatenulatum and muscle percentage (p = 0.72, ρ = -0.10). This weak correspondence suggests that while a potential trend may exist, it should be regarded as a preliminary observation and interpreted with caution (Fig. 3d).
To clarify potential sex-specific differences in fecal microbiota changes associated with body composition, we performed sex-stratified analyses. We found that a significant change in the OTU assigned as B. pseudoca-tenulatum (p = 0.01) was predominantly observed in females with decreased skeletal muscle mass. In contrast, significant alterations in putative D. invisus (p = 0.01) and P. excrementihominis (p < 0.01), associated with changes in body fat, were primarily observed in males.
Prior research suggested that the Firmic-utes-to-Bacteroidetes (F/B) ratio may be associated with obesity. In this study, the F/B ratio was calculated for each sample as the relative abundance of Firmicutes divided by that of Bacteroidetes, and the mean ratio was reported for each group. The mean F/B ratio was 0.39 in the overweight group and 0.54 in the normal-weight group (Fig. 4). The difference between the two groups reached marginal statistical significance (p = 0.052).
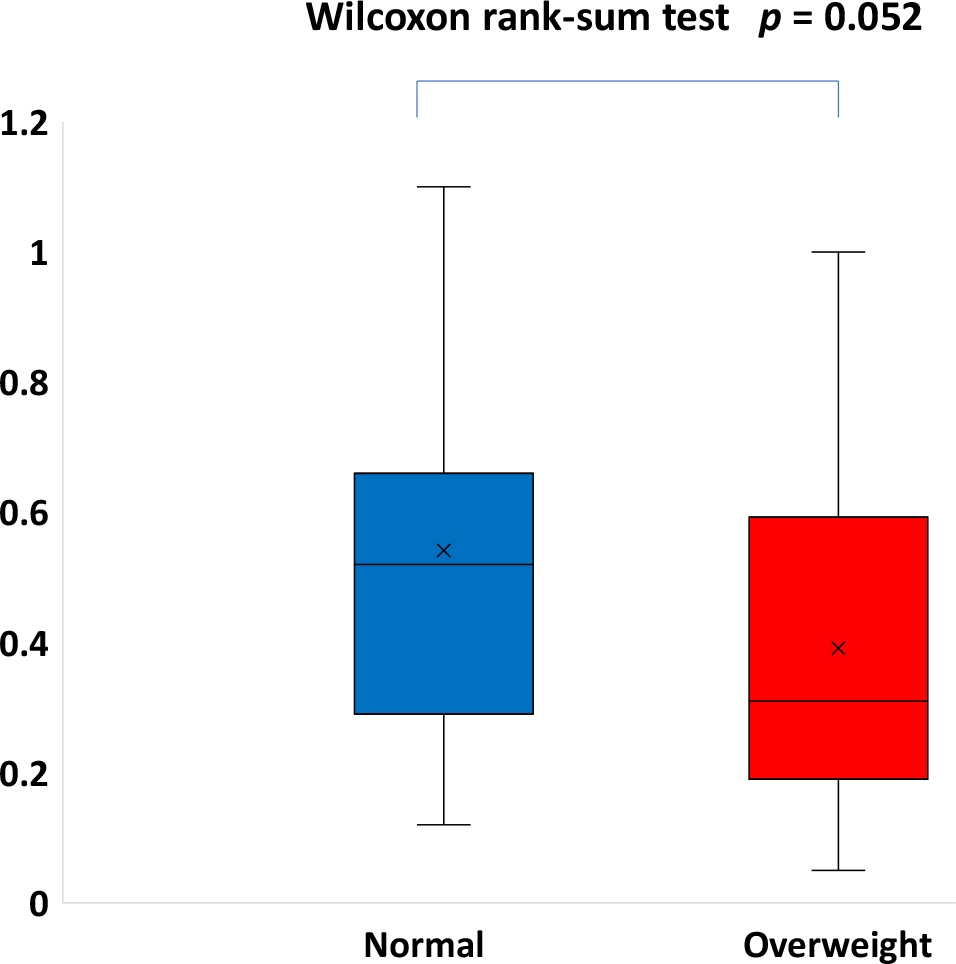
Fig. 4.
Firmicutes/Bacteroidetes (F/B) ratio between the normal and overweight groups.
Consistent with the exploratory nature of this pilot study, this analysis uses pooled data collected across all available time points from the 15 participants. The y-axis shows the F/B ratio for each measurement, with samples categorized by body weight status at each time point. Marginal statistical significance was determined using the Wilcoxon rank-sum test (p = 0.052).
Discussion
Previous studies on the relationship between body composition and fecal microbiota have largely examined probiotic use, dietary interventions, or prescribed health programs. In contrast, this study investigated microbiota-body composition associations under natural lifestyle conditions and further tracked individuals over time. By classifying microbiota shifts according to longitudinal changes in body composition, we aimed to identify representative taxa potentially linked to body composition dynamics.
While most previous studies suggested that individuals with obesity exhibit lower gut microbiota diversity compared to the general population, a systematic review indicated that this trend was not statistically significant, which warrants further investigation (Pinart et al. 2022). Part of the results of this study aligned with our hypothesis, showing that the overweight group exhibited lower microbiota diversity compared to individuals with a normal weight, supporting the findings of most prior research. However, no clear trends were observed between groups with high and low body fat percentages or skeletal muscle percentages. The beta diversity analysis similarly demonstrated significant inter-sample biodiversity differences in the fecal microbiota among individuals with distinct body composition characteristics. This suggests that future studies should include a larger sample size and more-appropriate cutoff points for group classifications to further validate this hypothesis.
An optimal body composition is characterized by lower body fat, higher muscle mass, and a moderately maintained BMI. In this study, we observed that individuals with a greater muscle percentage tended to have higher abundances of the OTU representative of D. invisus, whereas lower body fat was associated with putative A. muciniphila, a bacterium known for its role in maintaining gut barrier integrity and metabolic health.
In our study, the taxon annotated as D. invisus showed a significantly higher abundance in participants with higher skeletal muscle percentage, whereas its within-subject temporal variation remained unclear. Consistent with this, Spearman’s rank analysis revealed virtually no linear relationship between changes in D. invisus and muscle percentage, suggesting that the observed link might be driven more by baseline differences between individuals rather than longitudinal shifts. This may be related to its role as a mediator of inflammatory responses in individuals with specific dietary habits (Shi et al. 2022). Additionally, D. invis-us was observed to decrease in patients with various autoimmune and inflammatory diseases, suggesting a potential role in reducing inflammatory responses (Joossens et al. 2011; Lee et al. 2019). A reduction in inflammation could support muscle synthesis, thereby influencing the body composition of participants.
Previous research showed a positive correlation between Parasutterella sp. and BMI, with a significant reduction in P. excrementihominis observed following a 12-week low-calorie, low-carbohydrate weight-loss intervention (Henneke et al. 2022). Our study further explored the relationship between the OTU assigned to P. excrementihominis and body composition, focusing on body fat percentage, and similarly supported the positive association between these putative species and being overweight or obese. Although the linear correlation was weak, the consistent directional trend across different statistical approaches strengthens the possibility of this link. Since SCFAs may have an inhibitory effect on fatty acid synthesis (He et al. 2020), and Parasutterella sp. and P. excrementihominis produce fewer SCFAs (Nagai et al. 2009), a higher relative abundance of this bacterium may promote fatty acid synthesis, potentially leading to an increased body fat percentage or body weight.
B. pseudocatenulatum has traditionally been regarded as an important probiotic in the gut, with benefits including restoration of the gut barrier function, reduction of inflammation, improvement of lipid profiles, and enhancement of insulin receptor sensitivity (Cano et al. 2013; Mauricio et al. 2017; Moya-Pérez et al. 2015; Sanchis-Chordà et al. 2019). However, in this study, an opposite trend was observed: the proportion of sequences representative of B. pseudocatenulatum increased as the muscle mass percentage decreased. Notably, while this association remained consistent in the continuous analysis, it was not supported by a strong linear correlation, suggesting that the observed trend may be highly variable among individuals in this small cohort. Most previous studies explored the relationship between representative taxon and related markers through animal models or interventional supplementation of B. pseudocatenulatum, whereas our study examined changes in the body composition and fecal microbiota under a natural diet and living conditions. The lack of a robust linear link indicates that this unexpected finding remains a preliminary observation. Whether this difference in study context accounts for the contrasting trends remains to be clarified through further research.
Another extensively studied probiotic, A. muciniph-ila, was similarly observed to have beneficial associations in this study. Previous animal studies showed that 4 weeks of supplementation with A. muciniphila improved muscle strength in mice with muscle atrophy, potentially through its influence on the ubiquitin-pro-teasome pathway (Byeon et al. 2022). Moreover, A. muciniphila has been reported to exhibit anti-inflammatory properties, enhance gut barrier function, and promote SCFA production, all of which contribute to improved health and body composition (Abuqwider et al. 2021; Depommier et al. 2019; Naito et al. 2018). This study also observed an increase in A. muciniphila in individuals with lower body fat or during periods of fat loss. While the continuous analysis using Spearman’s rank correlation showed only a weak inverse relationship between changes in A. muciniphila and body fat percentage, the direction of the trend remained consistent with our categorical findings. This discrepancy suggests that while a potential trend may exist, it should be regarded strictly as a preliminary observation and interpreted with caution. The significance of this bacterium in relation to body fat and muscle mass warrants further research to explore its quantitative and qualitative impacts, providing evidence for its potential use in exercise health or therapeutic interventions.
The sex-specific associations between fecal microbiota and body composition may reflect underlying hormonal, metabolic, and immune differences between males and females (Mayneris-Perxachs et al. 2020). Estrogen, for instance, affects gut permeability and systemic metabolism, potentially influencing microbiota-host interactions (Santos-Marcos et al. 2023). In our study, changes in B. pseudocatenulatum were observed in females with reduced muscle mass, whereas taxa such as Dialister and Parasutterella were linked to changes in fat in males. Although the causal role of these microbes remains unclear, previous studies suggested that bile acid metabolism and sex hormones may mediate such differences, and that microbial associations with body composition can be sex-specific (Park et al. 2022). These findings require further validation and mechanistic investigation.
Previous systematic reviews pointed out that the Firmicutes-to-Bacteroidetes ratio is typically higher in obese individuals (Pinart et al. 2022). However, this study observed an opposite trend. This discrepancy may be attributed to the small sample size of this study and to the fact that participants were selected based on engaging in at least 150 minutes of exercise per week, a characteristic that differs from those of the sample populations used in previous studies. Future research on the relationship between the fecal microbiota and body composition should take participant characteristics into account.
One limitation of this study is its relatively small sample size, which reflects the inherent inter-individual variability in the fecal microbiota and the challenges of longitudinal sampling. To better explore microbiota distribution patterns, we not only compared differences between individuals but also performed within-subject analyses before and after changes in body composition. Nevertheless, the post-hoc power analysis based on the Wilcoxon signed-rank test indicated limited statistical power (0.05–0.43 at α = 0.05), suggesting that the findings should be interpreted as exploratory. Despite this limitation, the longitudinal repeated-measures design may have helped reduce inter-individual variability and provided preliminary effect-size estimates to guide adequately powered future studies. Additionally, this study did not define clear cutoff points for certain body composition parameters, such as muscle mass and body fat percentage. Dietary intake and exercise levels were not recorded, as the study aimed to observe fecal microbiota and body composition under participants’ natural, real-world lifestyle conditions. This design allows for the capture of spontaneous variation and enhances ecological validity, though it introduces potential confounding effects from diet and physical activity. The gut microbiome is highly responsive to dietary fiber and caloric intake, which are known to modulate the abundance of key taxa identified in this study, such as Dialister spp. and P. excrementihominis (Ghosh et al. 2020). Similarly, the abundance of A. mu-ciniphila is closely linked to both dietary quality and host adiposity (Asnicar et al. 2021). Without detailed dietary logs, we cannot definitively determine whether the observed microbial shifts were solely related to changes in body composition or were partly driven by unrecorded dietary fluctuations. Previous studies have demonstrated that physical activities, particularly moderate-intensity continuous training, can lead to an increase in the abundance of A. muciniphila, Bifidobacterium spp., and Dialister spp. in various populations (Clarke et al. 2014; Kim et al. 2025; Torquati et al. 2023), highlighting the critical role of exercise in gut microbiome modulation. We acknowledge that this lack of control for major determinants of the microbiota limits the internal validity of our findings. Therefore, our results should be interpreted as associations rather than direct causal links. Future research could establish individualized cutoff points and incorporate standardized dietary assessments alongside objective physical activity monitoring (e.g., using accelerometers or wearable devices) to enable more precise analyses and isolate the effects of lifestyle variance from physiological adaptations.
In conclusion, this pilot study provided preliminary observations indicating that temporal shifts in the fecal microbiota may be associated with changes in body composition in a small, single-region cohort. Trends such as higher relative abundance of putative D. invisus in participants with greater skeletal muscle mass must be interpreted with extreme caution. These patterns remained strictly exploratory, particularly as they lacked robust statistical significance in continuous correlation models and required confirmation in larger and more diverse populations. While the directional consistency across different statistical approaches hints at potential longitudinal links, these observations remain preliminary and hypothesis-generating. Future multi-center studies with sufficient statistical power are essential to validate and extend these findings.
Acknowledgments
This study was supported by the Ministry of Science and Technology (MOST), Taiwan, through the College Student Research Scholarship (no. 112-2813-C-038-153-B).
The authors would like to acknowledge the technological and analytical support provided by the Core Laboratory of Human Microbiome at Taipei Medical University.
Notes
[2] Contributed by Conflict of interest
The authors do not report any financial or personal connections with other persons or organizations, which might negatively affect the contents of this publication and/or claim authorship rights to this publication.