
Fig. 1.
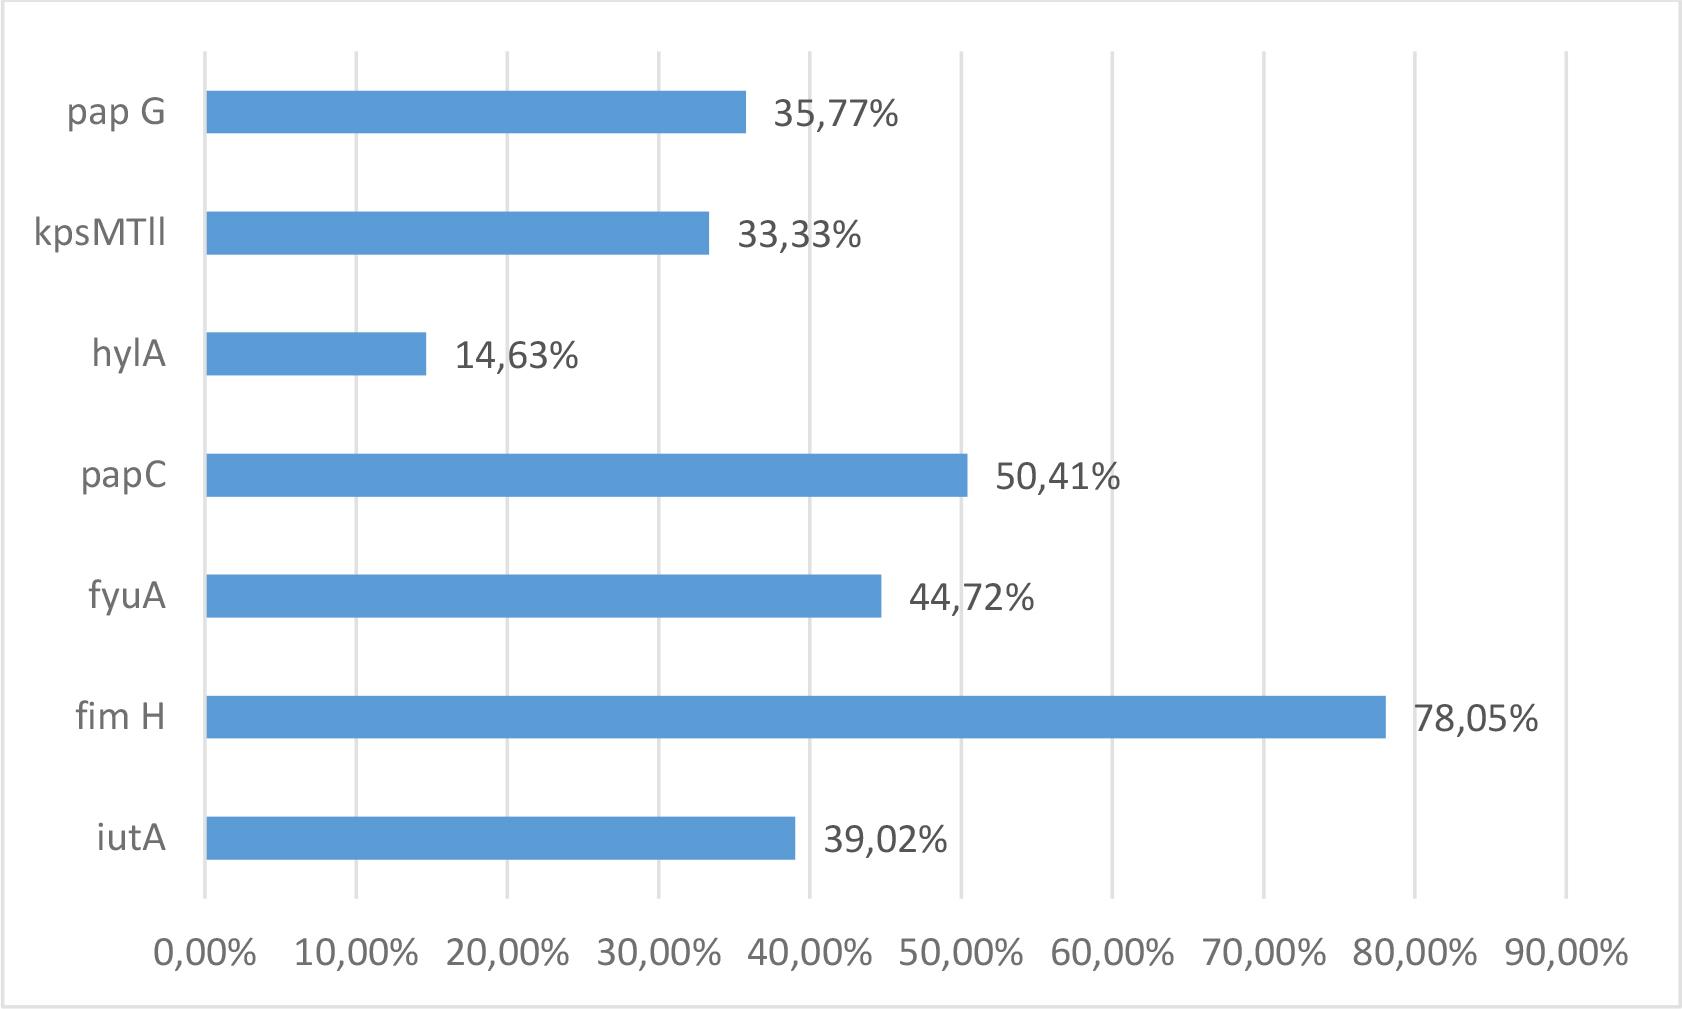
Fig. 2.
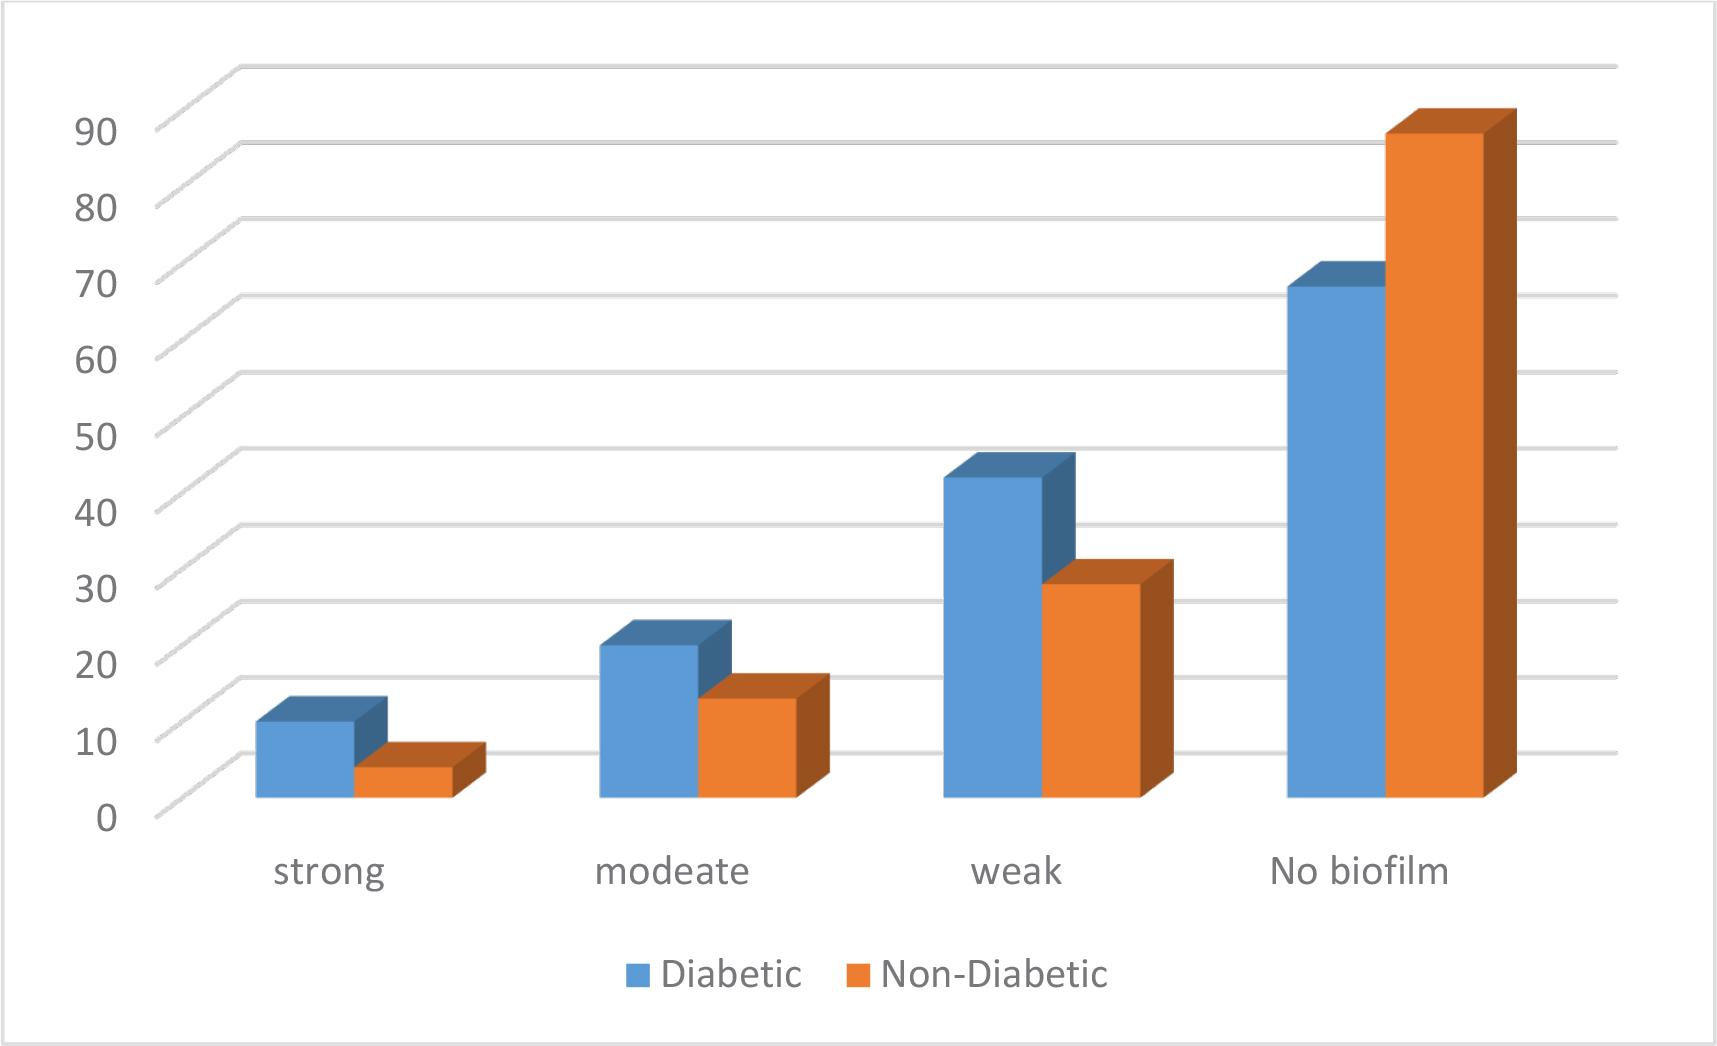
Fig. 3.
List of Risk Factors associated with CAUTI
| Variables | Number | Percentage (%) | p-Value |
|---|---|---|---|
| Hospital ward | |||
| Medical ward | 104 | 40.0 | 0.0035 |
| Surgical ward | 67 | 25.8 | |
| Emergency | 39 | 15.0 | |
| Gynecology | 30 | 11.5 | |
| Intensive care unit | 20 | 7.7 | |
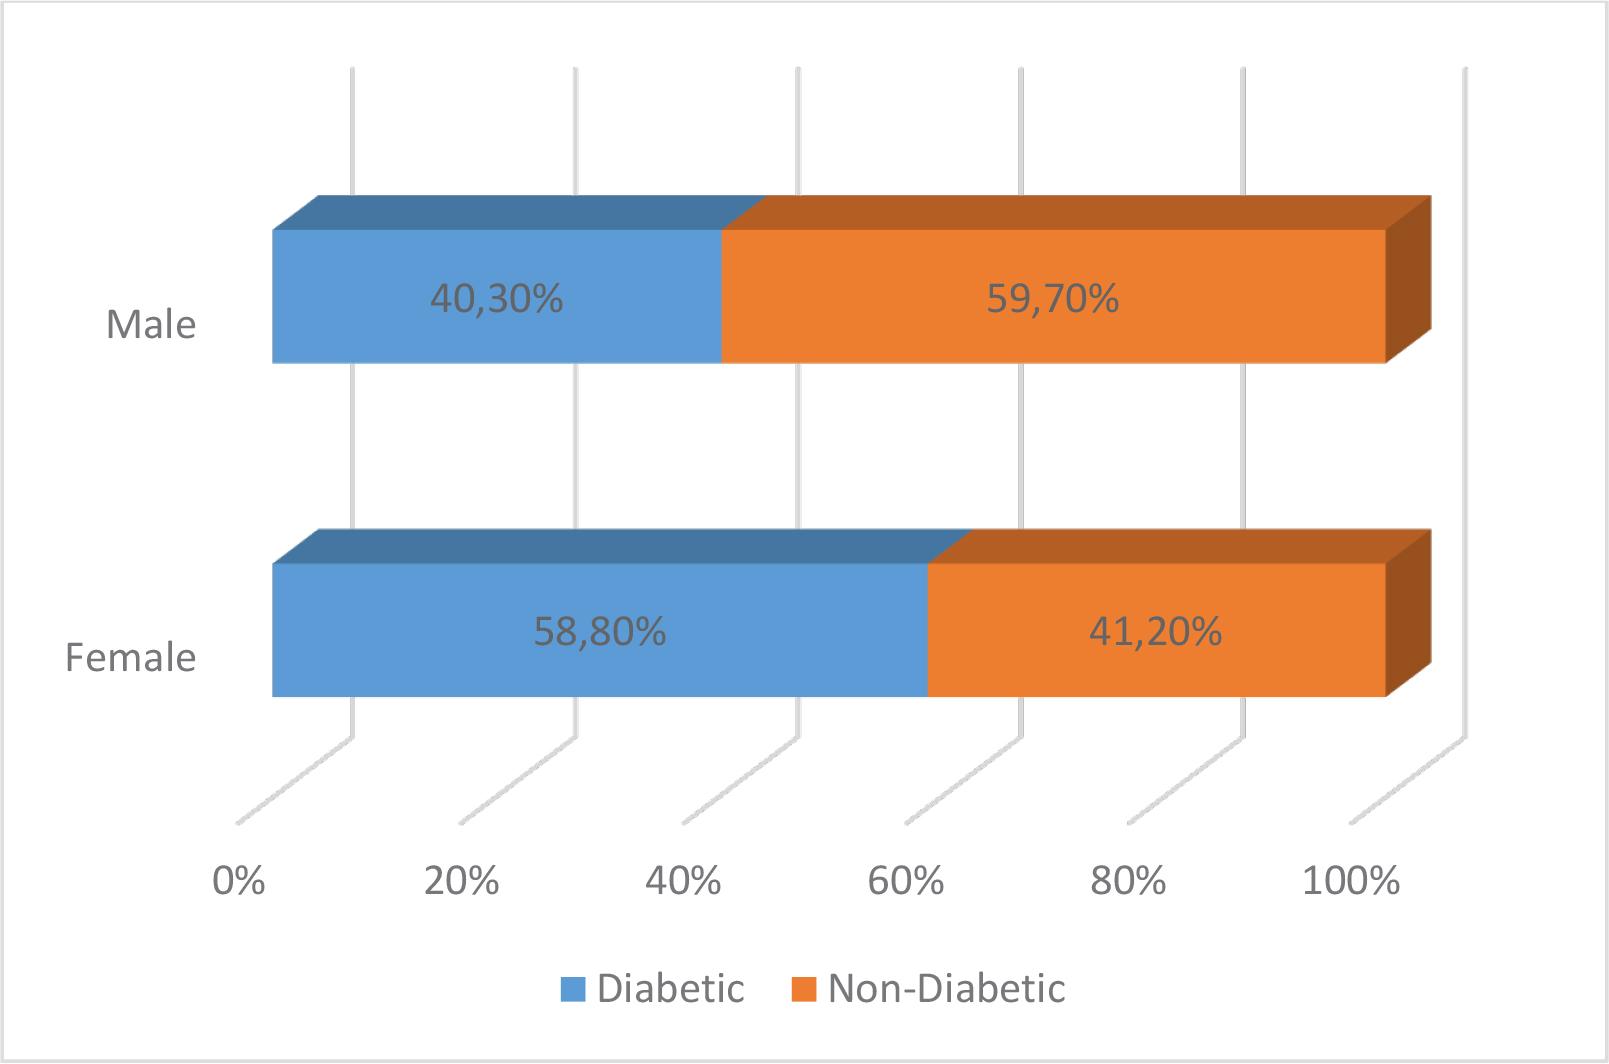
| Gender | |||
| Female | 136 | 52.3 | <0.00001 |
| Male | 124 | 47.7 | |
| Diabetic status | |||
| Diabetic | 130 | 50.0 | <0.0001 |
| Non-diabetic | 130 | 50.0 | |
| Duration of hospital stay (Days) | |||
| 1 (0-3 Days) | 26 | 10.0 | 0.718 |
| 2 (4-6 days) | 174 | 66.9 | |
| 3 (7-9 Days) | 40 | 15.4 | |
| 4 (10 or Greater) | 20 | 7.7 | |
| Duration of catheterization (Days) | |||
| 1 (0-3 Days) | 149 | 57.3 | 0.533 |
| 2 (4-6 days) | 68 | 26.2 | |
| 3 (7-9 Days) | 29 | 11.2 | |
| 4 (10 or Greater) | 14 | 5.4 | |
| Types of catheters | |||
| Latex | 157 | 60.4 | 0.002 |
| Silicon | 87 | 33.5 | |
| Anti-microbial | 16 | 6.2 | |
| Urine drainage in hours | |||
| 10 h | 25 | 9.5 | 0.959 |
| 12 h | 71 | 26.9 | |
| 24 h | 164 | 62.1 | |
| Prior use of antibiotics | |||
| Ceftriaxone | 242 | 93.1 | 0.137 |
| Meropenem | 18 | 6.9 | |
| Biofilm microplate | |||
| No biofilm | 154 | 59.20 | 0.001 |
| Weak | 59 | 22.60 | |
| Moderate | 33 | 12.60 | |
| Strong | 14 | 5.38 | |
| Microorganisms | |||
| E. coli | 123.0 | 67.2 | 0.001 |
| Klebsiella pneumoniae | 28.0 | 15.3 | |
| Pseudomonas aeruginosa | 15.0 | 8.1 | |
| Enterococcus spp. | 10.0 | 5.4 | |
| Proteus Spp. | 7.0 | 3.8 | |
MIC distribution in CAUTI associated Escherichia coli isolates
| Antibiotics | Number of isolates with MIC (μg/ml) | |||||||||||
|---|---|---|---|---|---|---|---|---|---|---|---|---|
| ≤ 0.125 | 0.25 | 0.5 | 1 | 2 | 4 | 8 | 16 | 32 | 64 | 128 | ≥256 | |
| Cefotaxime | NT | NT | - | - | - | 39 | 30 | 26 | 12 | 9 | 5 | 2 |
| Ceftriaxone | NT | NT | - | - | - | 40 | 27 | 21 | 16 | 10 | 8 | 1 |
| Imipenem | NT | NT | 36 | 27 | 7 | 9 | 14 | 8 | 19 | 1 | 1 | 1 |
| Meropenem | NT | NT | 34 | 31 | 10 | 14 | 10 | 8 | 12 | 2 | 1 | 1 |
| Amikacin | NT | NT | 9 | 8 | 19 | 6 | 6 | 25 | 15 | 20 | 13 | 3 |
| Gentamicin | NT | NT | 17 | 12 | 9 | 5 | 24 | 18 | 10 | 6 | 22 | - |
| Doxycycline | NT | NT | 25 | 13 | 9 | 5 | 0 | 15 | 20 | 30 | 5 | 1 |
| Ciprofloxacin | 15 | 10 | - | 25 | 16 | 10 | 18 | 5 | 15 | 9 | NT | NT |
| Colistin | 12 | 38 | 52 | 21 | - | - | - | - | - | - | NT | NT |
| Tigecycline | 28 | 44 | 35 | 16 | - | - | - | - | - | - | NT | NT |
Comparison of antimicrobial resistance pattern in E_ coli CAUTI isolates from diabetic versus non-diabetic patients_
| Antibiotic | Diabetic (n = 78) | Non-diabetic (n = 45) | Total (n = 123) | p-Value |
|---|---|---|---|---|
| Amoxicillin-clavulanic acid | 69 (88.4%) | 19 (42.2%) | 88 (71.5%) | <0.001* |
| Cefotaxime | 78 (100%) | 45 (100%) | 123 (100%) | - |
| Ceftriaxone | 78 (100%) | 45 (100%) | 123 (100%) | - |
| Imipenem | 46 (58.9%) | 7 (15.5%) | 53 (43.0%) | <0.001* |
| Meropenem | 42 (53.8%) | 6 (13.3%) | 48 (39.0 %) | <0.001* |
| Amikacin | 56 (71.7%) | 20 (44.4%) | 76 (61.7%) | 0.004 |
| Gentamicin | 61 (78.2%) | 19 (42.2%) | 80 (65.0%) | <0.001* |
| Ciprofloxacin | 65 (83.3%) | 33 (73.3%) | 98 (79.6%) | 0.191 |
| Levofloxacin | 68 (87.1%) | 35 (77.7%) | 103 (83.7%) | 0.231 |
| Tri-methoprim sulphamethoxazole | 59 (75.6%) | 27 (60.0%) | 86 (69.9%) | 0.091 |
| Nitrofurantoin | 9 (11.5%) | 4 (8.8%) | 13 (10.5%) | 0.742 |
| Doxycycline | 56 (71.7%) | 15 (33.3%) | 71 (57.7%) | <0.001* |
| Colistin | 0 | 0 | 0 | - |
| Tigecycline | 0 | 0 | 0 | - |
Association in Between Biofilm and the Presence of Virulence Genes in Escherichia coli CAUTI isolates
| Virulence Genes | Positive biofilm (n = 67) | Negative biofilm (n = 56) | p-Value |
|---|---|---|---|
| Fim-H | 67 (100.0%) | 29 (51.7%) | 0.0001 |
| Pap-C | 45 (67.1%) | 17 (30.3%) | 0.0002 |
| Fyu-A | 42 (62.6%) | 13 (23.2%) | 0.0001 |
| Hyl-A | 11 (16.4%) | 7 (12.5%) | 0.5274 |
| lut-A | 29 (43.2%) | 19 (33.9%) | 0.34 |
| KpsMTII | 30 (44.7%) | 11(19.6%) | 0.0001 |
| Pap-G | 35 (52.2%) | 9 (16.0%) | 0.0001 |