
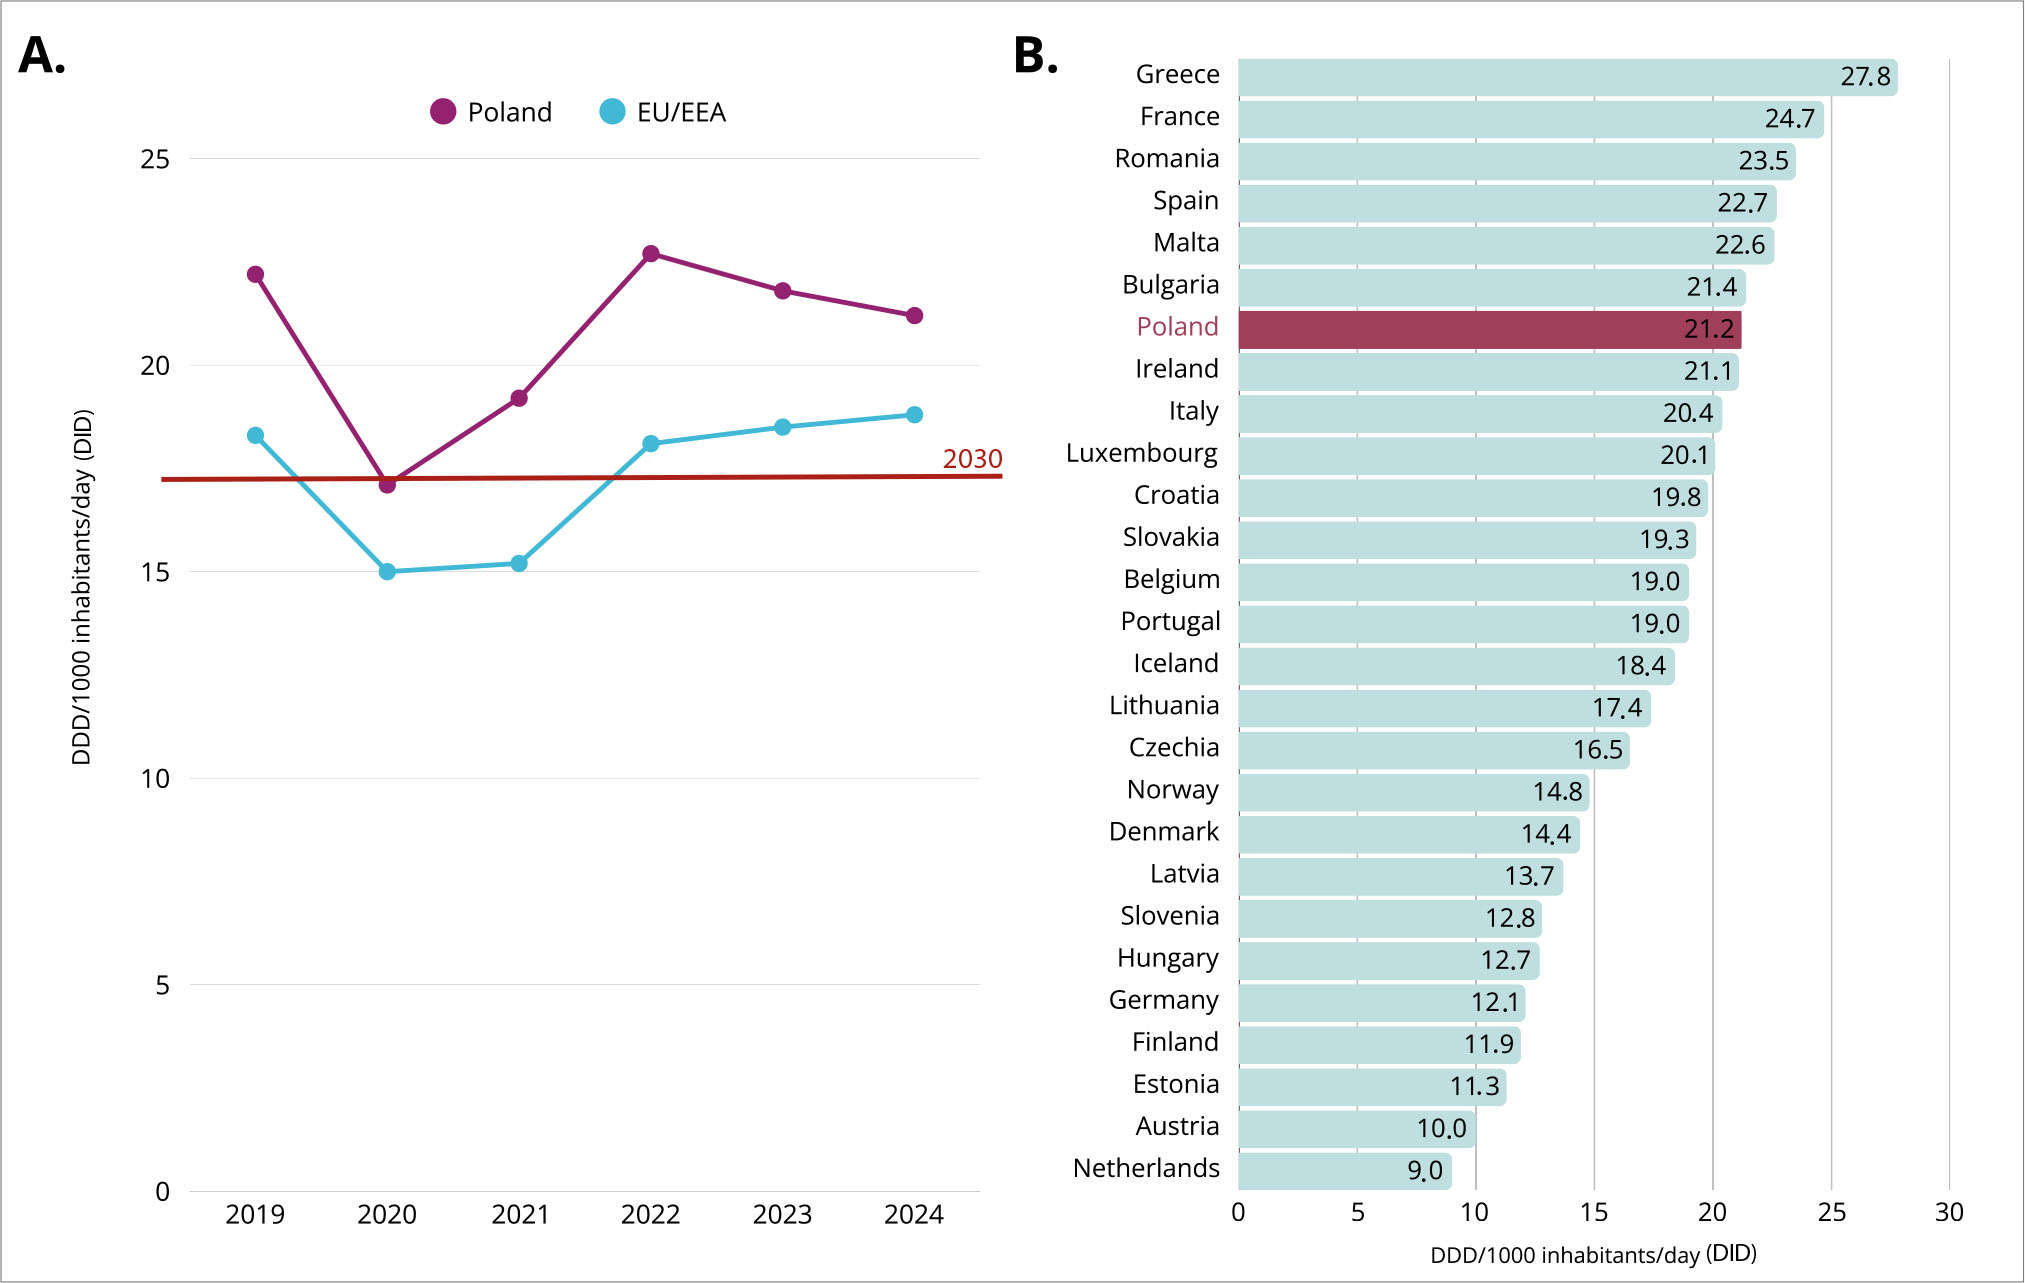
Fig. 1.
Community consumption of systemic antibacterials (ATC J01) in Poland compared with the EU/EEA average over time, and the 2030 target for Poland (A) and overall antibacterial use in the EU/EEA in 2024 (B).
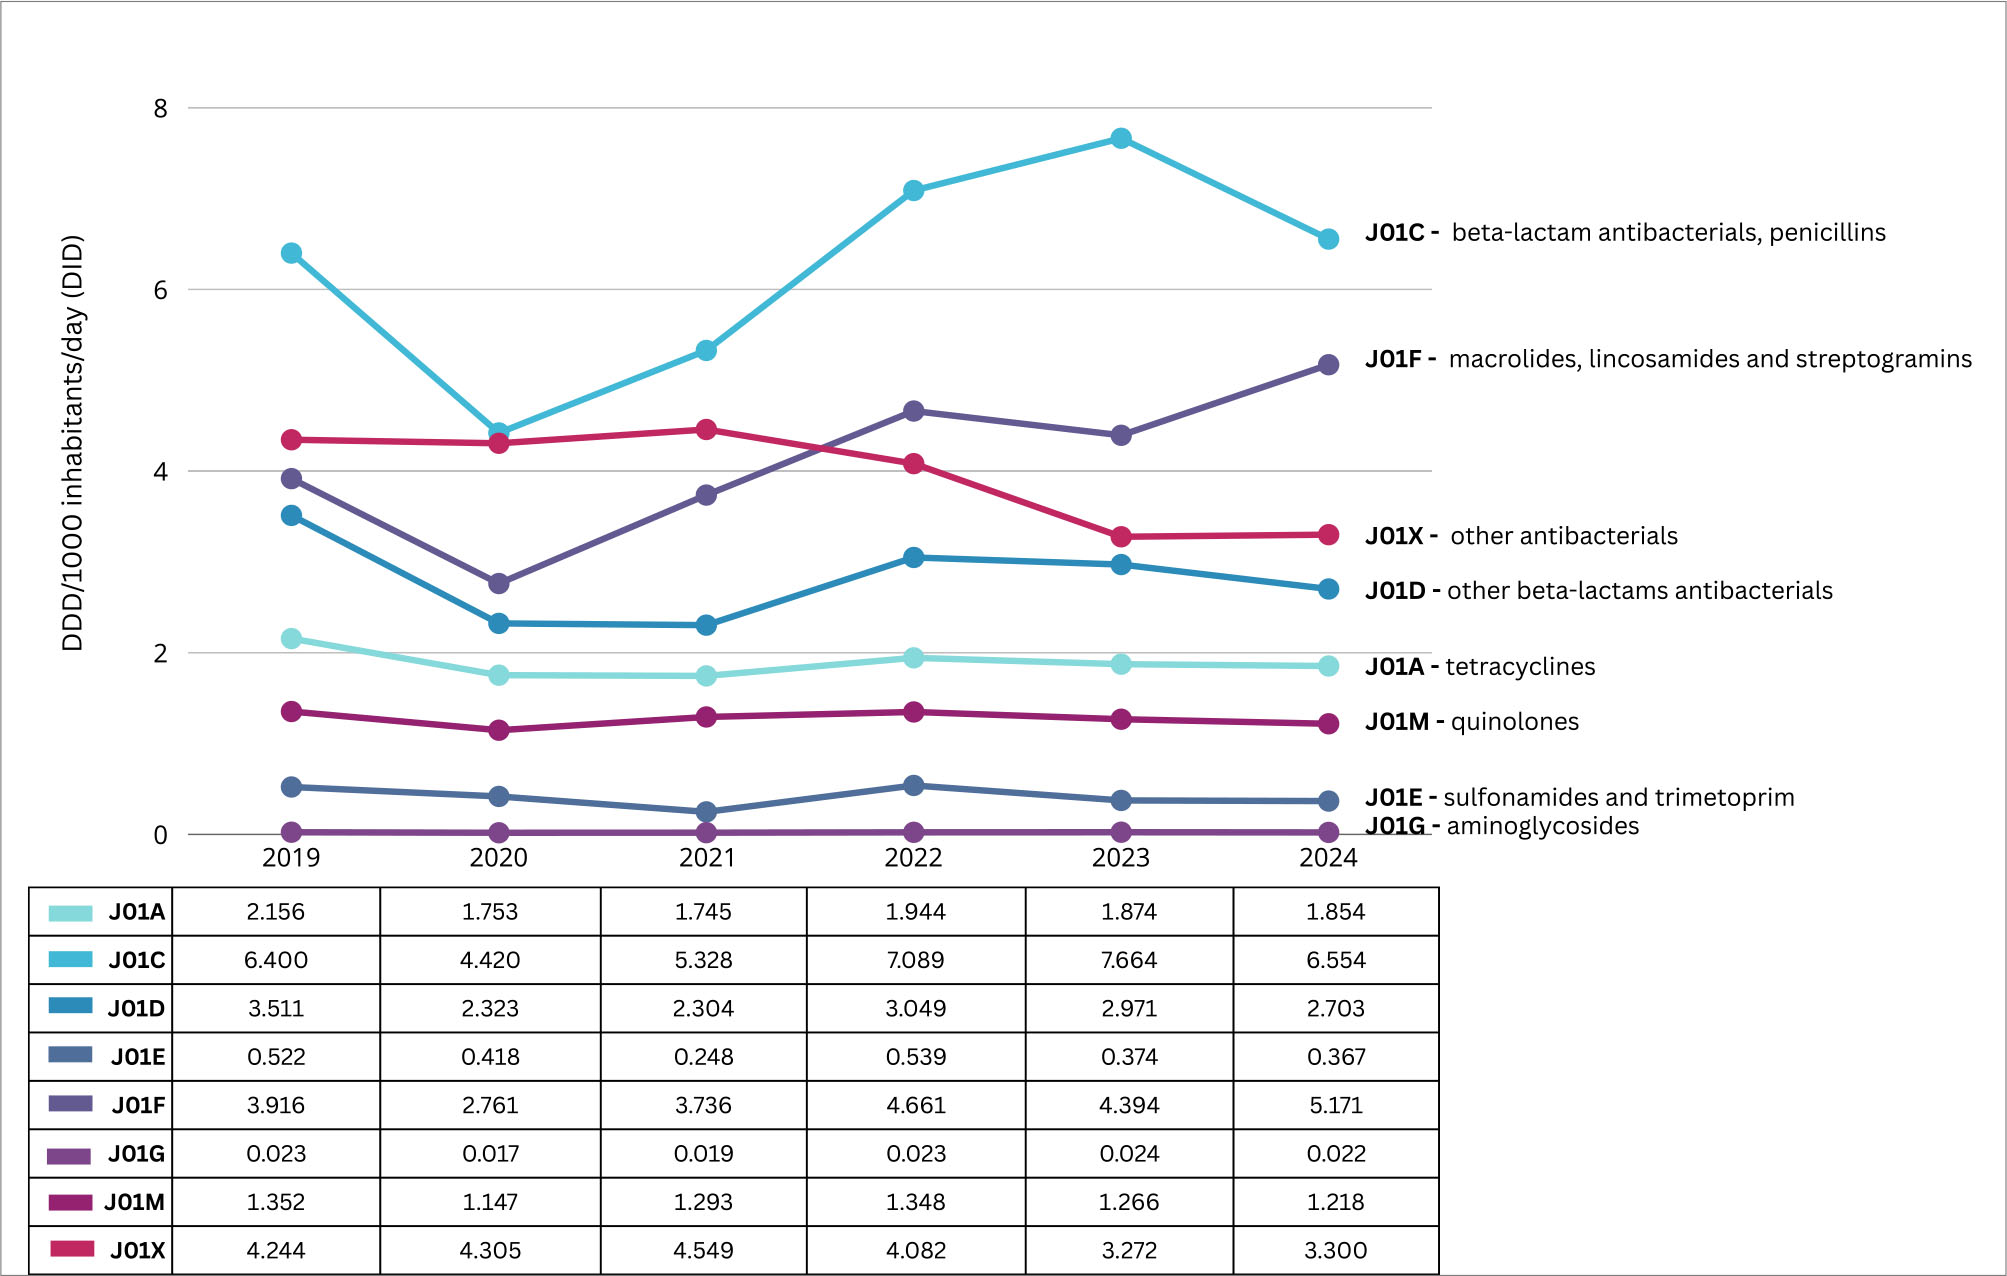
Fig. 2.
Temporal changes in antibiotic consumption across major J01 subgroups in the community sector in Poland, 2019–2024.
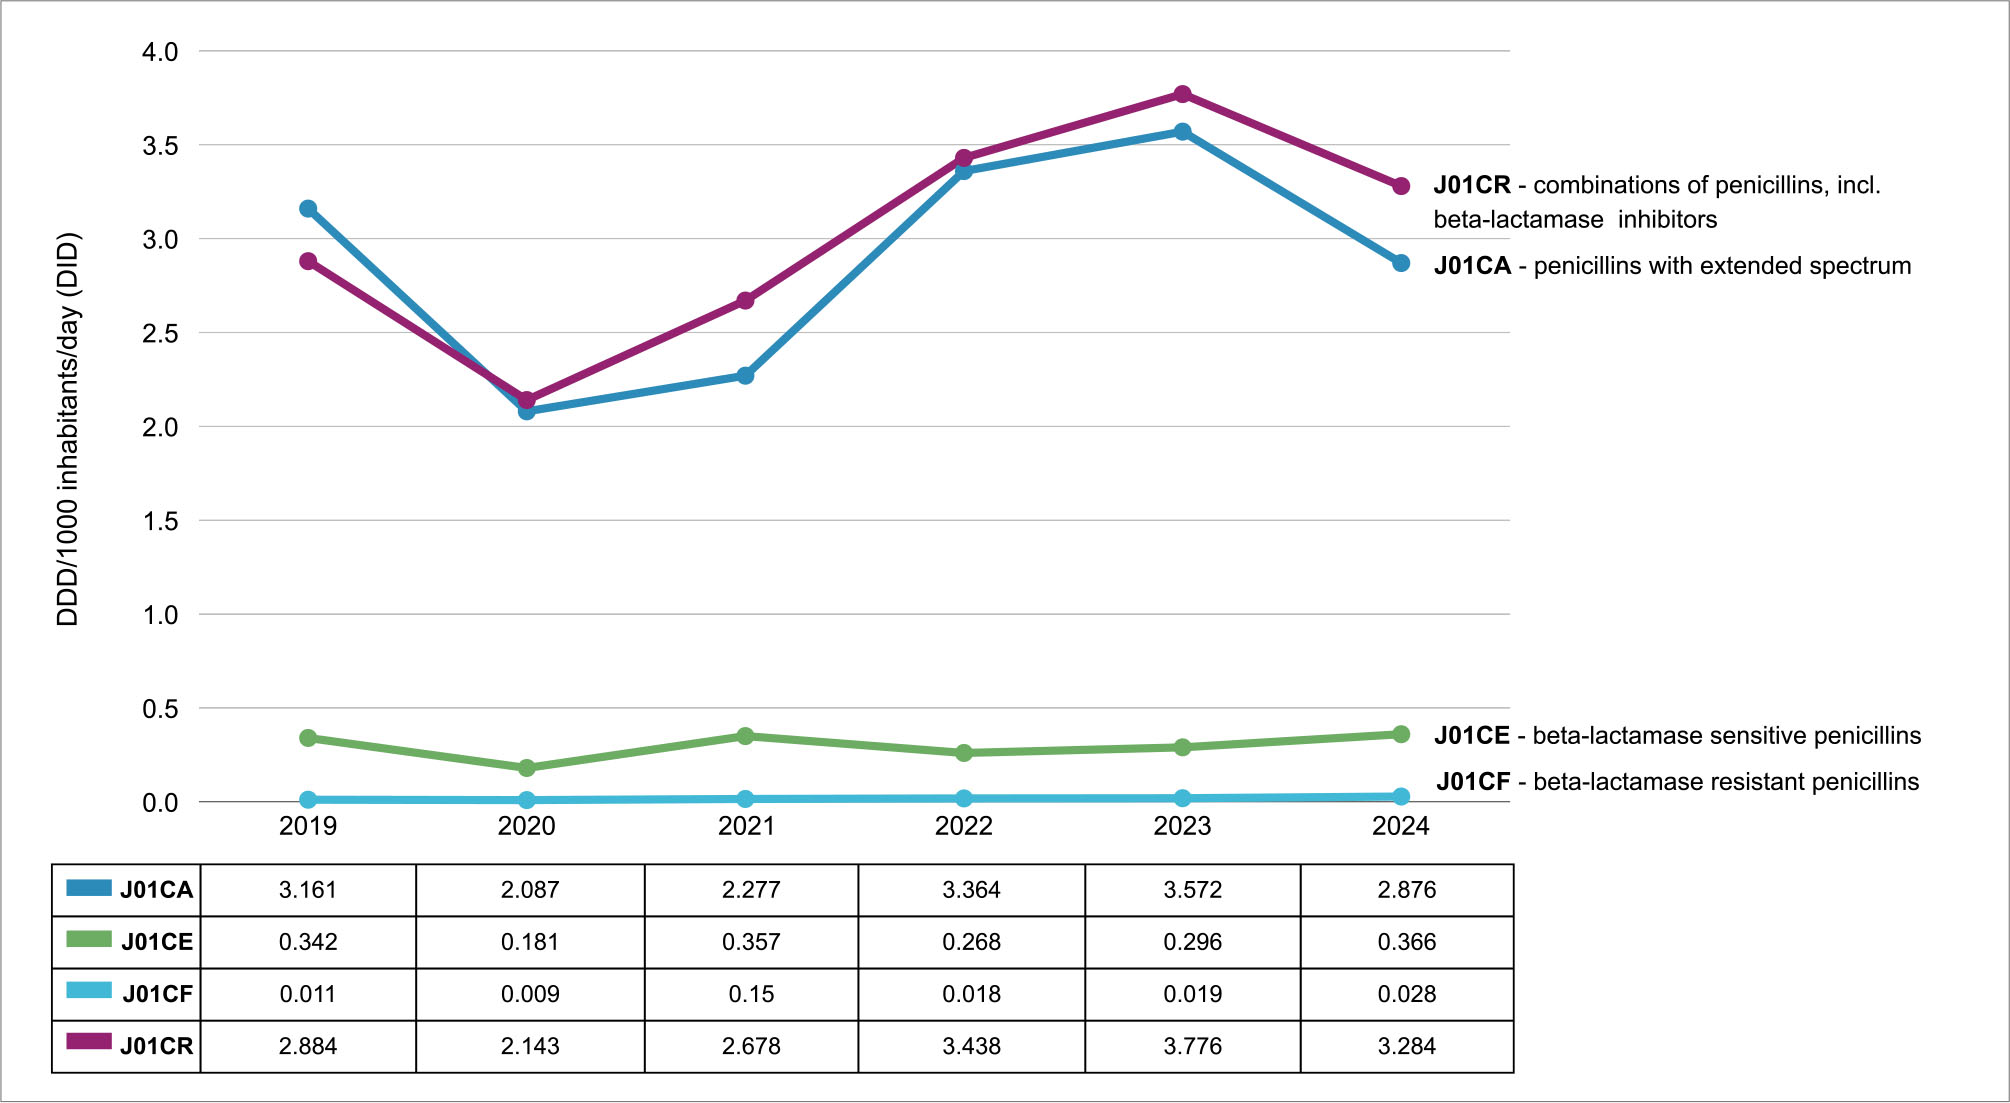
Fig. 3.
Temporal changes in antibiotics consumption across J01C subgroup in the community sector in Poland, 2019–2024.
Table I
Ten antibacterials for systemic use (ATC J01) with the highest consumption in the community sector in Poland, 2024.
| WHO ATC | Antibacterials | DID | % of total | AWaRe | ||
|---|---|---|---|---|---|---|
| 1. | J01C | J01CR02 | amoxicillin-clavulanic-acid | 3.30 | 15.5 | Access |
| 2. | J01X | J01XE03 | furazidin | 3.18 | 15.0 | Access |
| 3. | J01C | J01CA04 | amoxicillin | 2.87 | 13.5 | Access |
| 4. | J01D | J01DC02 | cefuroxime | 2.40 | 11.3 | Watch |
| 5. | J01F | J01FA10 | azithromycin | 2.33 | 10.1 | Watch |
| 6. | J01F | J01FA09 | clarithromycin | 1.97 | 9.3 | Watch |
| 7. | J01A | J01AA02 | doxycycline | 1.39 | 6.5 | Access |
| 8. | J01F | J01FF01 | clindamycin | 0.83 | 3.9 | Access |
| 9. | J01M | J01MA02 | ciprofloxacin | 0.61 | 2.8 | Watch |
| 10. | J01M | J01MA12 | levofloxacin | 0.44 | 2.1 | Watch |
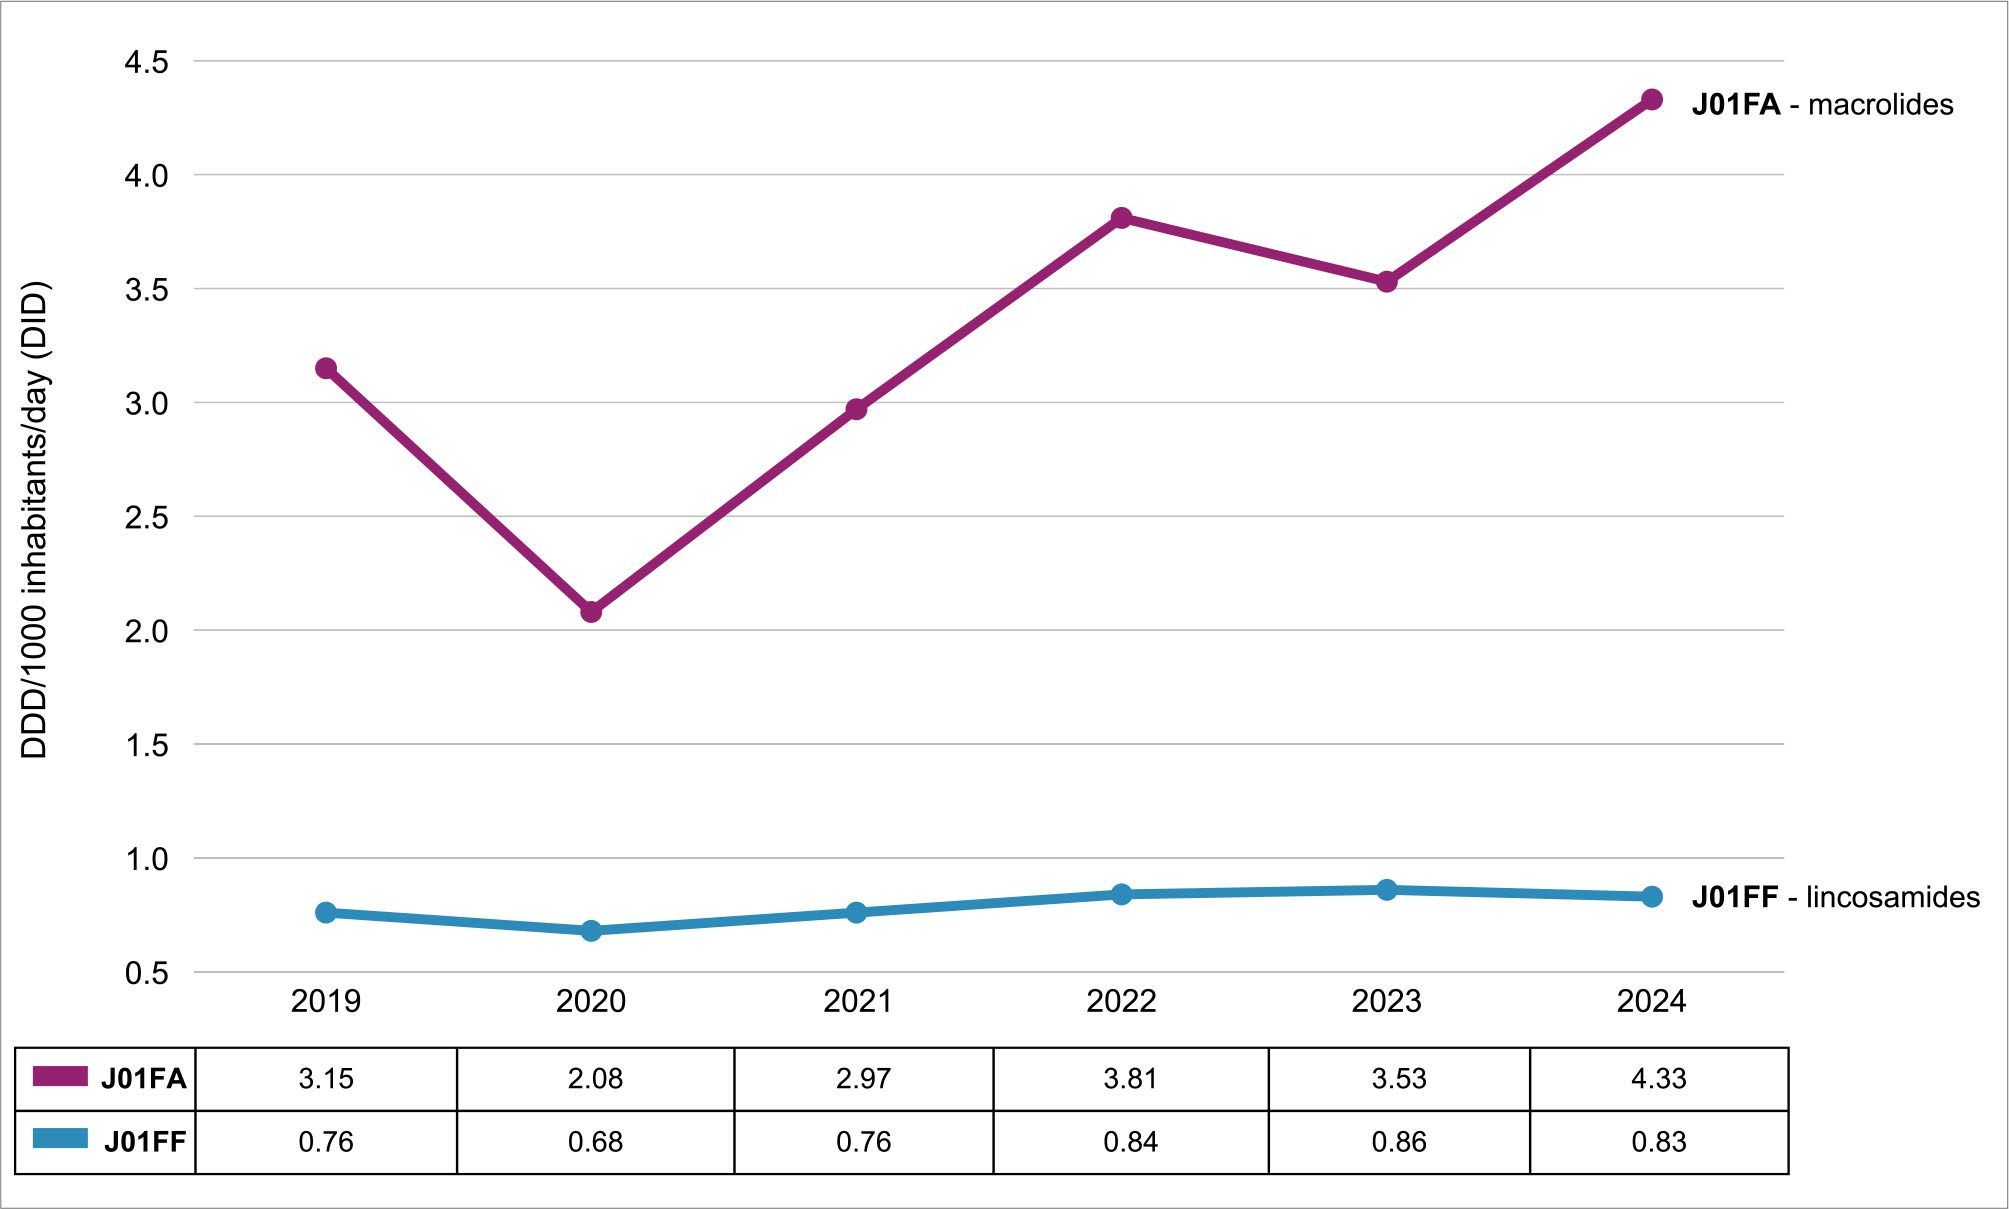
Fig. 4.
Temporal changes in antibiotics consumption across J01F subgroup in the community sector in Poland, 2019–2024.
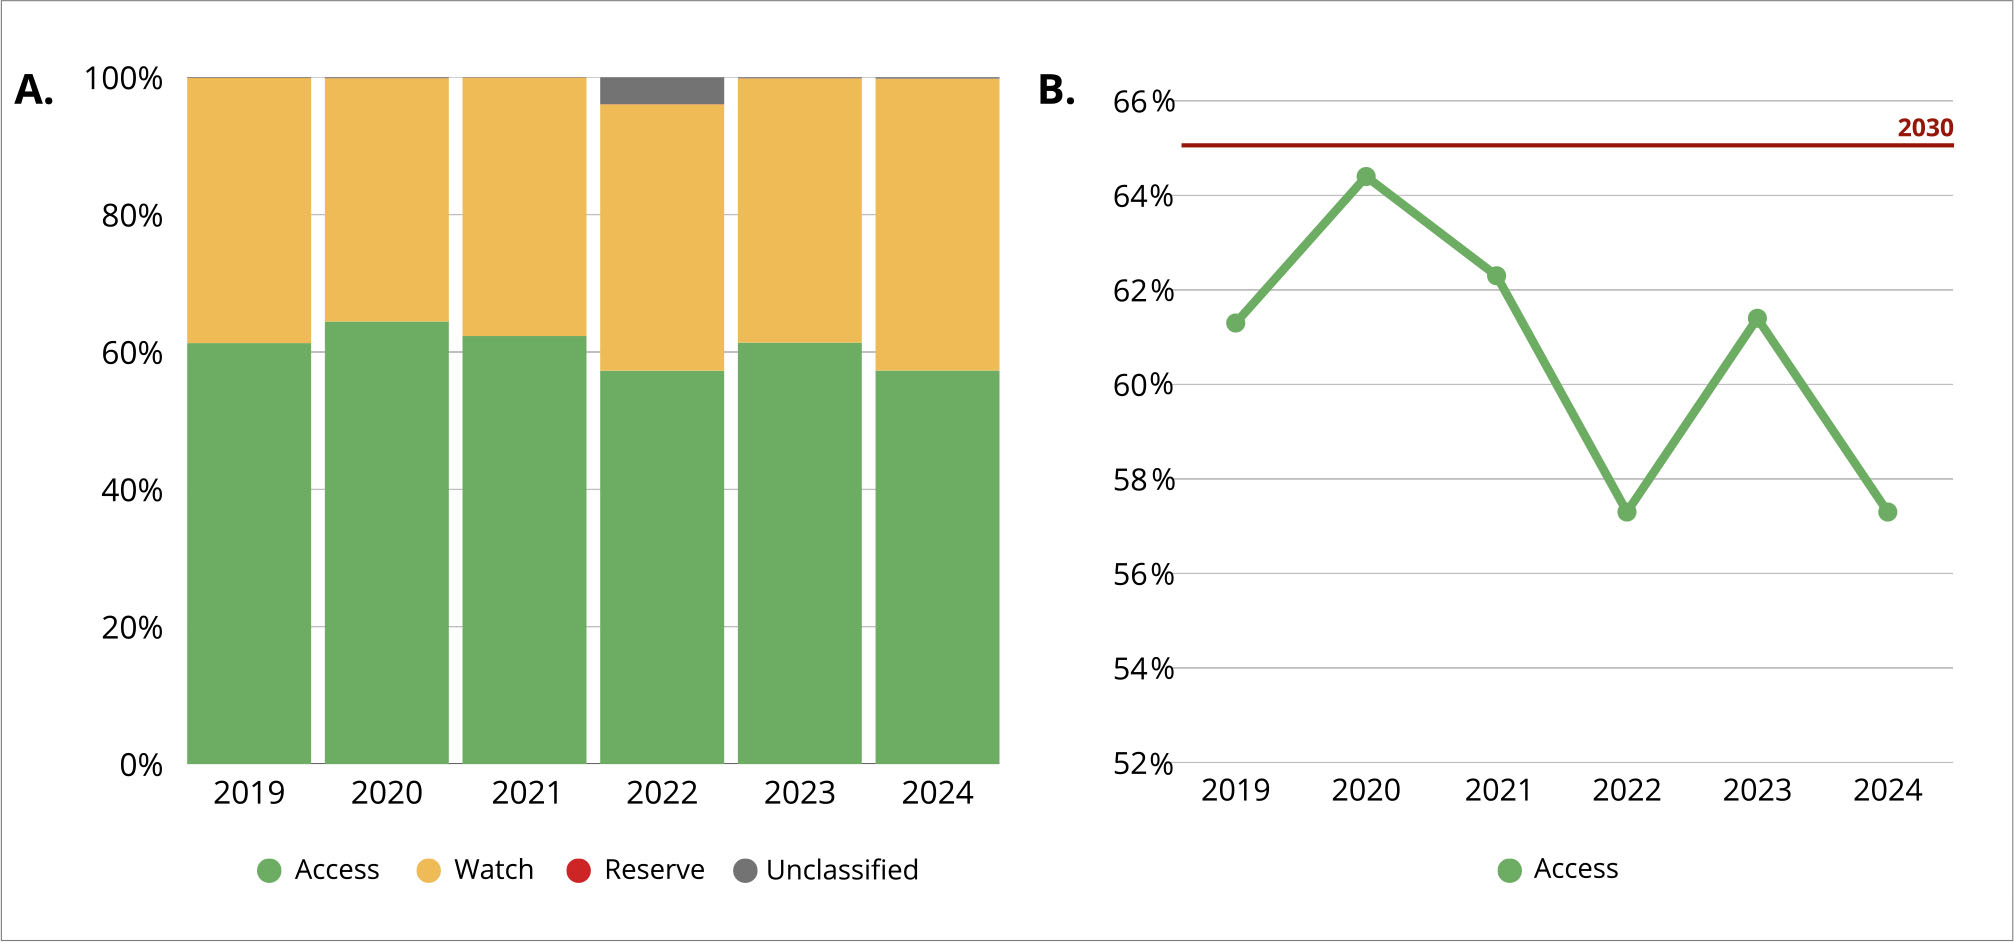
Fig. 5.
Community antibiotic consumption in Poland according to the WHO AWaRe classification (2019–2024). A. Distribution of antibiotic consumption by AWaRe categories in the community sector; B. Temporal trend in the percentage of Access group antibiotics in total community consumption, with the 2030 EU target (≥65%) indicated by the reference line.