
Fig. 1.
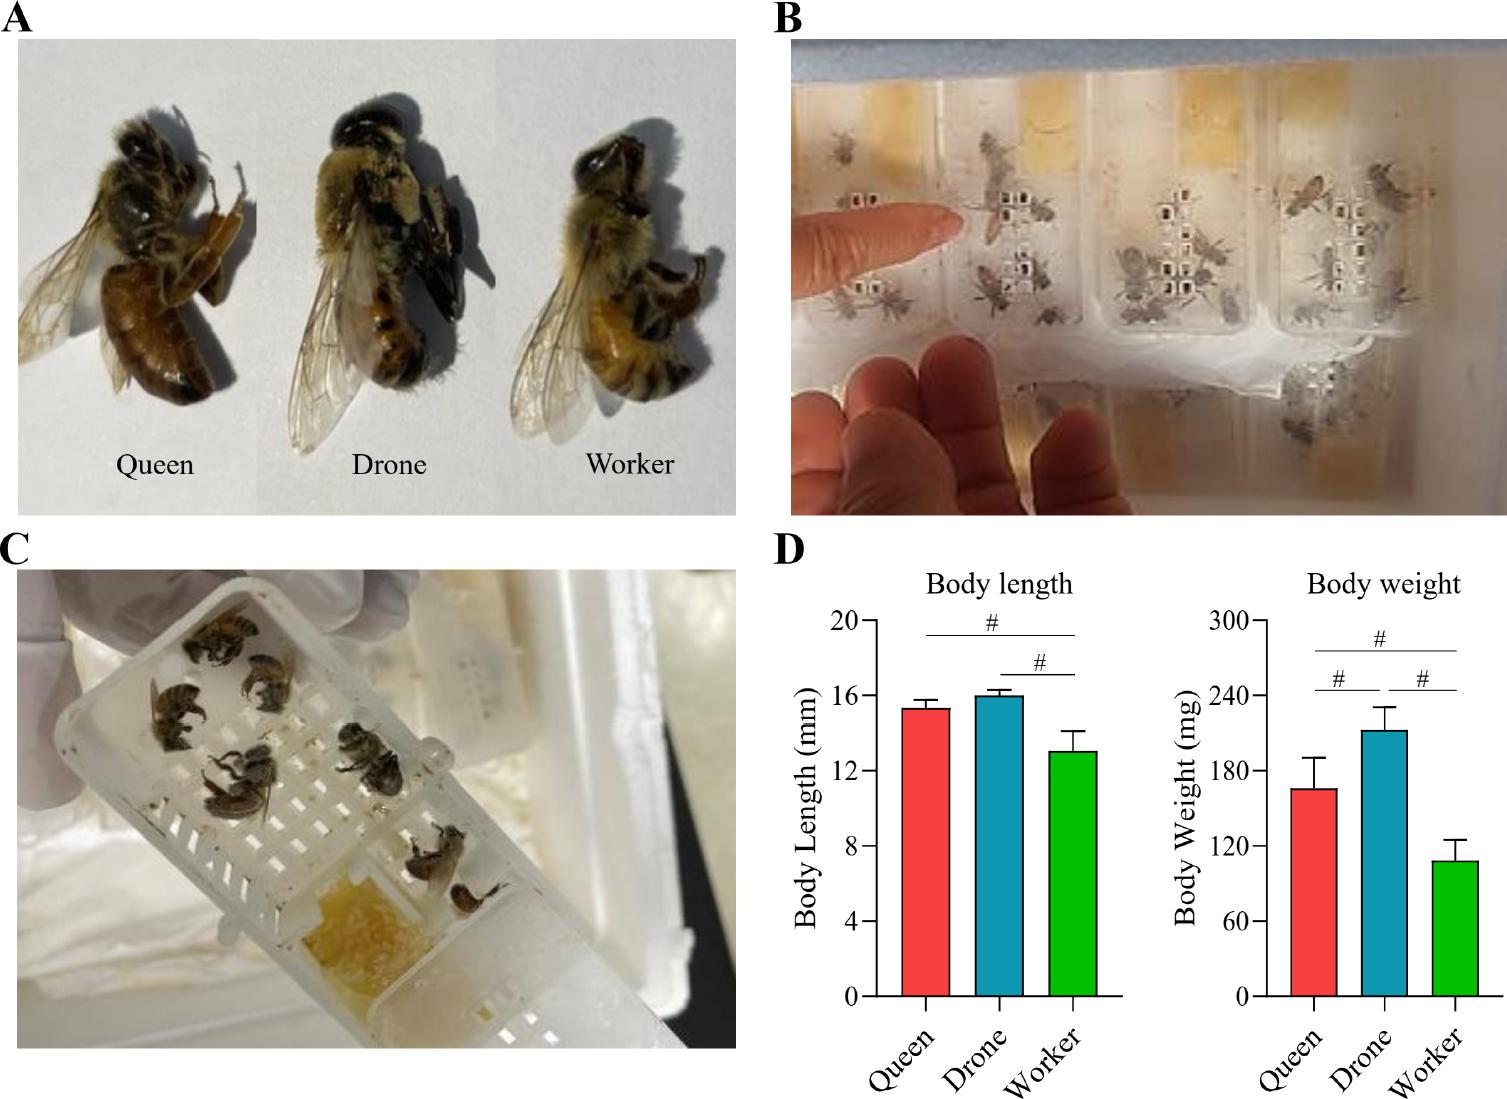
Fig. 2.
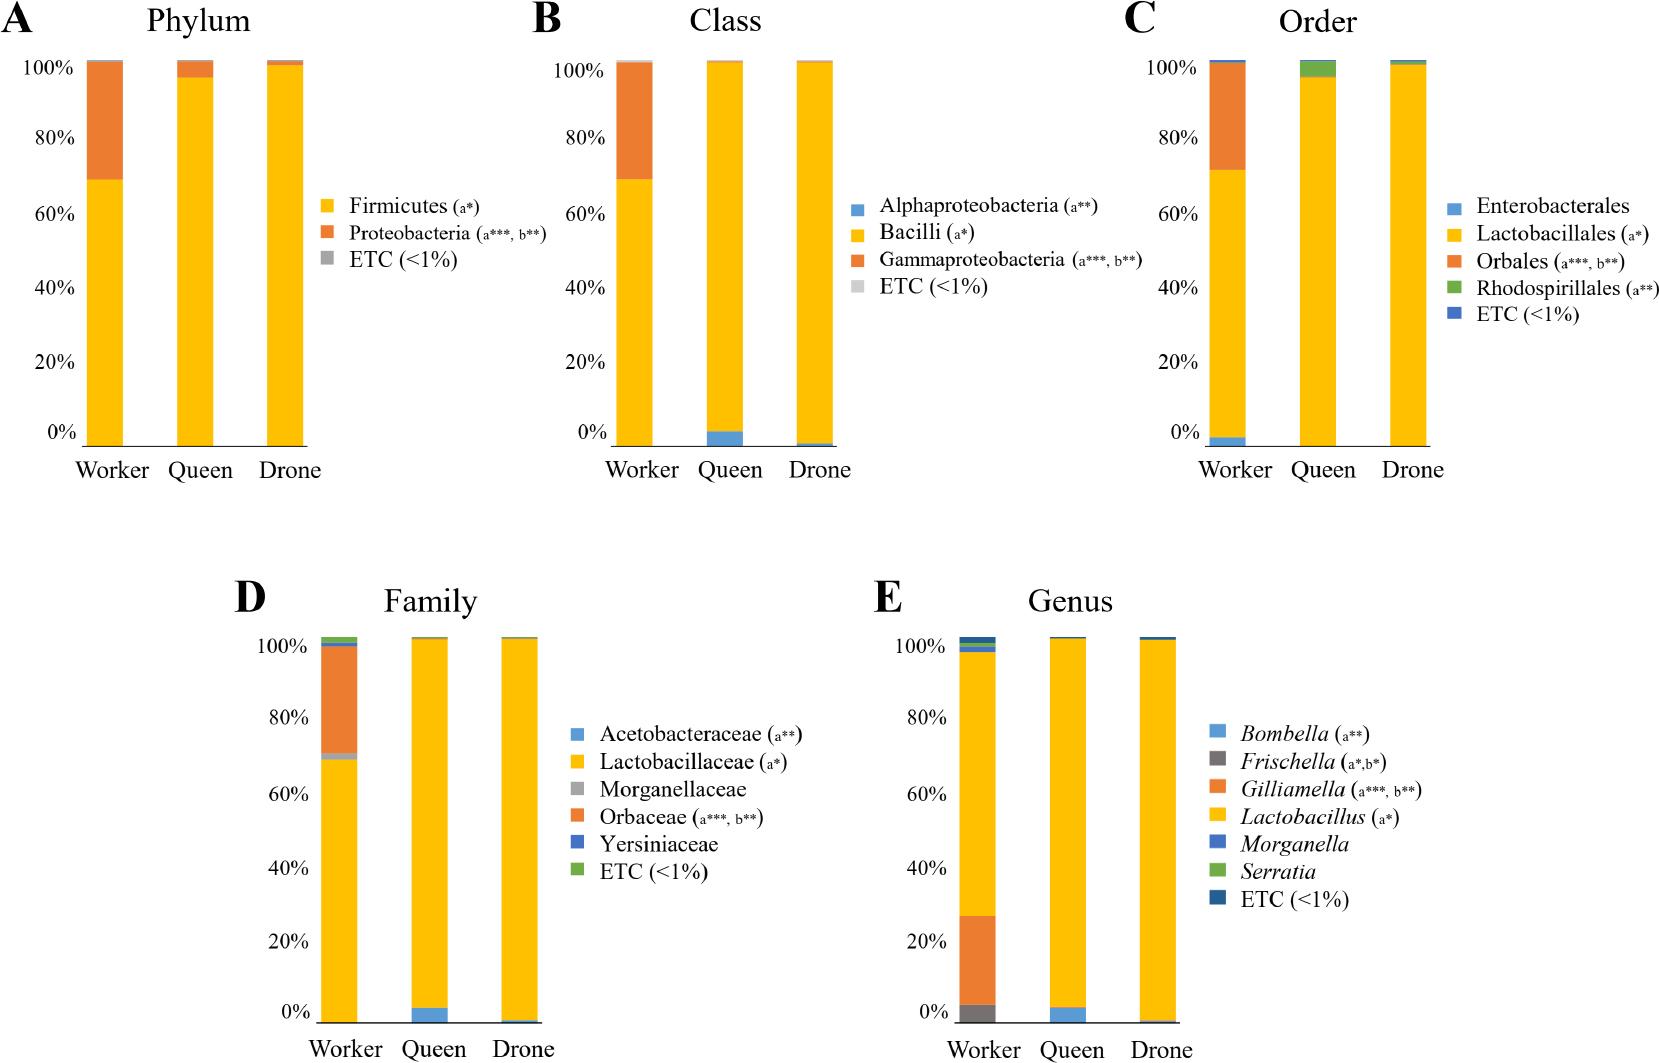
Fig. 3.
Fig. 4.
Fig. 5.
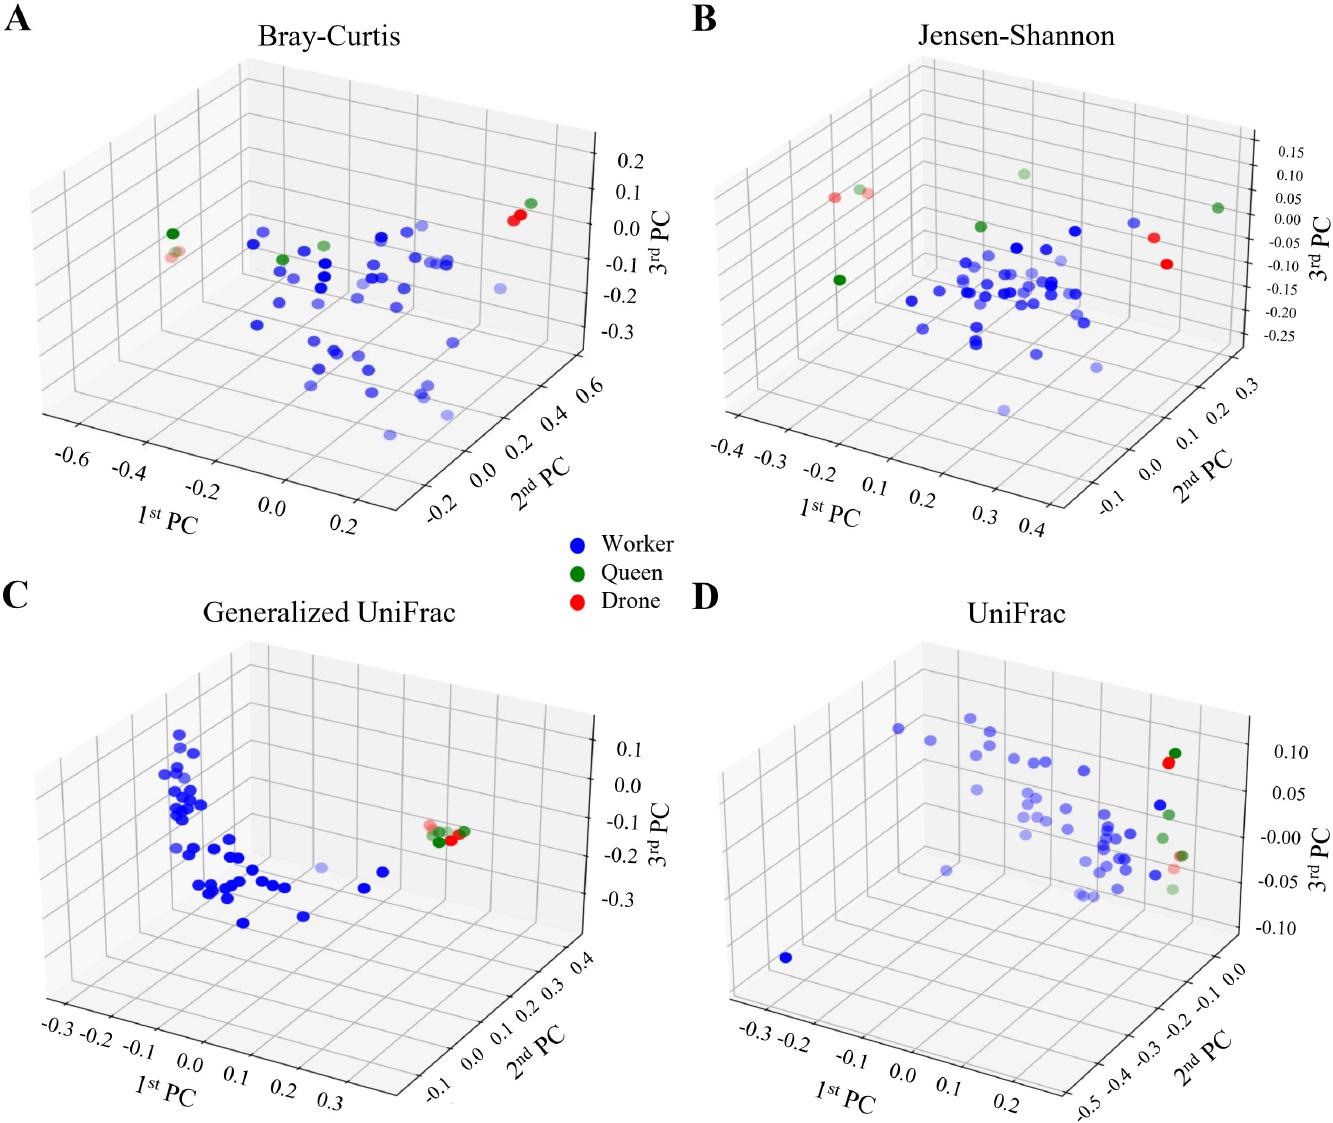
Fig. 6.
Fig. 7.
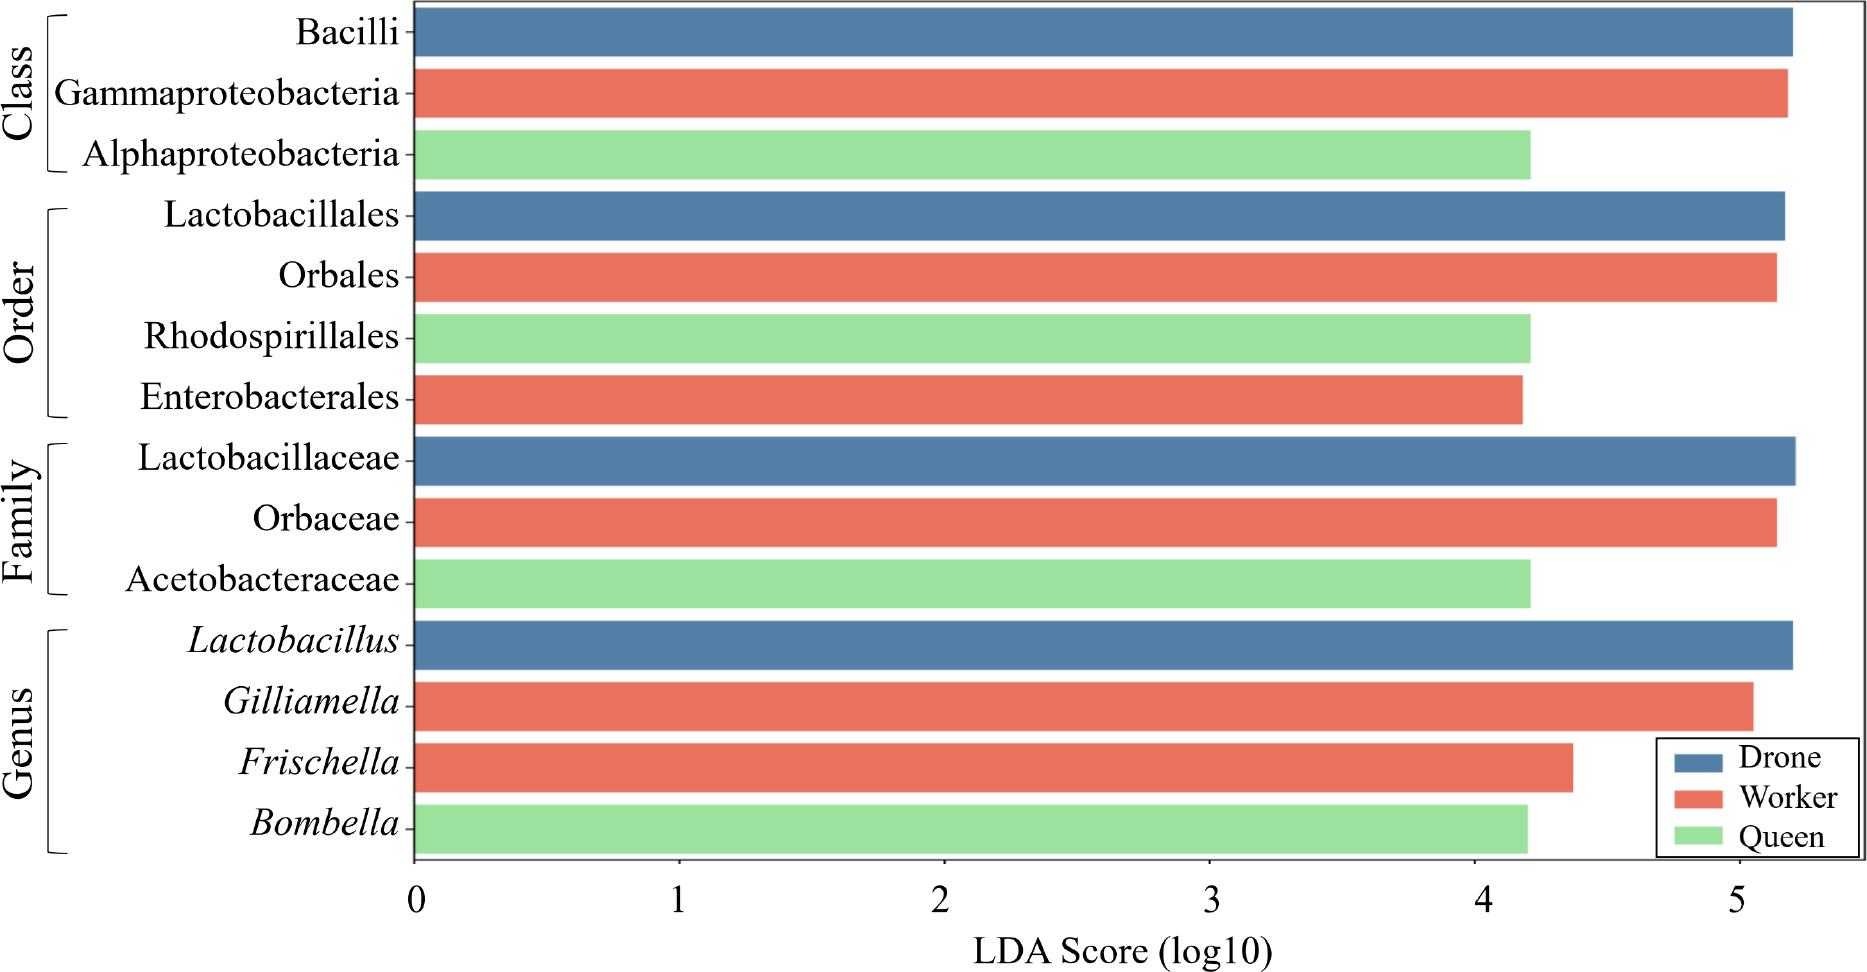
Fig. 8.
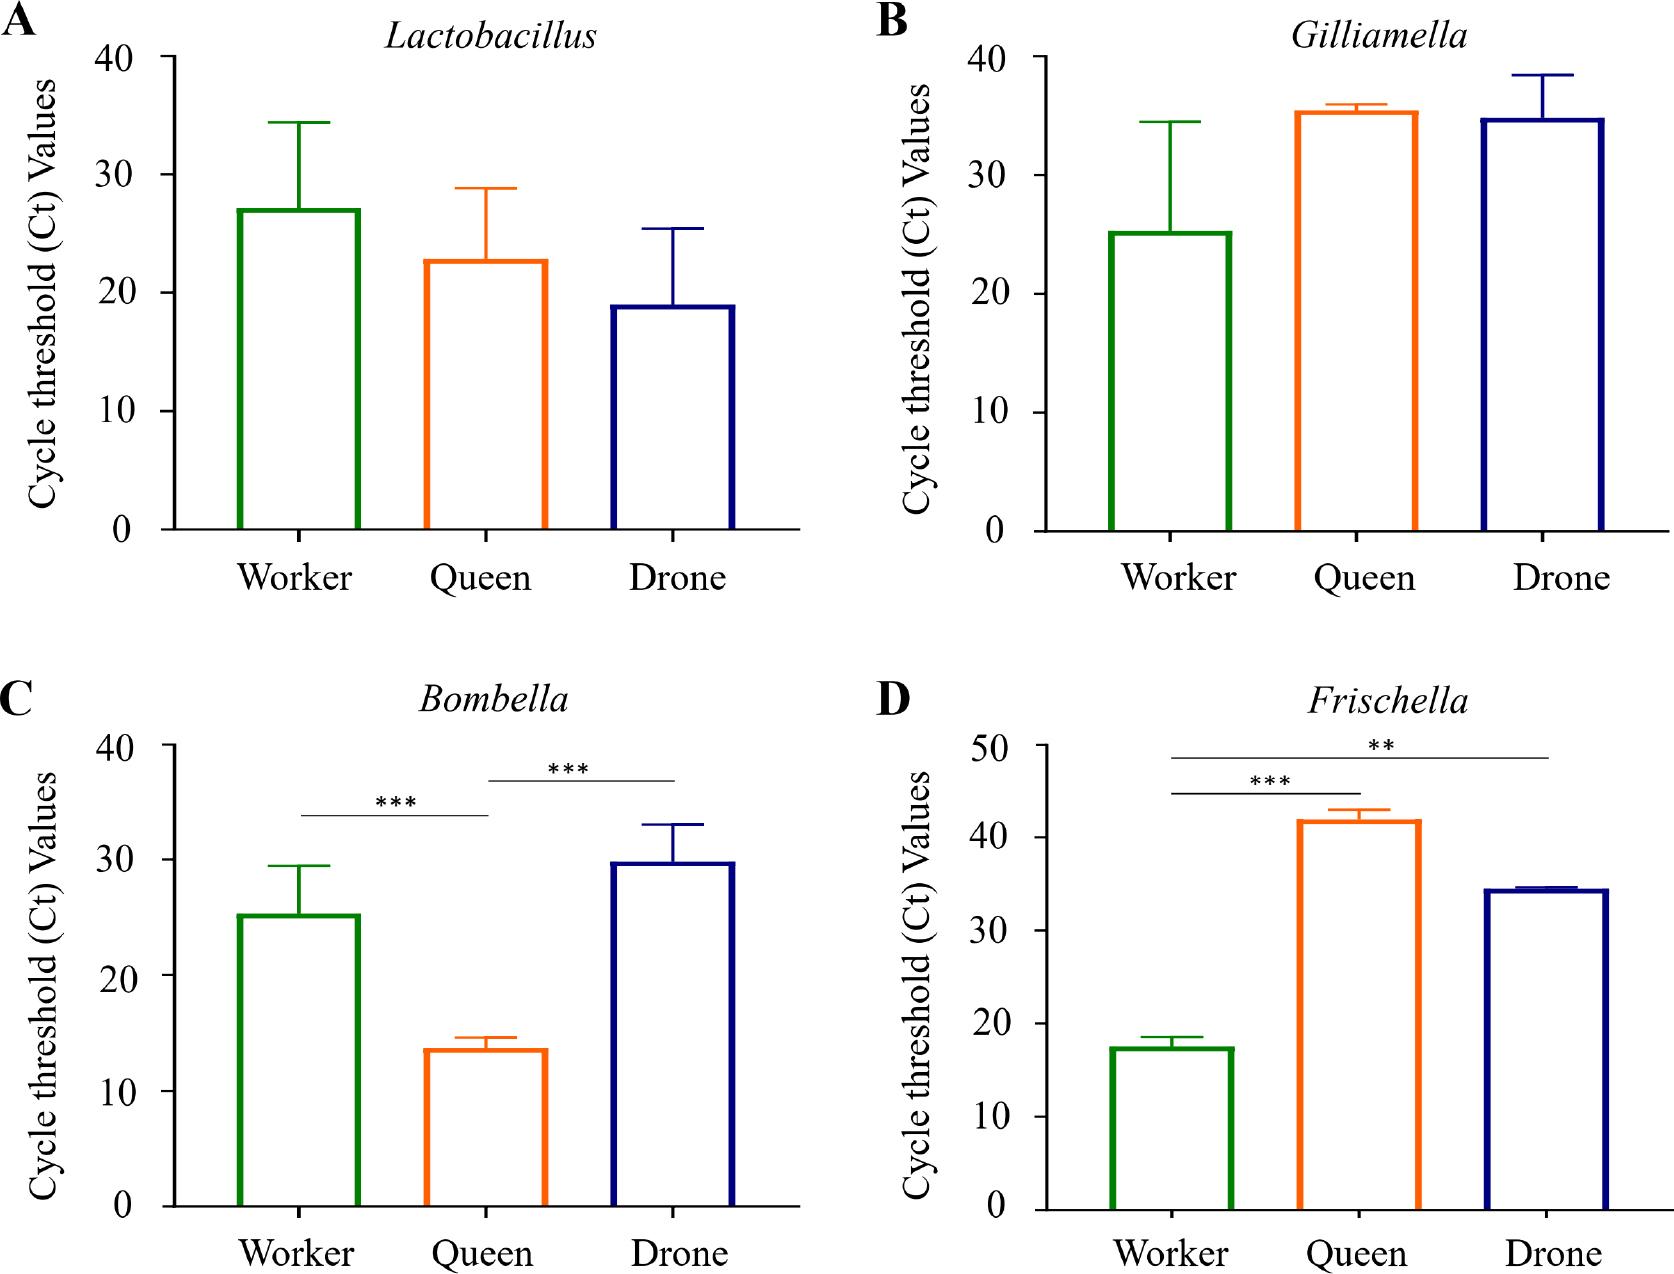
Fig. 9.
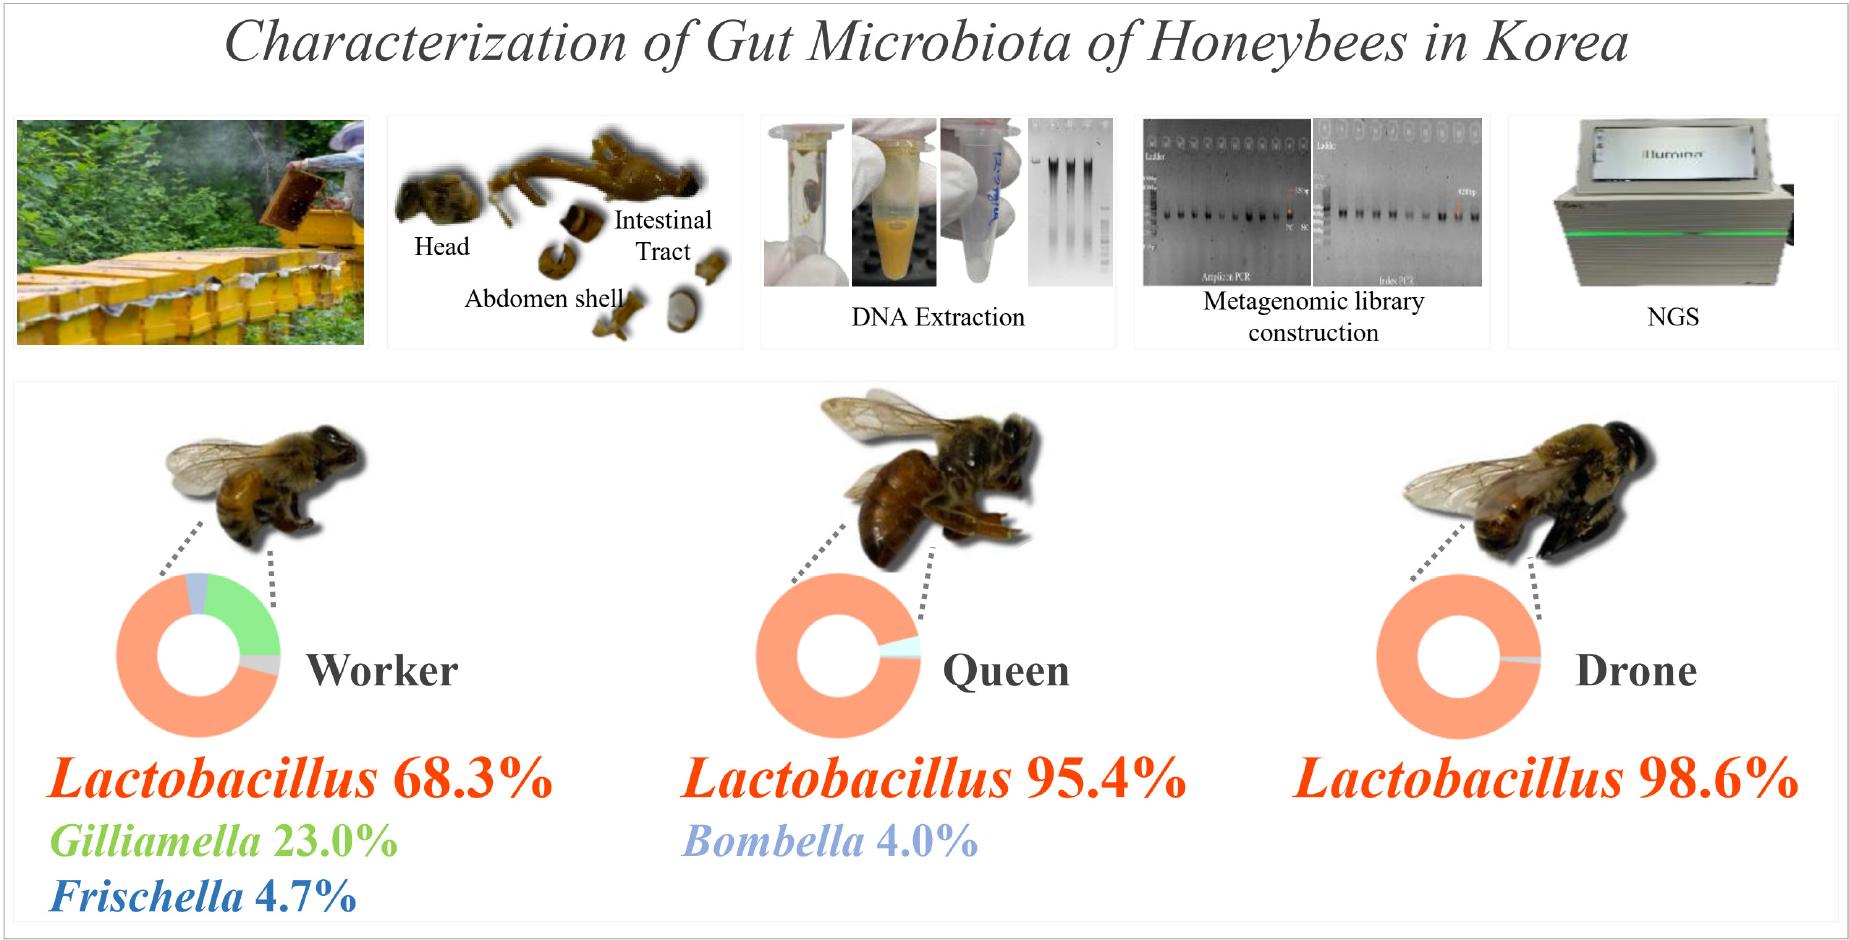
Average taxonomic composition of significantly different taxa among worker, queen, and drone bees_
| Phylum | W (%) | Q (%) | D (%) | Class | W (%) | Q (%) | D (%) | Order | W (%) | Q (%) | D (%) | Family | W (%) | Q (%) | D (%) | Genus | W (%) | Q (%) | D (%) |
| Firmicutes | 69.0 | 95.4 a* | 98.6 | Bacilli | 69.0 | 95.4 a* | 98.6 | Lactobacillales | 69.0 | 95.4 a* | 98.6 | Lactobacillaceae | 68.3 | 95.4 a* | 98.6 | Lactobacillus | 68.3 | 95.4 a* | 98.6 |
| Proteobacteria | 30.4 | 4.3 a*** | 1.0 b** | Gammaproteobacteria | 30.3 | 0.3 a*** | 0.3 b** | Orbales | 27.7 | 0.3 a*** | 0.2 b** | Orbaceae | 27.7 | 0.3 a*** | 0.2 b** | Gilliamella | 23.0 | 0.2 a*** | 0.2 b** |
| Frischella | 4.7 | 0.1 a* | 0.0 b* | ||||||||||||||||
| Alphaproteobacteria | 0.1 | 4.0 a** | 0.8 | Rhodospirillales | 0.1 | 4.0 a** | 0.8 | Acetobacteraceae | 0.1 | 4.0 a** | 0.8 | Bombella | 0.1 | 4.0 a** | 0.5 |
Beta diversity index among the honey bee castes_
| Index | Worker-Queen | Worker-Drone | Drone-Queen |
|---|---|---|---|
| Bray–Curtis | NS (p = 0.078) | NS (p = 0.301) | NS (p = 0.313) |
| Jensen–Shannon | NS (p = 0.438) | NS (p = 0.581) | NS (p = 0.644) |
| Generalized UniFrac | * (p = 0.031) | * (p = 0.050) | NS (p = 0.495) |
| UniFrac | ** (p = 0.003) | ** (p = 0.007) | NS (p = 0.835) |
Prediction of functional biomarkers for the three honey bee castes_
| Ortholog | Definition | LDA effect size | p-value | Worker (%) | Queen (%) | Drone (%) | |
|---|---|---|---|---|---|---|---|
| Orthology | K11904 | Type VI secretion system secreted protein VgrG | 3.1 | 0.000 | 0.2 | 0.0 | 0.0 |
| K15580 | Oligopeptide transport system substrate-binding protein | 2.9 | 0.007 | 0.1 | 0.2 | 0.2 | |
| K07052 | Uncharacterized protein | 2.9 | 0.000 | 0.2 | 0.3 | 0.3 | |
| K01439 | Succinyl-diaminopimelate desuccinylase | 2.9 | 0.042 | 0.1 | 0.2 | 0.2 | |
| K10947 | PadR family transcriptional regulator, regulatory protein PadR | 2.9 | 0.002 | 0.1 | 0.3 | 0.2 | |
| Module (PICRUSt) | K02945 | Ribosome, bacteria | 3.7 | 0.042 | 5.7 | 6.8 | 6.6 |
| K11904 | Type VI secretion system | 3.6 | 0.000 | 0.8 | 0.0 | 0.0 | |
| K02035, K02031, K02032 | Peptides/nickel transport system | 3.4 | 0.000 | 0.9 | 1.3 | 1.3 | |
| K00798, K02226 | Cobalamin biosynthesis, cobinamide => cobalamin | 3.3 | 0.060 | 0.4 | 0.8 | 0.7 | |
| K15580 | Oligopeptide transport system | 3.3 | 0.002 | 0.3 | 0.7 | 0.6 | |
| Module (MinPath) | K17204 | Erythritol transport system | 3.2 | 0.000 | 0.3 | 0.5 | 0.6 |
| K02052 | Putative spermidine/putrescine transport system | 3.2 | 0.000 | 0.3 | 0.6 | 0.6 | |
| K20491, K20492 | Lantibiotic transport system | 3.1 | 0.000 | 0.2 | 0.5 | 0.5 | |
| K11195 | PTS system, fructose-specific II component | 3.1 | 0.000 | 0.3 | 0.6 | 0.6 | |
| K12536 | Hemophore/metalloprotease transport system | 3.1 | 0.000 | 0.2 | 0.4 | 0.4 | |
| Pathway (PICRUSt) | K00010, K00011, K00015, K00016 | Metabolic pathways | 3.7 | 0.001 | 15.9 | 16.7 | 16.7 |
| K01995, K02031, K02032, K02035 | Quorum sensing | 3.3 | 0.000 | 1.6 | 2.1 | 2.1 | |
| Flagellar assembly | 3.3 | 0.000 | 0.4 | 0.1 | 0.0 | ||
| K02945 | Ribosome | 3.2 | 0.006 | 2.0 | 2.4 | 2.3 | |
| K00010, K00015, K00016, K00033 | Microbial metabolism in diverse environments | 3.2 | 0.000 | 4.8 | 5.1 | 5.1 | |
| Pathway (MinPath) | K00466 | Tryptophan metabolism | 3.6 | 0.000 | 0.8 | 1.5 | 1.6 |
| K00965, K01198, K02790, K02791 | Amino sugar and nucleotide sugar metabolism | 3.5 | 0.000 | 1.0 | 1.5 | 1.6 | |
| K01259 | Arginine and proline metabolism | 3.5 | 0.000 | 1.1 | 1.8 | 1.8 | |
| K00011, K00965, K01785, K02744 | Galactose metabolism | 3.5 | 0.000 | 0.7 | 0.1 | 0.1 | |
| K13993 | Protein processing in endoplasmic reticulum | 3.4 | 0.000 | 1.2 | 1.7 | 1.7 | |