
Honey bees (Apis mellifera) are fundamental to agriculture and ecological balance due to their vital role in pollination. As a eusocial species, honey bees exhibit a caste-based colony structure consisting of workers, queens, and drones that fulfill distinct biological roles. The health and productivity of these colonies are closely connected to internal and external factors, including nutrition, immunity, and microbial symbiosis (Kapheim et al. 2015; Copeland 2022). When it comes to digestion, pathogen protection, and immunological regulation, the honey bee gut microbiota is crucial and has a direct impact on colony survival and resilience. (Zheng et al. 2018; Motta and Moran 2024). However, disruptions in gut microbiota due to pesticides, inadequate nutrition, or infections can cause dysbiosis, diminishing foraging efficiency, immunity, and overall health in honey bees (Hamdi et al. 2011; Anderson and Ricigliano 2017).
The gut microbiome, a complex community of bacteria, fungi, viruses, and their genetic materials, plays a crucial role in maintaining health and colony function (Boon et al. 2014). Joshua Lederberg initially proposed research into microbiomes, which has advanced rapidly through large-scale initiatives, such as the Human Microbiome Project (HMP) and MetaHIT (Institute of Medicine 2009; García-López et al. 2019; Noor et al. 2024). These projects have highlighted the significant impact of microbiomes on health, ecosystems, and other aspects. Innovative methods, such as metagenomics and next-generation sequencing (NGS), have revolutionized the analysis of microbiomes, enabling a detailed examination of microbial diversity, functions, and interactions with hosts and their environments (Casaburi 2014; Wójcik et al. 2023).
Korea’s varied climate zones, seasonal temperature fluctuations, and region-specific beekeeping practices make it a relevant location for studying how environmental conditions shape honey bee gut microbiomes. Such a regional environment may influence the gut microbiome composition in specific ways, potentially affecting honey bee health and resilience to stressors (Chmiel et al. 2020). Recent studies indicate that honey bee populations in Korea face challenges due to environmental factors, including climate change, pesticide exposure, habitat loss, and pathogens (Jung and Lee 2018; Min et al. 2024). These stressors reflect global concerns about colony losses, resulting in significant economic losses in the beekeeping industry. Current research on honey bee gut microbiota examines its impact on bee health and explores the use of microbial symbionts in managing bee diseases.
Understanding and promoting a balanced gut microbiota is essential for protecting bee health and ensuring the production of premium honey, a vital commodity for human consumption and environmental sustainability. Honey bees with a healthy gut microbiome are better able to digest food, absorb nutrients, and maintain robust immune systems, which enables them to forage efficiently and produce high-quality honey (Taylor et al. 2019; El-Seedi et al. 2022). Conversely, disruptions in the microbiome can compromise bee health, reduce foraging effectiveness, and negatively impact the quantity and quality of honey produced (El-Seedi et al. 2022).
By employing high-throughput sequencing and bioinformatics analysis, this study focuses on the microbiome of honey bees in Korea, examining the composition and predictive functional profiles (using PICRUSt) of gut microbiota in support of caste-specific needs and overall colony health. This research provides important baseline data on caste-specific gut microbiota in Korean honey bees, offering insights into microbiome-based strategies for enhancing colony health and agricultural sustainability.
Honey bees (Apis mellifera) were collected from Kkul Dorae Farm, Chungcheongnam-do, South Korea (36°28′27.1″N, 126°46′55.2″E) during early summer (June–July 2023). The ambient temperature during the sampling period ranged from approximately 16°C to 27°C. Fifty-one adult honey bees were collected from nine separate colonies, including five queens, four drones, and 42 worker bees. Multiple colonies were included to obtain sufficient representation for comparative analysis among the three bee castes. About five to seven bees were sampled from a separate colony. Bees were selected based on visual health, specifically, the absence of physical damage, signs of parasitism, or abnormal behavior. After capturing the live bees, they were placed in boxes and transported to the Human Microbiome Medical Research Center (HM-MRC), where they were stored at –80°C for downstream processing.
To preserve sample integrity, whole bees were stored at –80°C. After thawing, the entire bee gut was separated from the exoskeleton. Each bee was dissected under sterile conditions. The isolated gut tissue was homogenized in 1× PBS to ensure sample uniformity. According to the manufacturer’s protocol, DNA was extracted from the homogenized gut sample using a QIAamp® PowerFecal® Pro DNA Kit (QIAGEN, Germany). DNA concentrations were measured using the Qubit™ 4 Fluorometer (Invitrogen™, Thermo Fisher Scientific Inc., USA) with the Qubit™ 1X dsDNA High Sensitivity Kit (Invitrogen™, Thermo Fisher Scientific Inc., USA). The DNA quality was assessed by 0.8% agarose gel electrophoresis. A gel documentation system (Gel Doc™ XR+; Bio-Rad Laboratories, Inc., USA) was used to visualize the electrophoresis results. All samples were subsequently stored at –20°C for further analysis.
The genomic DNA extracted from the gut of a honey bee underwent PCR amplification targeting the 16S (V4 region) bacterial rRNA gene. An Illumina 16S (V4 region) bacterial rRNA amplicon primer set (Forward primer: TCGTCGGCAGCGTCAGATGTGTATAAGAGACAGCCTACGGGNGGCWGCAG; Reverse primer: GTCTCGTGGGCTCGGAGATGTGTATAAGAGACAGGACTACHVGGGTATCTAATCC) from a previous study was employed (Seo et al. 2023). The PCR mix included 12.5 μl of KAPA HiFi HotStart ReadyMix (Kapa Biosystems, USA), 10 ng of genomic DNA (10 ng/μl), 1 μl of forward primer, 1 μl of each reverse primer, and ddH2O to bring the total volume of 25 μl following a previously described protocol (Kim et al. 2021a). PCR was then conducted using the Veriti™ Thermal Cycler 96-well (Applied Biosystems™, Thermo Fisher Scientific Inc., USA) for all samples, including a negative control (no template DNA) and a positive control (5 ng of mouse stool DNA). PCR cycling parameters were as follows: initial denaturation at 95°C for 3 minutes, followed by 25 cycles each of denaturation at 95°C for 30 seconds, annealing at 55°C for 30 seconds, and extension at 72°C for 30 seconds, concluding with a final extension at 72°C for 5 minutes. Subsequently, the Nextera™ XT DNA Library Prep Kit (Illumina, Inc., USA) was utilized for index PCR following the recommended protocol, with initial denaturation at 95°C for 3 minutes, then 8 cycles of denaturation at 95°C for 30 seconds, annealing at 55°C for 30 seconds, and extension at 72°C for 30 seconds, concluding with a final extension at 72°C for 5 minutes. For the indexing process, 5 μl of each sample’s purified amplicon PCR product was used. AMPure beads (Beckman Coulter, Inc., UK) were employed for PCR product purification following the manufacturer’s instructions. The final DNA concentrations of each sample were adjusted to 1 nM with H2O, and 5 μl from each sample was pooled together. This pooled library (50 pMol) was then sequenced using a 30% PhiX spike on an iSeq™ 100 platform (Illumina, Inc., USA).
To analyze the diversity, taxonomic composition, and functional potential of the gut microbiota and to gain insights into the microbial community structure, iSeq™ 100 Illumina®FASTQ reads were examined using established methods (Kim et al. 2021b). Data processing was conducted on the EzBioCloud server (http://www.ezbiocloud.net) (Chalita et al. 2024). Low-quality reads (< Q25) were filtered, and their quality was assessed using Trimmomatic v0.32 (Bolger et al. 2014). Primer trimming was performed using Myers and Miller’s alignment algorithm (Myers and Miller 1988). Samples lacking 16S rRNA encoding were identified using HMMER and nhmmer software applications (package version 3.2.1) (Wheeler and Eddy 2013; Potter et al. 2018). Unique and duplicate read clusters were processed with the derep_full length tool in VSEARCH (Rognes et al. 2016). VSEARCH and the 16S rRNA database from EzBioCloud were utilized for taxonomic assignment (Myers and Miller 1988; Rognes et al. 2016; Yoon et al. 2017). UCHIME filtered chimeric reads, and the cluster_fast function created operational taxonomic units (OTUs) to identify sequences at lower taxonomic levels (Shokralla et al. 2015; Rognes et al. 2016). OTUs with only one read were excluded from further analysis.
ACE, Chao1, Jackknife, and OTU counts were employed to assess species richness in the alpha diversity study (Burnham and Overton 1979; Chao 1987; Chao and Lee 1992;). NPShannon, Shannon/Simpson, and phylogenetic diversity were utilized to analyze species richness (Faith 1992; Chao and Shen 2003; Magurran 2021). The Jenson–Shannon, Bray–Curtis, Generalized UniFrac, and UniFrac methods were applied to examine the beta diversity distances, while PERMANOVA (Permutational Multivariate Analysis of Variance) assessed the significance of beta diversities between groups (Beals 1984; Lin 1991; Hamady et al. 2010; Chen et al. 2012;). The statistical comparison techniques of Kruskal–Wallis H tests and LEfSe (Linear Discriminant Analysis Effect Size) were employed to identify taxonomic biomarkers (Kruskal and Wallis 1952; Segata et al. 2011). Using PICRUSt (Phylogenetic Investigation of Communities by Reconstruction of Unobserved States), functional profiles of the samples were predicted based on KEGG (Kyoto Encyclopedia of Genes and Genomes) pathways (Douglas et al. 2020; Ye and Doak 2009). The data is considered statistically significant if the p-value is less than 0.05.
For comparative quantification of the genera Lactobacillus, Gilliamella, Bombella, and Frischella in each group, qRT-PCR was performed using BioRad CFX Connect™ real-time-system thermocyclers (Bio-Rad Laboratories, Inc., USA) and iQ™ SYBR"Green Supermix (Bio-Rad Laboratories, Inc., USA). Previously reported genus-specific primers (Table SI) were used for qPCR (Dubernet et al. 2002; Kwong et al. 2013; Emery et al. 2017; Yun et al. 2017). All the samples, along with a negative control (no template DNA), were used in this experiment. DNA samples were normalized to the same concentration prior to qPCR to ensure consistency and comparability across reactions. qPCR was conducted in triplicate using 10 ng of genomic DNA from each sample, 10 μl of 2× SYBR® Green Master Mix (Bio-Rad Laboratories, Inc., USA), 1 μl forward primer (1 μM), 1 μl reverse primer (1 μM), and qRT-PCR-grade water (QIAGEN, Germany) added until the total volume reached 20 μl for each reaction. Thermal cycling conditions were set as follows: initial denaturation at 95°C for 5 minutes, followed by 40 cycles of denaturation at 95°C for 10 seconds, and annealing/extension at 56°C for 30 seconds. Melting curve analysis was performed from 65°C to 95°C to confirm specificity.
The attributes were examined initially in 51 honey bees across three groups: 42 workers, five queens, and four drones (Fig. 1). After collecting the bees, they were separated according to their caste-specific traits (Fig. 1A). In the study, live bees were collected in a box (Fig. 1B) and transported to the laboratory. They were stored at –80°C for downstream processing (Fig. 1C). Body length and weight for each bee type were measured manually, revealing significant differences between the groups (Fig. 1D). The average body length of drones (16 mm) was slightly greater than that of queens (15 mm), while workers had the shortest average body length of 13 mm. Weight measurements exhibited a similar pattern, with drones weighing the most at 212 mg, followed by queens at 166 mg, and workers at 108.5 mg, highlighting the size and mass distinctions among bee types.
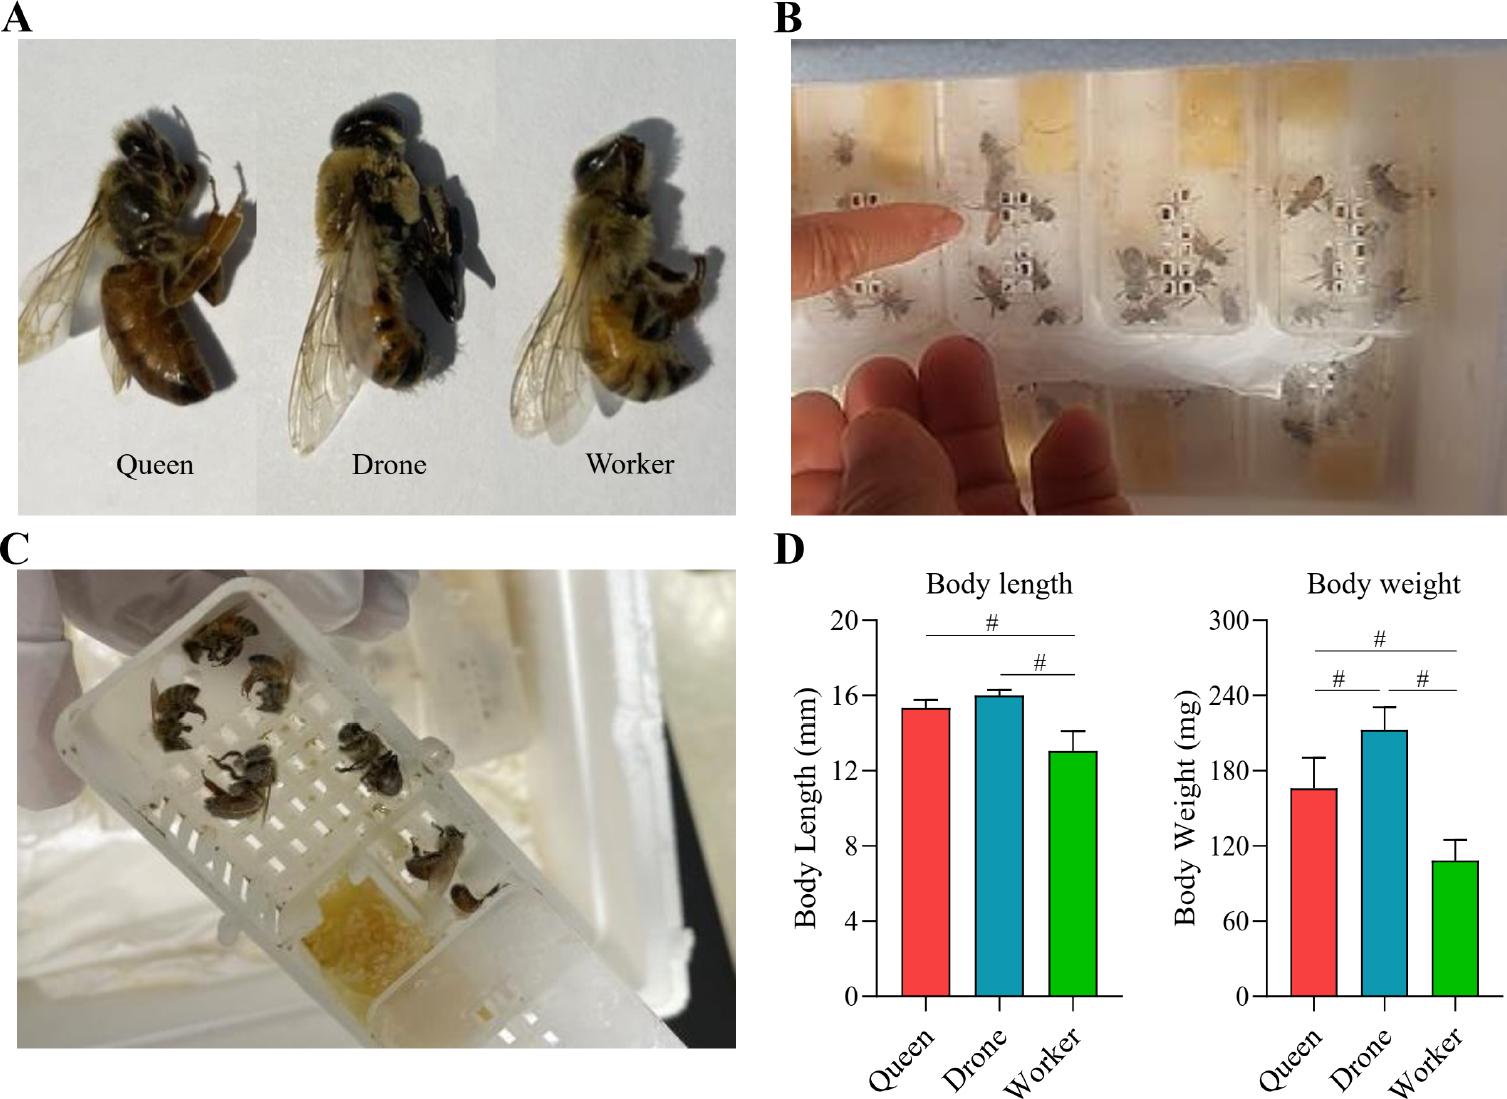
Baseline characteristics of the honey bee population studied.
A)Queen bees, worker bees, and drone bees were collected from the Chungnam region of Korea; B) live bees were collected in boxes; C) samples were stored at –80°C; D) body length and weight were manually measured prior to gut extraction. Distinct morphological differences were evident among the castes: drone bees had the most considerable body length and weight, worker bees were the smallest, and queen bees were intermediate in size. Significance among groups was analyzed using one-way ANOVA in GraphPad Prism v9.1.1 (GraphPad Software, USA, www.graphpad.com) (# – p < 0.0001).
The average taxonomic composition of worker, queen, and drone bees was examined at multiple levels – Phylum, Class, Order, Family, and Genus – to determine differences in microbial abundance and diversity (Fig. 2 and S2). These findings underscore significant variations among bee types with distinct statistical significance. Tables SII and SIII present the raw data, and only taxa with relative taxonomic abundances greater than 1% that showed significant differences were taken out and compiled in Table I.
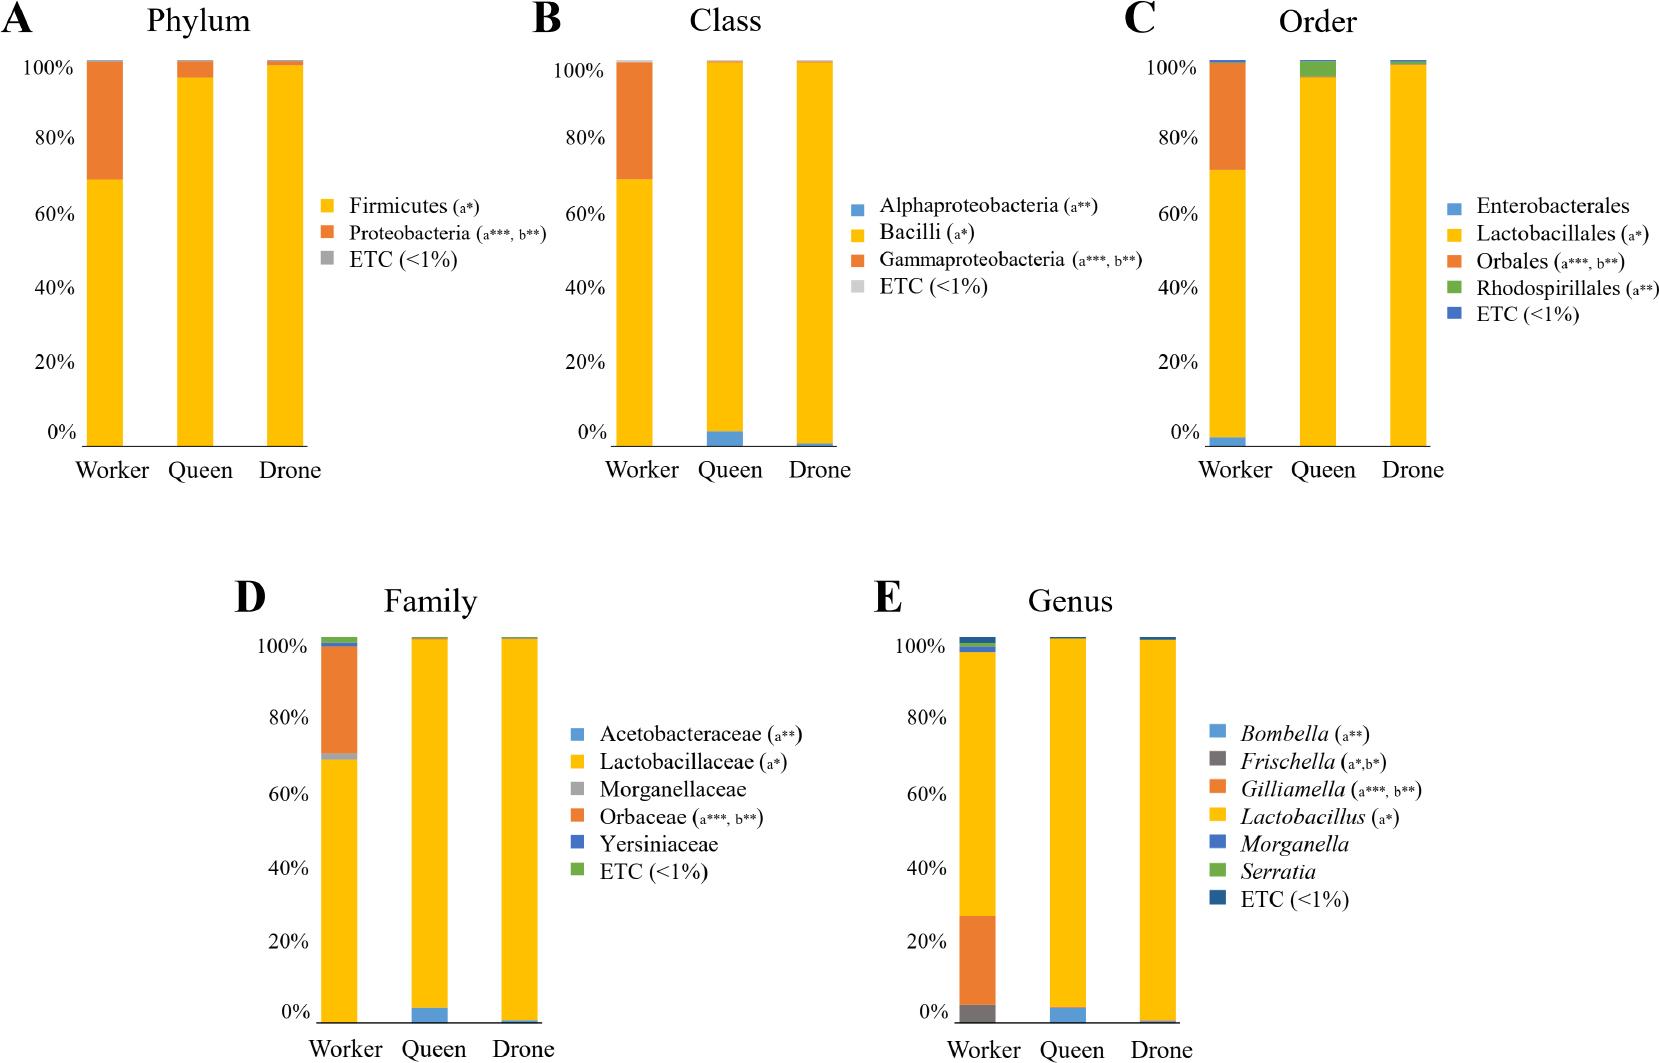
Mean taxonomic composition of the honey bee gut microbiome.
The taxonomic relative abundances across bee castes were classified at multiple levels: A) phylum, B) class, C) order, D) family, E) genus. Statistical significance among groups (*p < 0.05; **p < 0.01; ***p < 0.001) was analyzed using the Wilcoxon rank-sum test, and relative abundances below 1% are represented as “ETC”. Overall, drone and queen bees exhibited similar levels of taxonomic diversity, with no significant taxa identified between them. In contrast, worker bees showed greater taxonomic diversity compared to the other two castes, with several significant taxa identified. Significant differences compared to worker bees are indicated as “a” for queen bees and “b” for drone bees.
Average taxonomic composition of significantly different taxa among worker, queen, and drone bees.
| Phylum | W (%) | Q (%) | D (%) | Class | W (%) | Q (%) | D (%) | Order | W (%) | Q (%) | D (%) | Family | W (%) | Q (%) | D (%) | Genus | W (%) | Q (%) | D (%) |
| Firmicutes | 69.0 | 95.4 a* | 98.6 | Bacilli | 69.0 | 95.4 a* | 98.6 | Lactobacillales | 69.0 | 95.4 a* | 98.6 | Lactobacillaceae | 68.3 | 95.4 a* | 98.6 | Lactobacillus | 68.3 | 95.4 a* | 98.6 |
| Proteobacteria | 30.4 | 4.3 a*** | 1.0 b** | Gammaproteobacteria | 30.3 | 0.3 a*** | 0.3 b** | Orbales | 27.7 | 0.3 a*** | 0.2 b** | Orbaceae | 27.7 | 0.3 a*** | 0.2 b** | Gilliamella | 23.0 | 0.2 a*** | 0.2 b** |
| Frischella | 4.7 | 0.1 a* | 0.0 b* | ||||||||||||||||
| Alphaproteobacteria | 0.1 | 4.0 a** | 0.8 | Rhodospirillales | 0.1 | 4.0 a** | 0.8 | Acetobacteraceae | 0.1 | 4.0 a** | 0.8 | Bombella | 0.1 | 4.0 a** | 0.5 |
Only taxa with a relative abundance composition of 1% or higher that showed significant differences according to the Wilcoxon ranksum test are presented
p < 0.05;
p < 0.01;
p < 0.001.
No significant differences in taxa were observed between queen (Q) and drone (D) bees. Significant differences compared to worker (W) bees are indicated as “a” for queen (Q) bees and “b” for drone (D) bees.
The gut microbiome of honey bee castes reveals striking caste-specific microbial profiles. The phylum-level data (Fig. 2A) showed that Firmicutes dominate the gut microbiome of all honey bee casts, with the highest abundance in queens (95.4%) and the lowest in workers (69.0%). In contrast, Proteobacteria were more prevalent in workers (30.4%) compared to queens (4.3%) and drones (1.0%). At the class level (Fig. 2B), Bacilli predominated in drones (98.6%) and queens (95.4%), with significant differences between workers and queen (p < 0.05) compared to workers (69.0%). Alphaproteobacteria were more prevalent in queens (4.0%) and drones (0.8%) compared to workers (0.1%), with statistical significance between workers and queens (p ≤ 0.01). In comparison, Gammaproteobacteria showed a greater abundance in workers (30.3%) than in queens and drones (0.3% each), with significant differences between workers and queens (p ≤ 0.001) and workers and drones (p ≤ 0.01). At the order level (Fig. 2C), Lactobacillales dominated in queens (95.4%) and drones (98.6%) compared to workers (69.0%) with significant worker-queen (p ≤ 0.05) differences. Orbales was highly abundant in workers (27.7%) but minimal in queens (0.3%) and drones (0.2%), showing significant differences for both worker-queen (p ≤ 0.001) and worker-drone (p ≤ 0.01) comparisons. At the family level (Fig. 2D), Lactobacillaceae was prominent in queens (95.4%) and drones (98.6%) versus workers (68.3%), showing significant worker-queen (p ≤ 0.05) differences. In contrast, Orbaceae was abundant in workers (27.7%) but low in queens (0.3%) and drones (0.2%), with highly significant differences between workers and queens (p ≤ 0.001) and workers and drones (p ≤ 0.01). Acetobacteraceae showed a higher abundance in queens (4.0%) and drones (0.8%) compared to workers (0.1%), with significant differences in worker-queen comparisons (p ≤ 0.01). At the genus level (Fig. 2E and S2), Lactobacillus, the most prevalent genus, was dominant in queens (95.4%) and drones (98.6%) compared to workers (68.3%), showing significant worker-queen (p ≤ 0.05) differences. Bombella was more prevalent in queens (4.0%) than workers (0.1%) and drones (0.5%), with significant worker-queen differences (p ≤ 0.01), and Frischella and Gilliamella showed greater presence in workers, with significant worker-queen (p ≤ 0.05, p ≤ 0.001) and worker-drone (p ≤ 0.05, p ≤ 0.01) differences, respectively. Consequently, according to the taxonomic lineage, queens and drones exhibited a high abundance of Lactobacillales members, such as Lactobacillus, whereas workers predominantly featured Gammaproteobacteria, particularly the order Orbales and family Orbaceae.
The analysis of species richness metrics, including ACE, CHAO, Jackknife, and OTU counts, revealed no significant differences among worker, queen, and drone bees (Fig. 3 and Table SIV). The p-values for all pairwise comparisons across these richness metrics were above the typical threshold for significance (p > 0.05), indicating similar levels of species richness across castes (Fig. 3A–3C). The p-value closest to significance was observed in the OTU counts between workers and queens (p = 0.070), yet this did not reach statistical significance (Fig. 3D).
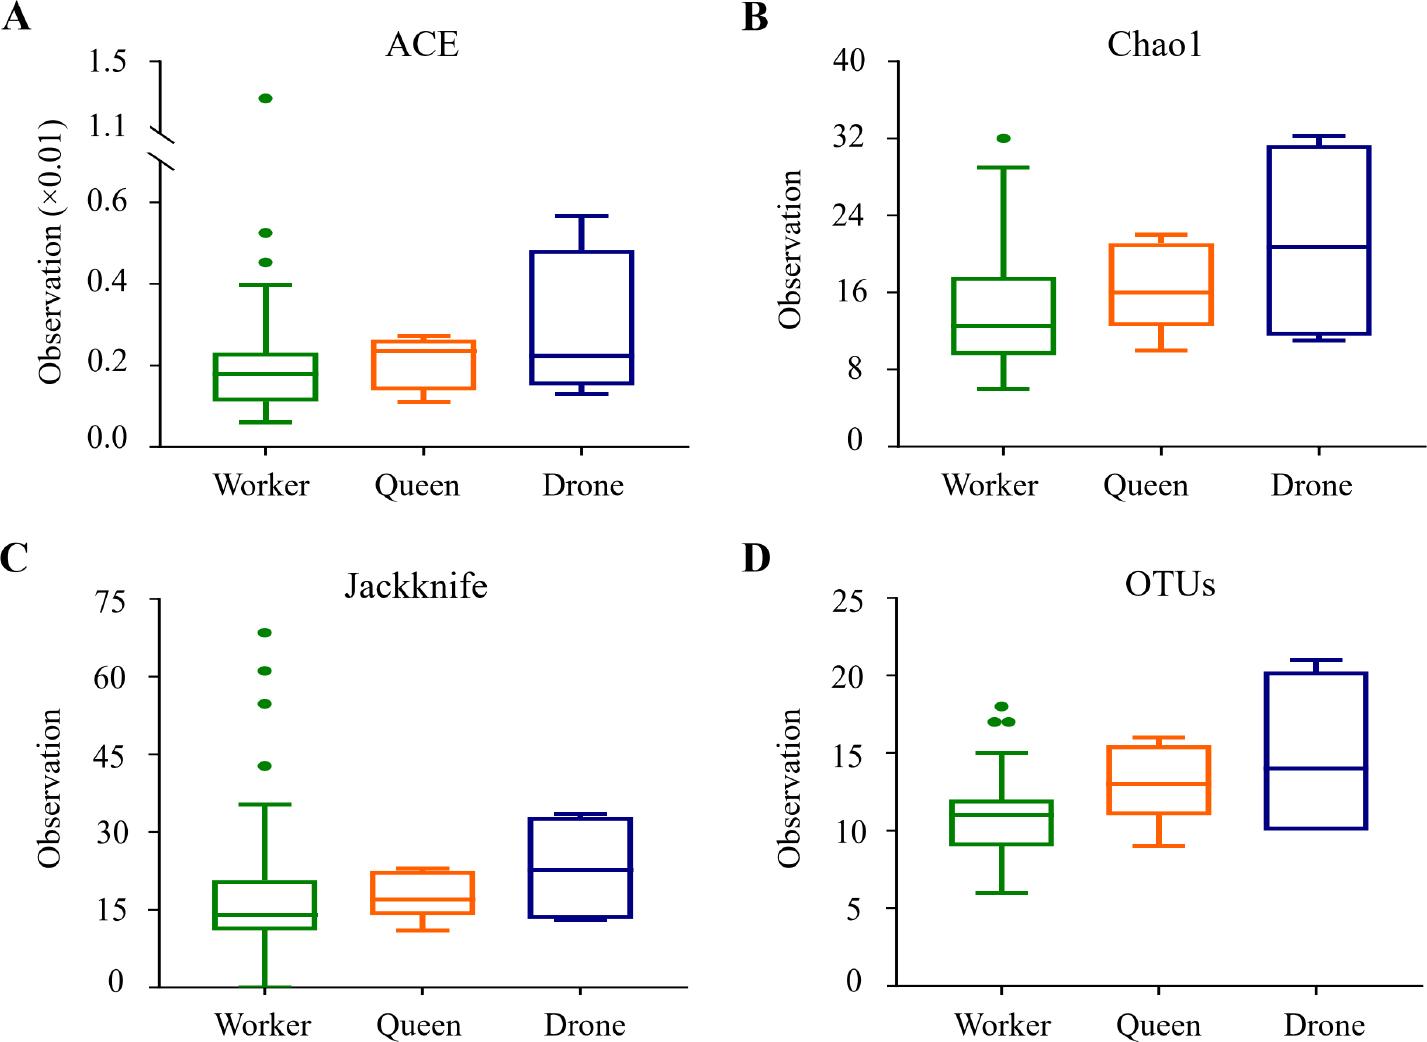
Box plots of species richness indices among honey bee groups.
Species richness was analyzed using A) Ace, B) Chao1, C) Jackknife indices, D) OTUs (Operational Taxonomic Units) counts. The bars represent the median values, while the hinges indicate the lower and upper quartiles. No statistically significant differences were observed among the three bee castes.
In contrast, species diversity metrics – NPShannon, Shannon, and Simpson indices – showed significant differences between workers and both queens and drones (Fig. 4 and Table SIV). The NPShannon and Shannon indices yielded highly significant p-values for worker-queen (p = 0.002) and worker-drone (p = 0.001) comparisons (Fig. 4A and 4B). Simpson index results similarly indicated significant diversity differences, with comparisons between workers and both queens and drones yielding a p-value of 0.001. However, no significant differences in diversity were observed between drones and queens (p = 0.327 for all indices) (Fig. 4C). Phylogenetic diversity revealed no significant differences across comparisons, with all p-values above 0.05 (Fig. 4D). While species richness is consistent across bee castes, species diversity is notably higher in worker bees than in queens and drones, highlighting a distinct microbial diversity profile within the worker caste.
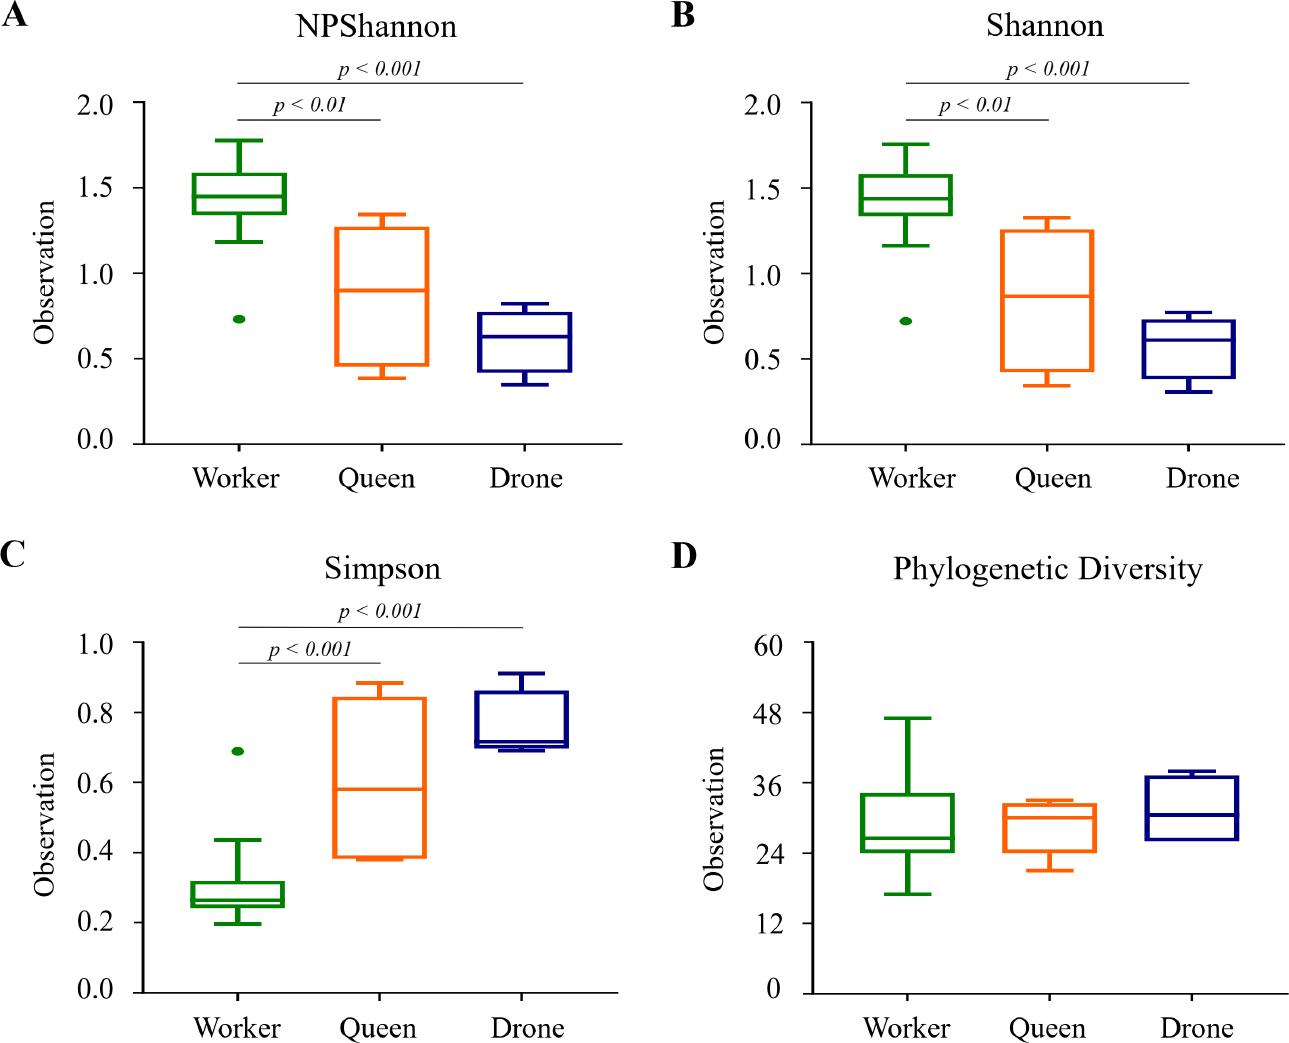
Box plots of species diversity indices among honey bee groups.
Species diversity was analyzed using A) NPShannon, B) Shannon, C) Simpson, and D) Faith’s phylogenetic diversity indices. The results indicate that worker bees exhibited significantly higher species diversity compared to queen and drone bees in the NPShannon, Shannon, and Simpson analyses. No differences were observed between queen and drone bees. The bars represent the median values, while the hinges indicate the lower and upper quartiles.
Distinct microbial community structures characterize the honey bee castes, with significant divergence observed among the groups. A PCoA (Principal Coordinate Analysis) was conducted using four diversity metrics: Bray–Curtis, Jensen–Shannon, Generalized UniFrac, and UniFrac (Fig. 5). Jensen–Shannon and Bray–Curtis analyses reveal minimal differentiation across castes (p > 0.05), with the Bray–Curtis measure approaching significance in the worker-queen comparison (p = 0.078). However, Generalized UniFrac and UniFrac metrics reveal statistically significant differences in microbial composition, particularly between workers and queens (p = 0.031 and p = 0.003, respectively) and workers and drones (p = 0.050 and p = 0.007, respectively) (Table II). These findings elucidate that drone and queen groups exhibit broadly similar distribution patterns, but the microbial community in workers is unique, underscoring their cast-specific microbiome differentiation.
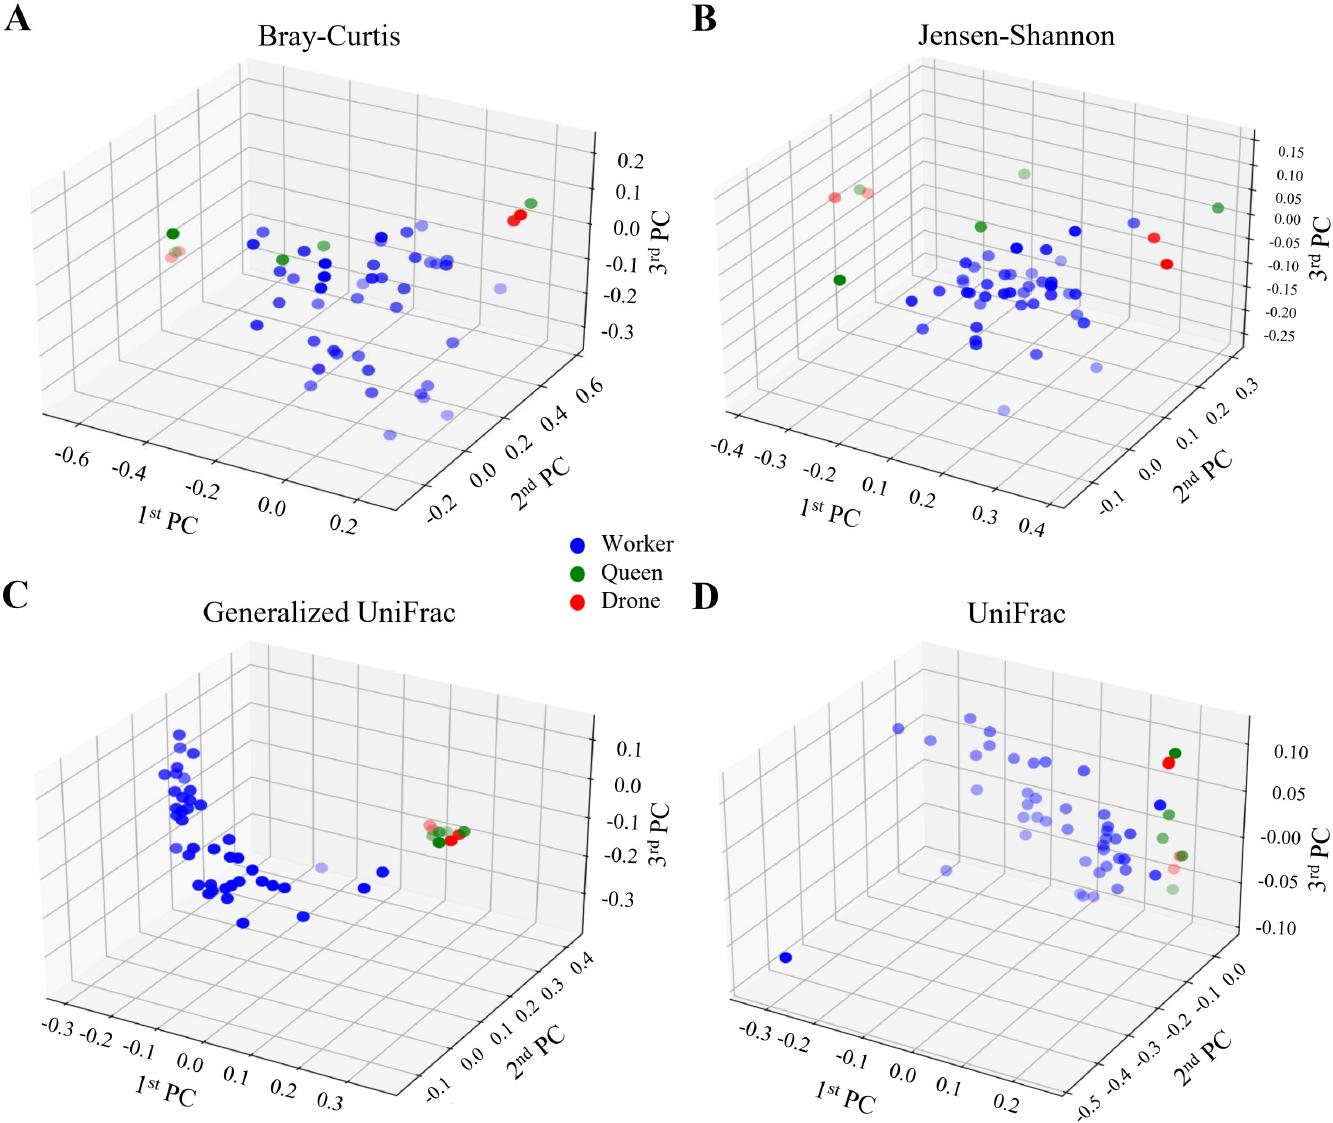
Principal coordinate analysis (PCoA) of the gut microbiome across bee castes.
PCoA was conducted using four distance metrics to investigate the microbial community structure among bee castes: A) Bray–Curtis, B) Jensen–Shannon divergence, C) Generalized UniFrac, D) UniFrac. The results are visualized in 3D plots, with blue, green, and red circles representing the worker, queen, and drone bee groups, respectively. The scatter of points illustrates the dissimilarities in microbial community composition among the castes. The analysis reveals that the microbial communities of worker bees are distinct from those of queen and drone bees.
Beta diversity index among the honey bee castes.
| Index | Worker-Queen | Worker-Drone | Drone-Queen |
|---|---|---|---|
| Bray–Curtis | NS (p = 0.078) | NS (p = 0.301) | NS (p = 0.313) |
| Jensen–Shannon | NS (p = 0.438) | NS (p = 0.581) | NS (p = 0.644) |
| Generalized UniFrac | * (p = 0.031) | * (p = 0.050) | NS (p = 0.495) |
| UniFrac | ** (p = 0.003) | ** (p = 0.007) | NS (p = 0.835) |
The significance of the beta diversity index among groups was determined using PERMANOVA (Permutational Multivariate Analysis of Variance).
– p ≤ 0.05;
– p ≤ 0.01;p > 0.05 – not significant (NS)
A clustering analysis using the unweighted pair group method with arithmetic mean (UPGMA) was conducted to assess the relationships among groups, as illustrated in Fig. 6. The analysis showed that workers were the most predominant group, with a prominent presence. Conversely, queens and drones were more evenly distributed across the cluster, showing a balanced pattern without noticeable skew or bias towards either group.
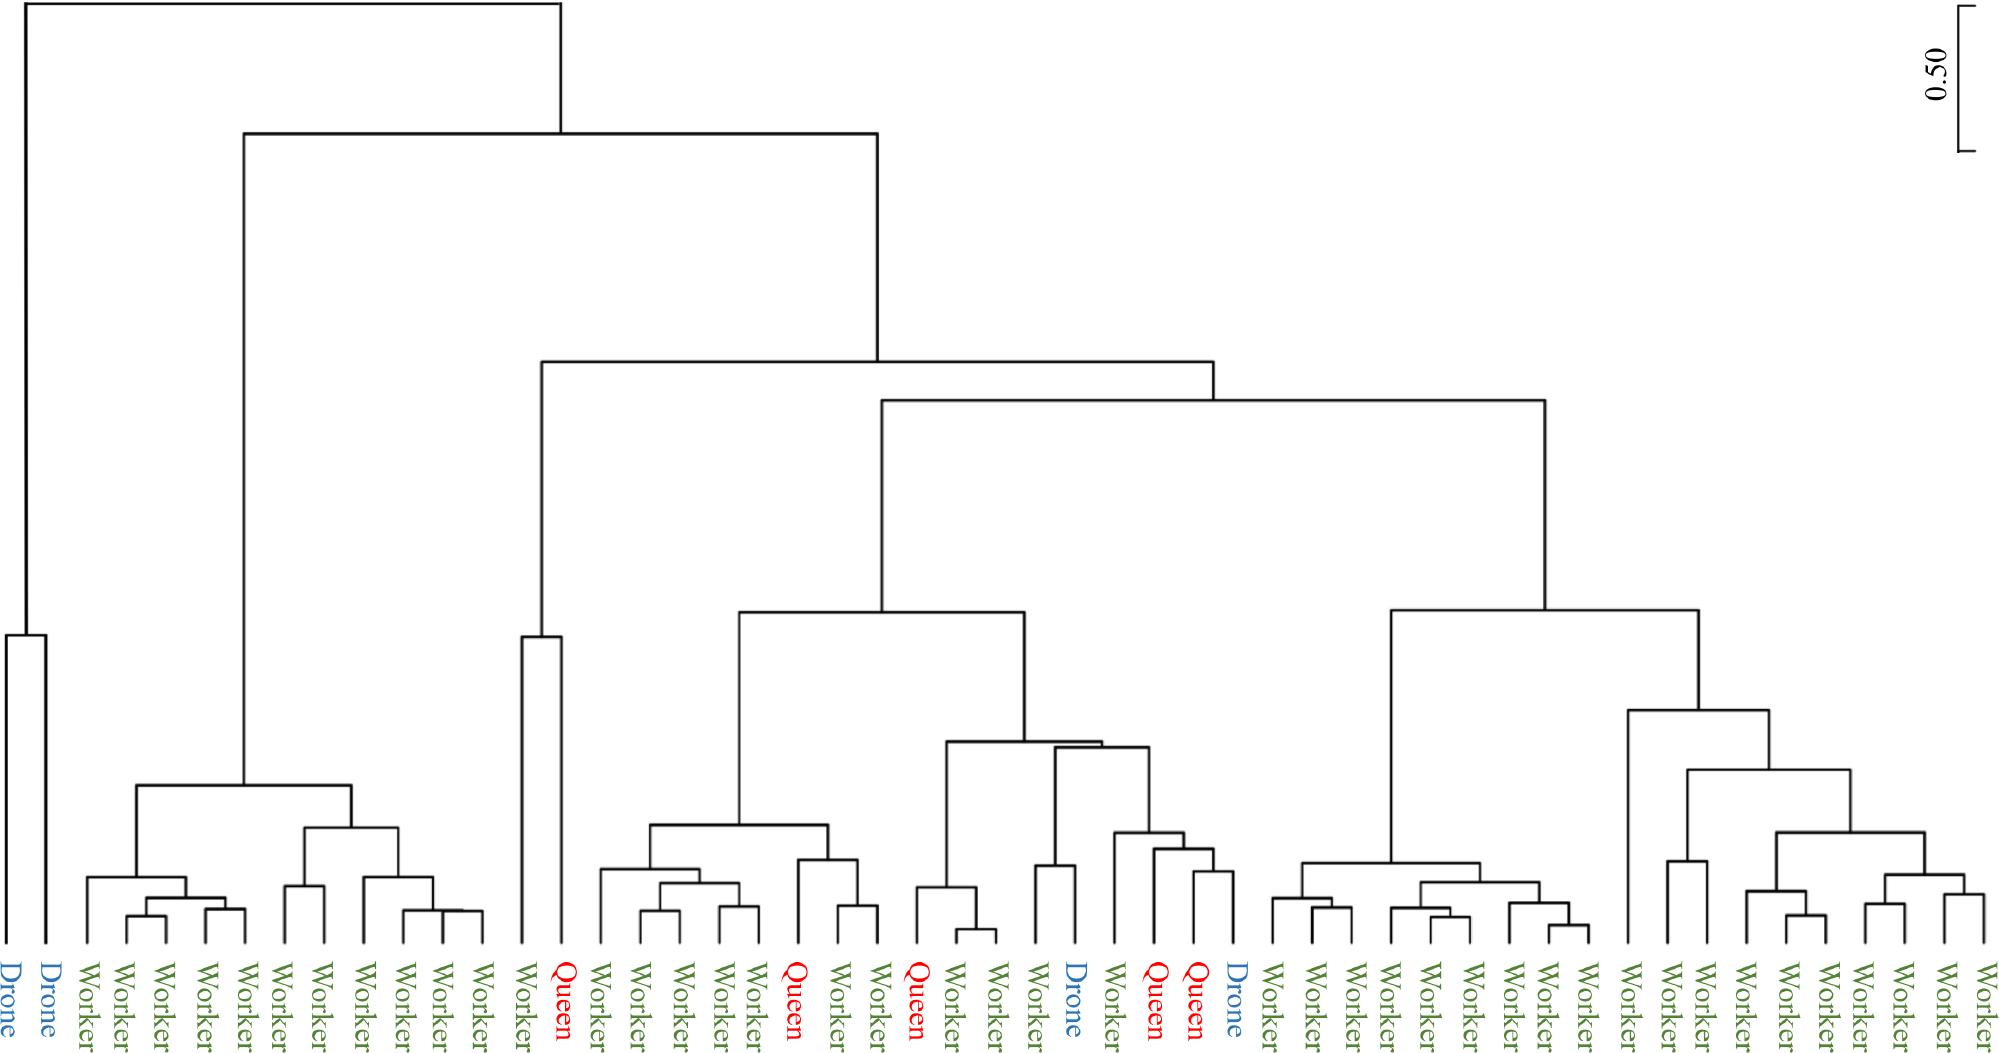
UPGMA clustering analysis of gut microbiome profiles among honey bee castes.
The UPGMA (Unweighted Pair Group Method with Arithmetic Mean) clustering method was used to analyze the gut microbiome profiles of the three honey bee castes: worker, queen, and drone. The dendrogram illustrates the hierarchical grouping of these castes based on the similarity of their gut microbiome compositions. The results highlight the distinctiveness of workers and the relative similarity and closer grouping of queens and drones.
Taxonomic biomarkers among groups were investigated with LEfSe analysis and the Kruskal–Wallis H test (Fig. 7 and Table SV). Only taxa with an LDA (linear discriminant analysis) score of 3 or higher, indicating significant differences in the Kruskal–Wallis H test, were identified as potential biomarkers and are detailed. The relative taxonomic composition between honey bee groups revealed several lineages as potential biomarkers distinguishing workers, queens, and drones. A significant reduction in the Gammaproteobacteria class, Orbales order, Orbaceae family, and Gilliamella genus lineage in queens and drones, compared to workers, emerged as a critical biomarker for workers. In contrast, relative to queens, a notable decrease in the Rhodospirillales order, Acetobacteraceae family, and Bombella genus lineage among workers and drones underscored a distinctive biomarker profile for the queens. Additionally, the increased abundance of the Lactobacillales order, Lactobacillaceae family, and Lactobacillus genus lineage in drones, compared to workers and queens, designates this lineage as a unique biomarker for the drones. These results highlight specific microbial signatures unique to each honey bee group, potentially indicating functional adaptations in gut microbiota composition.
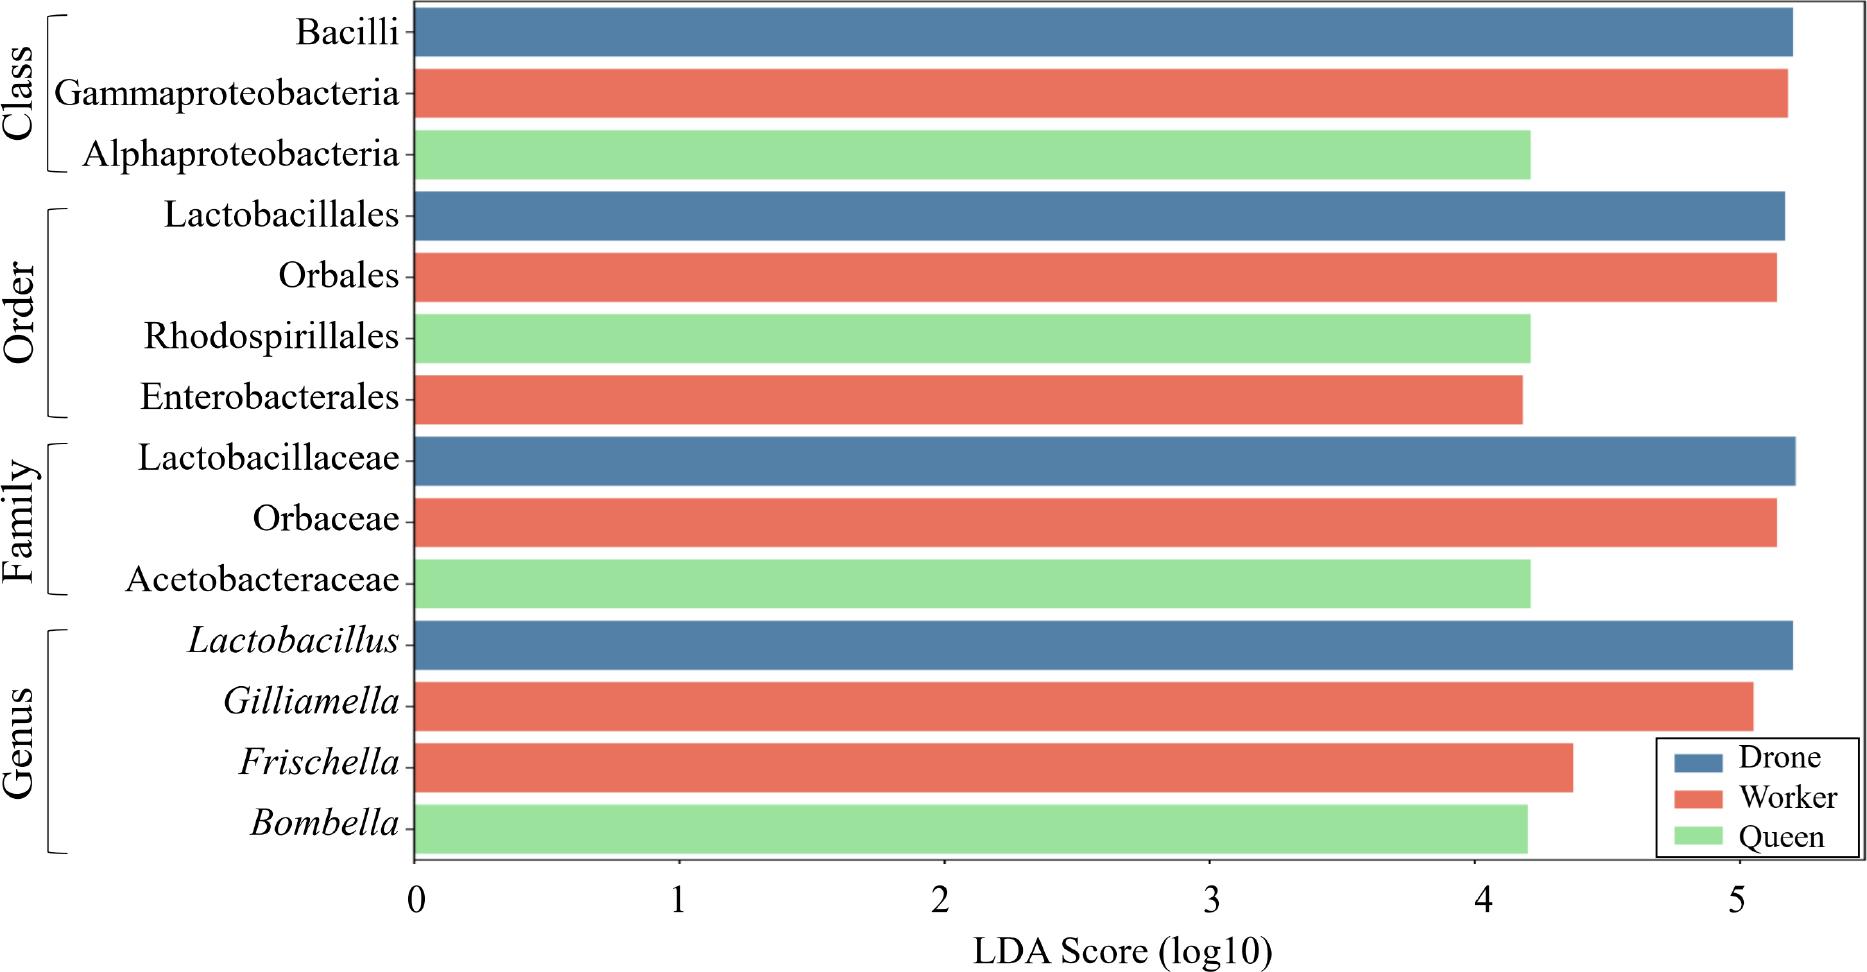
Taxonomic biomarker analysis of gut microbiome differences among bee castes using LEfSe (LDA Effect Size).
Based on LEfSe analysis, taxonomic cladograms highlight significant biomarkers among bee castes with a Kruskal–Wallis p-value < 0.05 and an LDA score > 4. The analysis identified distinct microbial features for each caste: Lactobacillus as a biomarker for drones, Gilliamella and Frischella as biomarkers for workers, and Bombella as a biomarker for queens. The taxa presented represent key microbial markers that differentiate the bee groups, providing insights into caste-specific microbial community compositions.
Quantitative analysis using qRT-PCR was performed to examine the relative abundance of the Lactobacillus, Gilliamella, Bombella, and Frischella genera in the gut microbiomes of the three honey bee castes (Fig. 8). The results revealed distinct bacterial distribution patterns across castes, consistent with previous NGS findings. For Lactobacillus, workers exhibited a lower abundance than drones and queens; however, these differences were not statistically significant (Fig. 8A). Conversely, the Gilliamella load was higher in workers than in drones and queens, but no significant differences were observed (Fig. 8B). In contrast, the analysis of Bombella and Frischella revealed statistically significant variations. Queens harbored a markedly higher abundance of Bombella than workers and drones (***, p < 0.001; Fig. 8C). Regarding Frischella, workers showed significantly elevated levels compared to queens (***, p < 0.001) and drones (**, p < 0.01; Fig. 8D). These findings, corroborating trends observed in NGS data, provide robust evidence for the differential abundance of key bacterial genera in the gut microbiomes of honeybee castes.
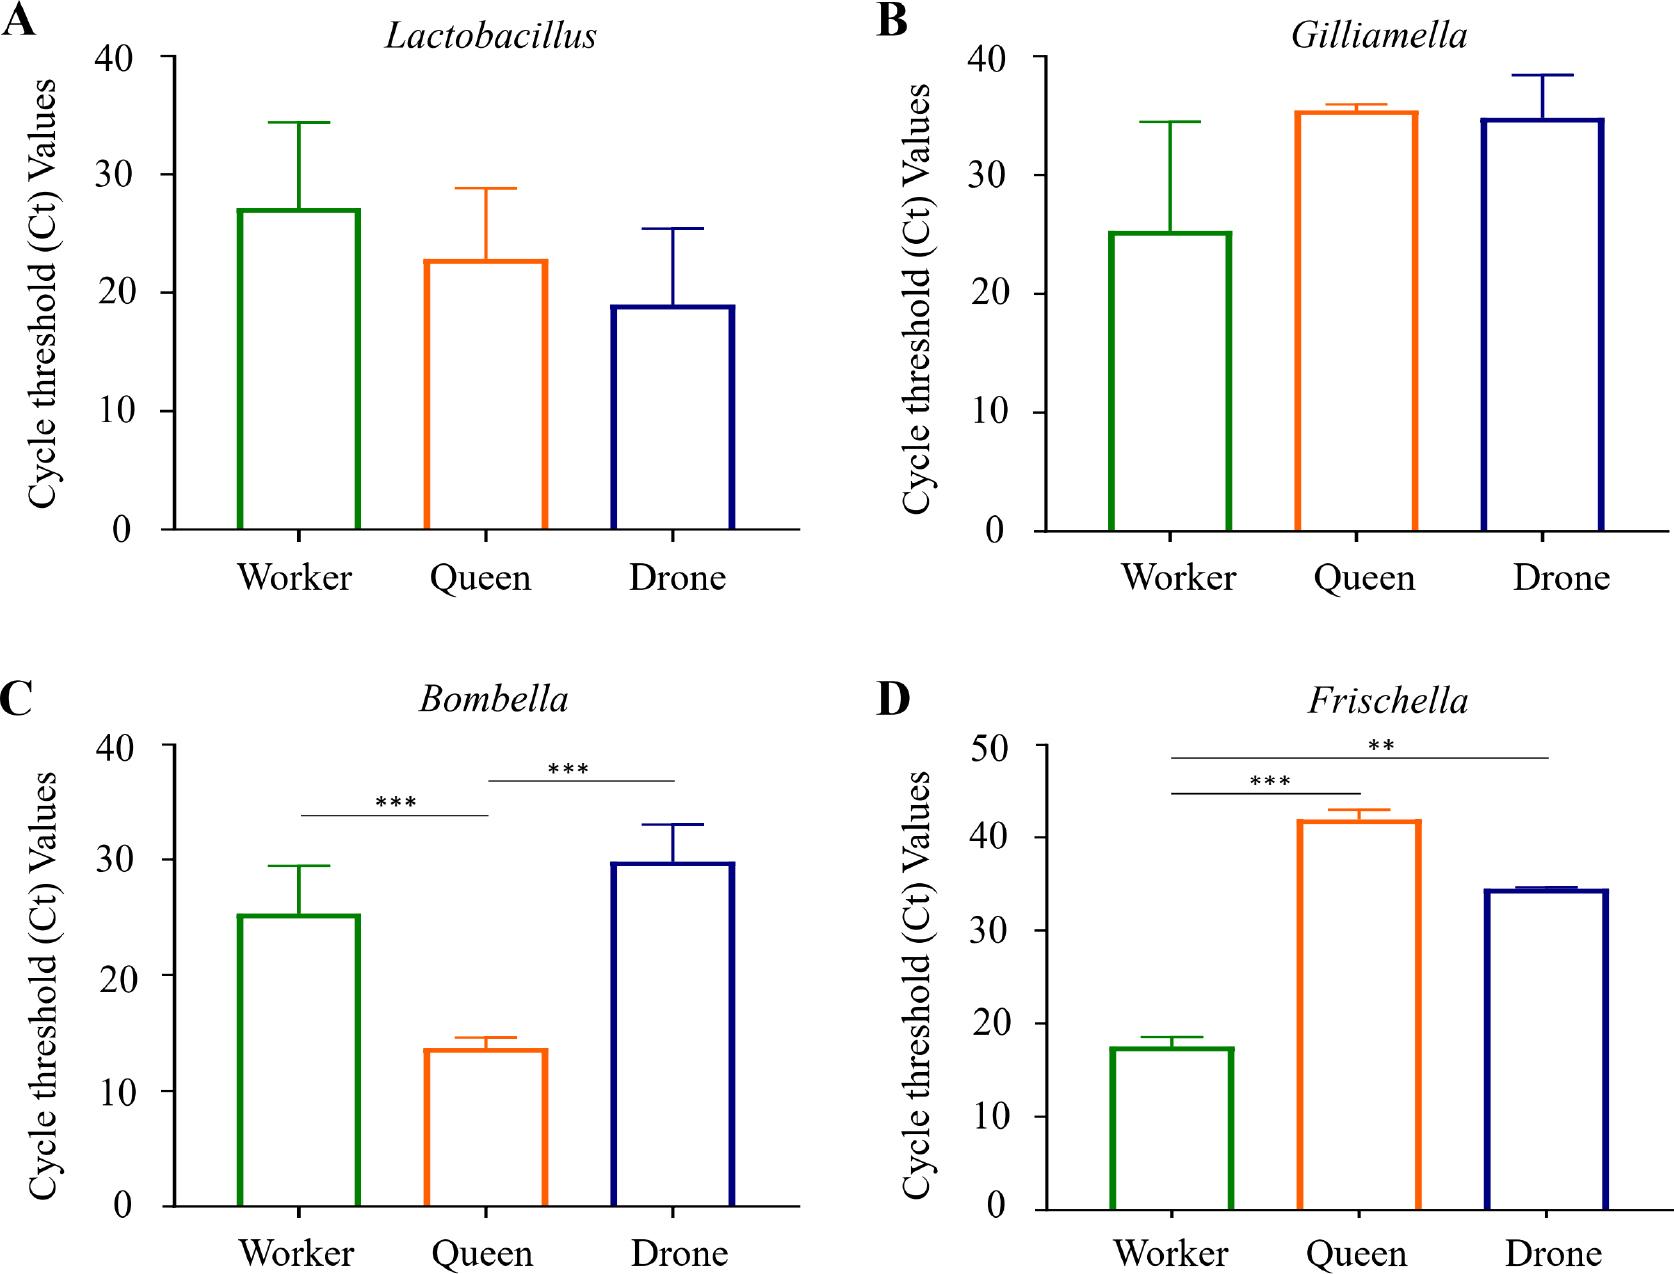
PCR validation of biomarker strains across the three honey bee castes.
The bacterial load of A) Lactobacillus, B) Gilliamella, C) Bombella, D) Frischella in the samples was quantified using qRT-PCR. The results confirmed the biomarker status of each strain: Lactobacillus had the lowest Ct values in drones, Gilliamella and Frischella in workers, and Bombella in queens. Statistical significance among groups was determined using one-way ANOVA (**p < 0.01; ***p < 0.001).
An analysis of functional biomarker predictions was performed for the three honey bee castes: workers, queens, and drones (Table III). Based on LEfSe analysis, several orthologies, modules, and pathways with an LDA effect size greater than 2 were identified as functional biomarkers. Notably, variations in these biomarkers highlight potential functional adaptations among the castes. Among the orthologies, the ‘Type VI secretion system secreted protein VgrG (K11904)’ was exclusively identified in workers, with no detectable presence in queens or drones. Orthologies such as ‘Oligopeptide transport system substrate-binding protein (K15580)’ and ‘Succinate-diaminopimelate desuccinylase (K01439)’ were more abundant in queens and drones compared to workers. Several modules were enriched across the castes. For instance, the ‘Ribosome, bacteria’ module (K02945) showed the highest LDA effect size, with slightly greater representation in queens and drones than in workers. Similarly, the ‘Peptides/nickel transport system’ module was more abundant in queens and drones compared to workers. Interestingly, workers had a unique enrichment in the ‘Type VI secretion system’ module (K11904), which was absent in the other two castes. Pathway-level analysis revealed significant differences in metabolic and transport pathways. ‘Metabolic pathways’ and ‘Microbial metabolism in diverse environments’ showed consistent representation across all three castes, with slightly higher levels in queens and drones. In contrast, the ‘Flagellar assembly’ pathway was predominantly present in workers. Modules involved in transport systems, such as the ‘Erythritol transport system’ and the ‘Lantibiotic transport system,’ were enriched in queens and drones compared to workers. Similarly, pathways related to amino sugar and nucleotide sugar metabolism were notably more abundant in queens and drones.
Prediction of functional biomarkers for the three honey bee castes.
| Ortholog | Definition | LDA effect size | p-value | Worker (%) | Queen (%) | Drone (%) | |
|---|---|---|---|---|---|---|---|
| Orthology | K11904 | Type VI secretion system secreted protein VgrG | 3.1 | 0.000 | 0.2 | 0.0 | 0.0 |
| K15580 | Oligopeptide transport system substrate-binding protein | 2.9 | 0.007 | 0.1 | 0.2 | 0.2 | |
| K07052 | Uncharacterized protein | 2.9 | 0.000 | 0.2 | 0.3 | 0.3 | |
| K01439 | Succinyl-diaminopimelate desuccinylase | 2.9 | 0.042 | 0.1 | 0.2 | 0.2 | |
| K10947 | PadR family transcriptional regulator, regulatory protein PadR | 2.9 | 0.002 | 0.1 | 0.3 | 0.2 | |
| Module (PICRUSt) | K02945 | Ribosome, bacteria | 3.7 | 0.042 | 5.7 | 6.8 | 6.6 |
| K11904 | Type VI secretion system | 3.6 | 0.000 | 0.8 | 0.0 | 0.0 | |
| K02035, K02031, K02032 | Peptides/nickel transport system | 3.4 | 0.000 | 0.9 | 1.3 | 1.3 | |
| K00798, K02226 | Cobalamin biosynthesis, cobinamide => cobalamin | 3.3 | 0.060 | 0.4 | 0.8 | 0.7 | |
| K15580 | Oligopeptide transport system | 3.3 | 0.002 | 0.3 | 0.7 | 0.6 | |
| Module (MinPath) | K17204 | Erythritol transport system | 3.2 | 0.000 | 0.3 | 0.5 | 0.6 |
| K02052 | Putative spermidine/putrescine transport system | 3.2 | 0.000 | 0.3 | 0.6 | 0.6 | |
| K20491, K20492 | Lantibiotic transport system | 3.1 | 0.000 | 0.2 | 0.5 | 0.5 | |
| K11195 | PTS system, fructose-specific II component | 3.1 | 0.000 | 0.3 | 0.6 | 0.6 | |
| K12536 | Hemophore/metalloprotease transport system | 3.1 | 0.000 | 0.2 | 0.4 | 0.4 | |
| Pathway (PICRUSt) | K00010, K00011, K00015, K00016 | Metabolic pathways | 3.7 | 0.001 | 15.9 | 16.7 | 16.7 |
| K01995, K02031, K02032, K02035 | Quorum sensing | 3.3 | 0.000 | 1.6 | 2.1 | 2.1 | |
| Flagellar assembly | 3.3 | 0.000 | 0.4 | 0.1 | 0.0 | ||
| K02945 | Ribosome | 3.2 | 0.006 | 2.0 | 2.4 | 2.3 | |
| K00010, K00015, K00016, K00033 | Microbial metabolism in diverse environments | 3.2 | 0.000 | 4.8 | 5.1 | 5.1 | |
| Pathway (MinPath) | K00466 | Tryptophan metabolism | 3.6 | 0.000 | 0.8 | 1.5 | 1.6 |
| K00965, K01198, K02790, K02791 | Amino sugar and nucleotide sugar metabolism | 3.5 | 0.000 | 1.0 | 1.5 | 1.6 | |
| K01259 | Arginine and proline metabolism | 3.5 | 0.000 | 1.1 | 1.8 | 1.8 | |
| K00011, K00965, K01785, K02744 | Galactose metabolism | 3.5 | 0.000 | 0.7 | 0.1 | 0.1 | |
| K13993 | Protein processing in endoplasmic reticulum | 3.4 | 0.000 | 1.2 | 1.7 | 1.7 | |
A balanced gut microbiome plays a crucial role in honey bee health, influencing immunity, metabolism, and resilience against pathogens (El-Seedi et al. 2022; Wang et al. 2022). Recent studies have demonstrated the role of the microbiome in managing not only infectious diseases but also metabolic diseases (Kim et al. 2024; Rahim et al. 2024; Hossain et al. 2025). However, environmental stressors such as disease, chemical exposure, and habitat loss have disrupted these microbial communities, contributing to colony decline (Hristov et al. 2020). The significance of this study lies in its exploration of the potential impacts of environmental factors on the honey bee gut microbiome.
Our analysis revealed significant differences in the gut microbiome composition among the three honey bee castes, with worker bees displaying distinct microbial profiles compared to queens and drones. Gammaproteobacteria were significantly enriched in workers, aligning with previous research (Martinson et al. 2012; Jones et al. 2021). Conversely, Lactobacillales predominated in the microbiomes of queens and drones. Lactobacillus was the most abundant genus across all castes, comprising 68.29% in workers, 95.36% in queens, and 98.57% in drones, underscoring its role in honey bee immunity and digestion (Ellegaard et al. 2015; Dong et al. 2020; Khan et al. 2020a). Its higher prevalence in queens and drones enables them to perform additional functions in reproductive health and nutrient absorption tailored to their specific biological needs (Genç and Genç 2019). Moreover, Lactobacillus species may act as natural probiotics, contributing to improved immunity during overwintering periods, offering protection against pathogens, and mitigating the effects of pesticide-induced stress (Rahim et al. 2022; Hossain et al. 2024; Barman et al. 2025). Their functional roles are not only important for individual health but may also influence caste differentiation and overall colony resilience through the microbial regulation of hormonal and nutritional pathways (Mudroňová et al. 2011; Brar et al. 2025; Pradeep et al. 2025). Gilliamella, a key component of the worker microbiome, constituted 23% of their bacterial community but was sparse in queens (0.23%) and drones (0.17%). This genus is associated with carbohydrate digestion and the breakdown of complex plant chemicals, reflecting the workers’ foraging role and diverse diet (Bridson 2020). The microbiome differences likely underscore caste-specific adaptations to ecological roles and biological functions (Zheng et al. 2016; Lee et al. 2018; Dong et al. 2020). Frischella is more abundant in workers (4.68%) than in queens and drones and is known to activate the host immune system, influencing gut immunity and homeostasis. An increased abundance of Frischella is associated with dietary changes and abnormal host development (Maes et al. 2016; Emery et al. 2017). However, the Bifidobacterium and Frischella genera can serve as bacterial indicators for assessing the age of the bees (Anderson et al. 2018). These caste-specific microbial profiles highlight the microbiome’s role in supporting the biological functions and needs of each bee caste. Bombella is present in both worker (0.10%) and queen bees (3.96%), with a higher concentration in queens, and is linked to fermentation and immune system support through antimicrobial compounds. The higher Bombella levels in queens may help protect them from infections, supporting their reproductive health, which is essential for colony survival (Li et al. 2023; Miller 2023).
Caste-specific enrichment patterns were found in the projected functional profiles, indicating that the gut microbiome is functionally specialized across honey bee castes. Due to their increased exposure to the environment while foraging, worker bees showed a notable enrichment of the Type VI secretion system (K11904), which is frequently associated with interbacterial competition and immunological regulation (Evans et al. 2006). Queens and drones, on the other hand, had higher amounts of pathways linked to the metabolism of amino sugars and nucleotide sugars, as well as the metabolism of arginine and proline – functions that may be connected to energy regulation and reproductive processes (Li et al. 2023). Furthermore, caste-specific enrichment in quorum sensing and cobalamin biosynthesis pathways may facilitate microbial communication and vitamin B12 metabolism, supporting host physiology and gut stability in general (Kwong 2015).
In terms of alpha diversity, workers exhibited significantly greater species diversity compared to queens and drones, as measured by Shannon, Simpson, and Phylogenetic Diversity indices. This elevated diversity is likely a reflection of their environmental exposure during foraging activities, which introduces a broader range of microbial taxa into the gut (Engel et al. 2012; Zheng et al. 2018). Queens and drones, in contrast, showed lower alpha diversity, consistent with their more restricted diets and limited environmental interaction (Bridson 2020). These findings support the concept that diet and environmental contact are key drivers of microbial richness in eusocial insects. Beta diversity analysis further demonstrated distinct clustering of worker microbiota compared to those of queens and drones, indicating significant compositional differences between castes. Principal Coordinates Analysis (PCoA) plots based on Generalized UniFrac dissimilarity and UniFrac distance revealed clear separation of the worker samples, while queens and drones clustered closely together. These results suggest that caste-related factors, such as task allocation, physiology, and dietary inputs, powerfully shape microbial community structure (Kapheim et al. 2015).
The composition of the honey bee gut microbiome varies across regions and is influenced by environmental factors, diet, and social behaviors (Jones et al. 2018). In various countries, including the U.S. and European regions, honey bees consistently exhibit a core gut microbiota dominated by phyla such as Firmicutes (e.g., Lactobacillus and Bifidobacterium), Proteobacteria (e.g., Gilliamella and Snodgrassella), and occasionally Actinobacteria (Moran et al. 2012; Powell et al. 2014). This pattern closely aligns with our study, suggesting a globally conserved microbiome composition among honey bees of different castes. In the USA, research indicates a dominance of Gilliamella and Snodgrassella among workers, reflecting their diet of pollen and nectar processed in a high-protein, colony-specific environment (Copeland et al. 2022; Anderson and Copeland 2024). European honey bee populations have shown a higher prevalence of Fructobacillus and Bombella, likely related to differences in floral resources (Praet et al. 2018). All castes of Korean honey bees exhibit a notable predominance of Lactobacillus, which may be a result of regional diets and beekeeping techniques, such as the use of fermented pollen and nectar products. However, it is essential to note that Lactobacillus is a common environmental bacterium that can be acquired through exposure to pollen, plants, and water in various geographic regions. Core gut microbiota – including Lactobacillus, Gilliamella, and Snodgrassella – are consistently found in honey bees worldwide, regardless of environmental conditions or location (Jones et al. 2018; Brar et al. 2024).
The gut microbiota of queen bees, dominated by Lactobacillus and Bombella, exhibit significantly lower diversity compared to that of worker bees. Significant microbiome differentiation between queens and workers is associated with dietary differences during both larval and adult stages (Engel et al. 2016). Queens depend heavily on royal jelly, which contains antimicrobial peptides, leading to a less diverse but functionally specialized microbiota (Stączek et al. 2023). Similarly, caste-specific differentiation in Korea reflects distinct dietary and behavioral roles, with workers encountering environmental microbiota during foraging and drones exhibiting lower diversity due to limited environmental interaction. In regions with diverse microbiota, such as tropical areas, the incorporation of environmental microbes into the gut microbiome of workers is higher compared to temperate regions (Khan et al. 2020b). Conversely, in Korea, colony hygiene and antimicrobial substances, such as propolis, diminish the influence of environmental microbes (Chuttong et al. 2023). Research across countries highlights the crucial role of gut microbiota in immunity and overall health. Our findings contribute to the global narrative by detailing caste-specific microbiomes in Korea. It may potentially serve as a baseline for monitoring honey bee health in East Asia.
This study highlights the caste-specific adaptations of the honey bee microbiome, offering insights into its ecological functions. However, the small sample size, particularly for drones and queens, limits the generalizability of the results, and future studies should include more samples. While next-generation sequencing (NGS) identifies microbial taxa, it does not provide functional insights, which could be gained through metagenomic or metatranscriptomic approaches. Moreover, the V3–V4 region of the 16S rRNA gene lacks sufficient resolution to distinguish between closely related species (Rognes et al. 2016; Johnson et al. 2019). Future studies employing fulllength 16S rRNA gene sequencing or shotgun metagenomics could provide enhanced taxonomic resolution and elucidate how specific microbial genera influence caste physiology, behavior, and colony resilience across diverse environments. Additional statistical analyses could reveal deeper patterns, aiding in the development of diagnostic tools to assess honey bee health and microbiome functions.
A comprehensive study was conducted to characterize the honey bee gut microbiome of worker, queen, and drone bees using 16S rRNA gene amplicon sequencing, and uncovered distinct microbial communities associated with the physiological and ecological roles of each bee type. Focusing on honey bees in Korea, this research offers region-specific baseline data on the gut microbiome composition of worker, queen, and drone bees. The study highlights the diversity of the honey bee gut microbiome. Additionally, the findings highlight the growing impact of environmental stressors and pathogens on bee populations, underlining the need for more comprehensive functional investigations. Future research should integrate microbiome studies into strategies for honey bee conservation and health improvement. The comprehensive workflow and findings summarized in Fig. 9 provide a basis for future microbiome research and practical applications in improving colony health and sustainability.
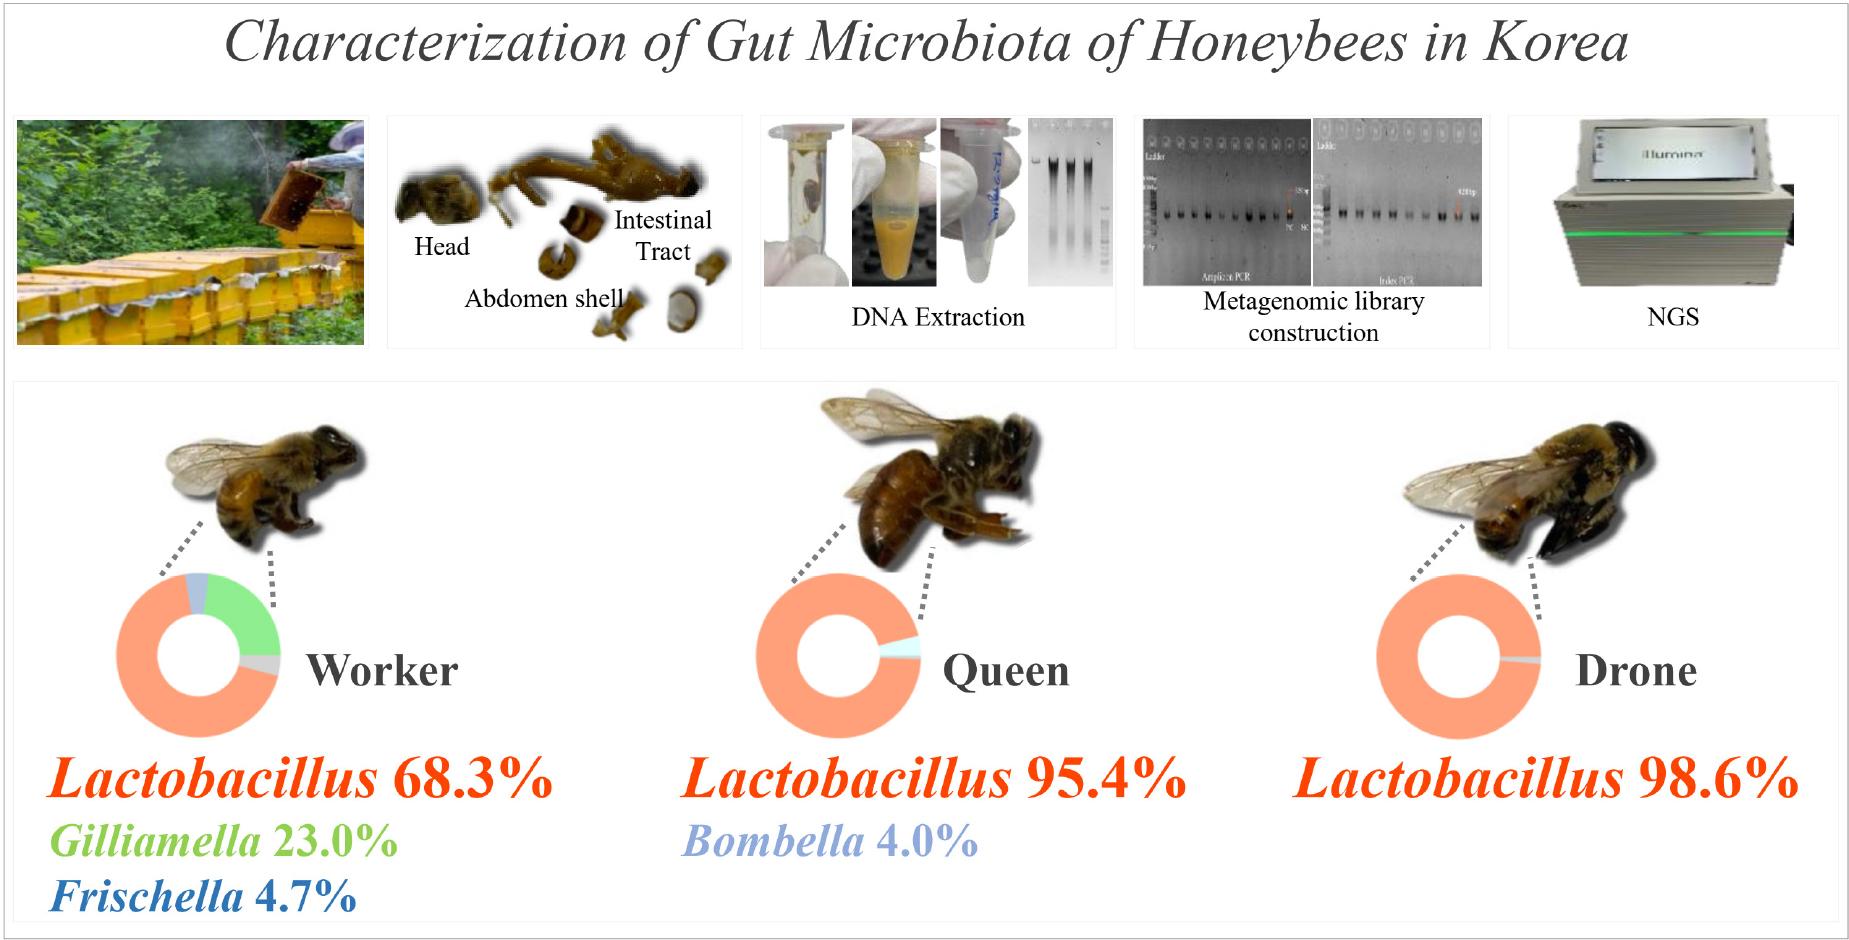
Summary of the characterization of caste-specific gut microbiota in honey bees from Korea.
This figure summarizes the study investigating the gut microbiota of honey bees collected in Korea, focusing on worker, queen, and drone castes. The top section outlines a standardized protocol for honey bee microbiome analysis, which includes bee collection, gut dissection, DNA extraction, metagenomic library preparation, and next-generation sequencing (NGS). The bottom section highlights the microbiota composition of the three castes: worker bees exhibit a diverse composition with Lactobacillus (68.3%), Gilliamella (23.0%), and Frischella (4.7%); queen bees are dominated by Lactobacillus (95.4%) with Bombella (4.0%); and drone bees are almost entirely composed of Lactobacillus (98.6%). These results highlight the distinct microbial communities associated with each caste and provide insights into their physiological roles and colony health.