
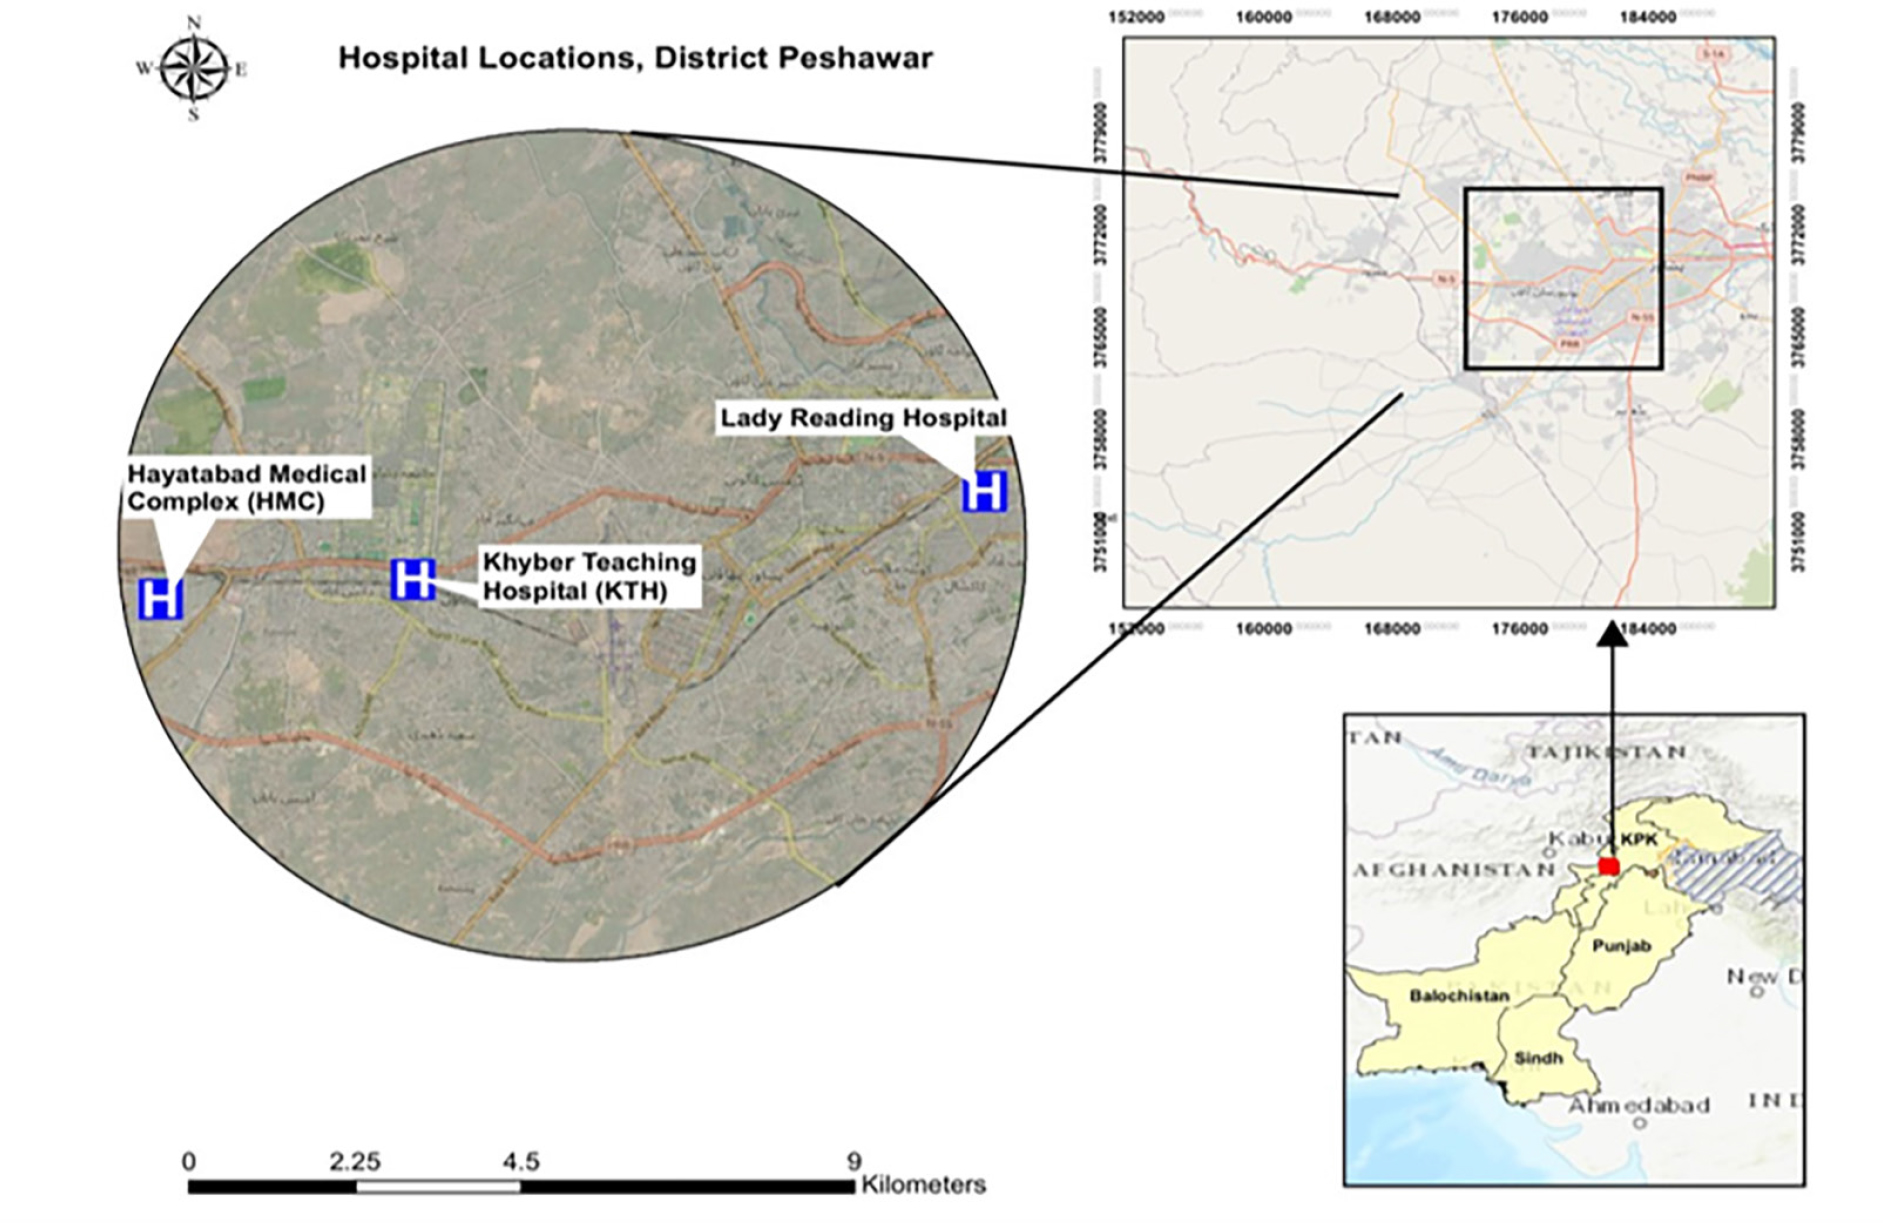
Fig. 1.
Map of Khyber Pakhtunkhwa, Pakistan, highlighting the locations of hospitals where Streptococcus pyogenes samples were collected. The hospitals included Hayatabad Medical Complex (HMC), Lady Reading Hospital (LRH), and Khyber Teaching Hospital (KTH) in Peshawar.
Table I
Prevalence of Streptococcus pyogenes among postpartum women and neonates.
| Group | Total samples | Positive cases | Prevalence (%) | Male cases | Female cases | χ2 Value | p-Value |
|---|---|---|---|---|---|---|---|
| Postpartum women | 192 | 32 | 16.7% | - | 32 | 1.52 | 0.217 |
| Neonates | 192 | 23 | 11.9% | 12 | 11 | ||
| Total | 384 | 55 | 14.3% | 12 | 43 |
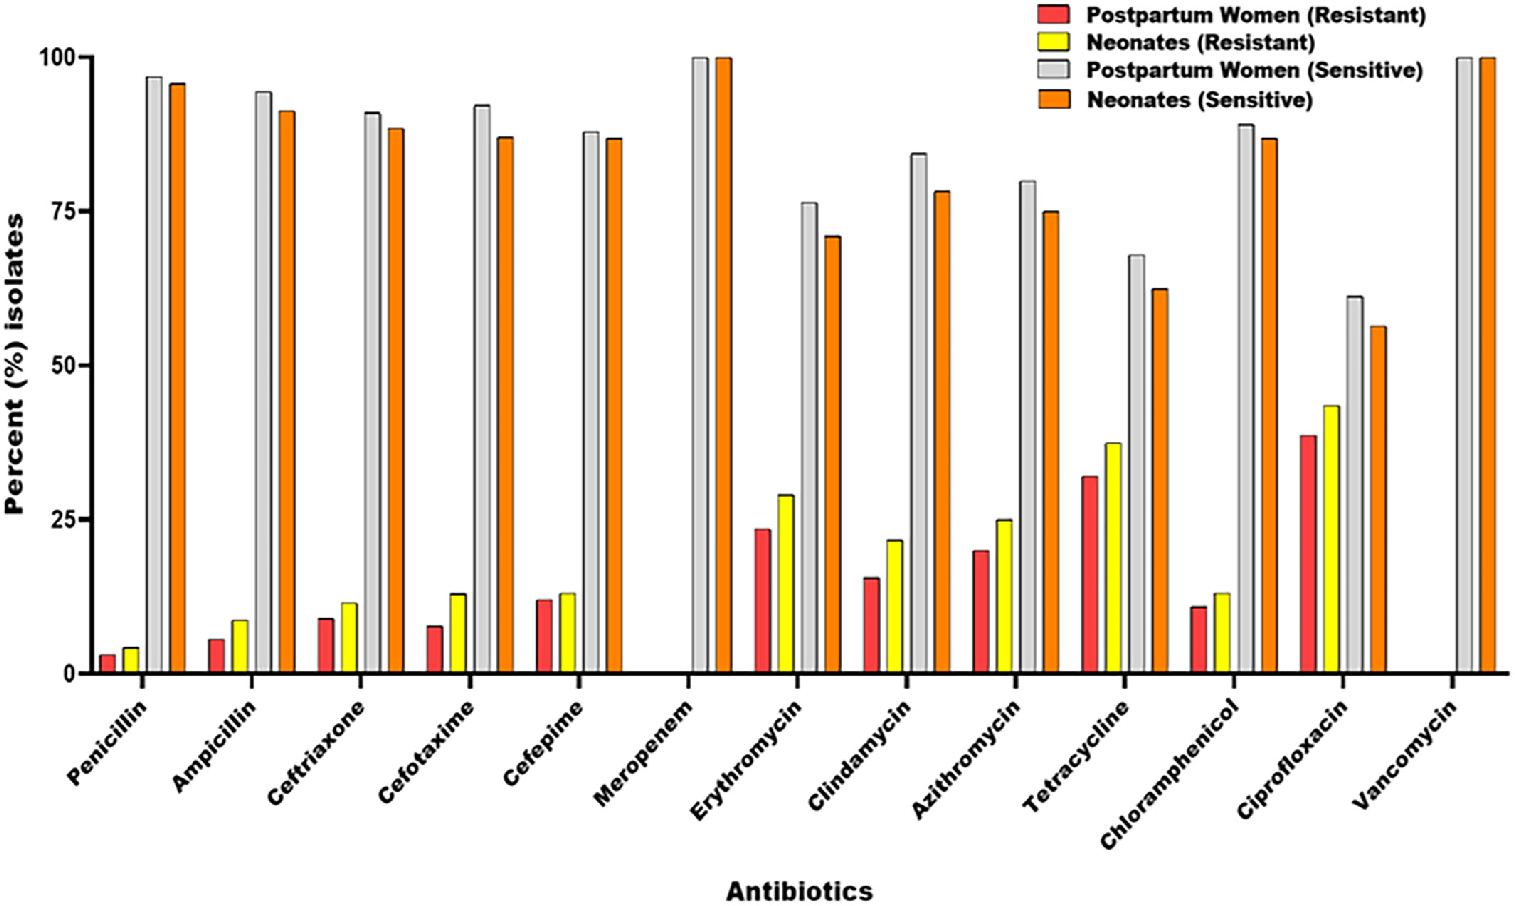
Fig. 2.
Antibiotic resistance and sensitivity patterns in bacterial isolates from postpartum women and neonates. Bars represent the percentage of resistant (red, yellow) and sensitive (gray, orange) isolates across different antibiotics.
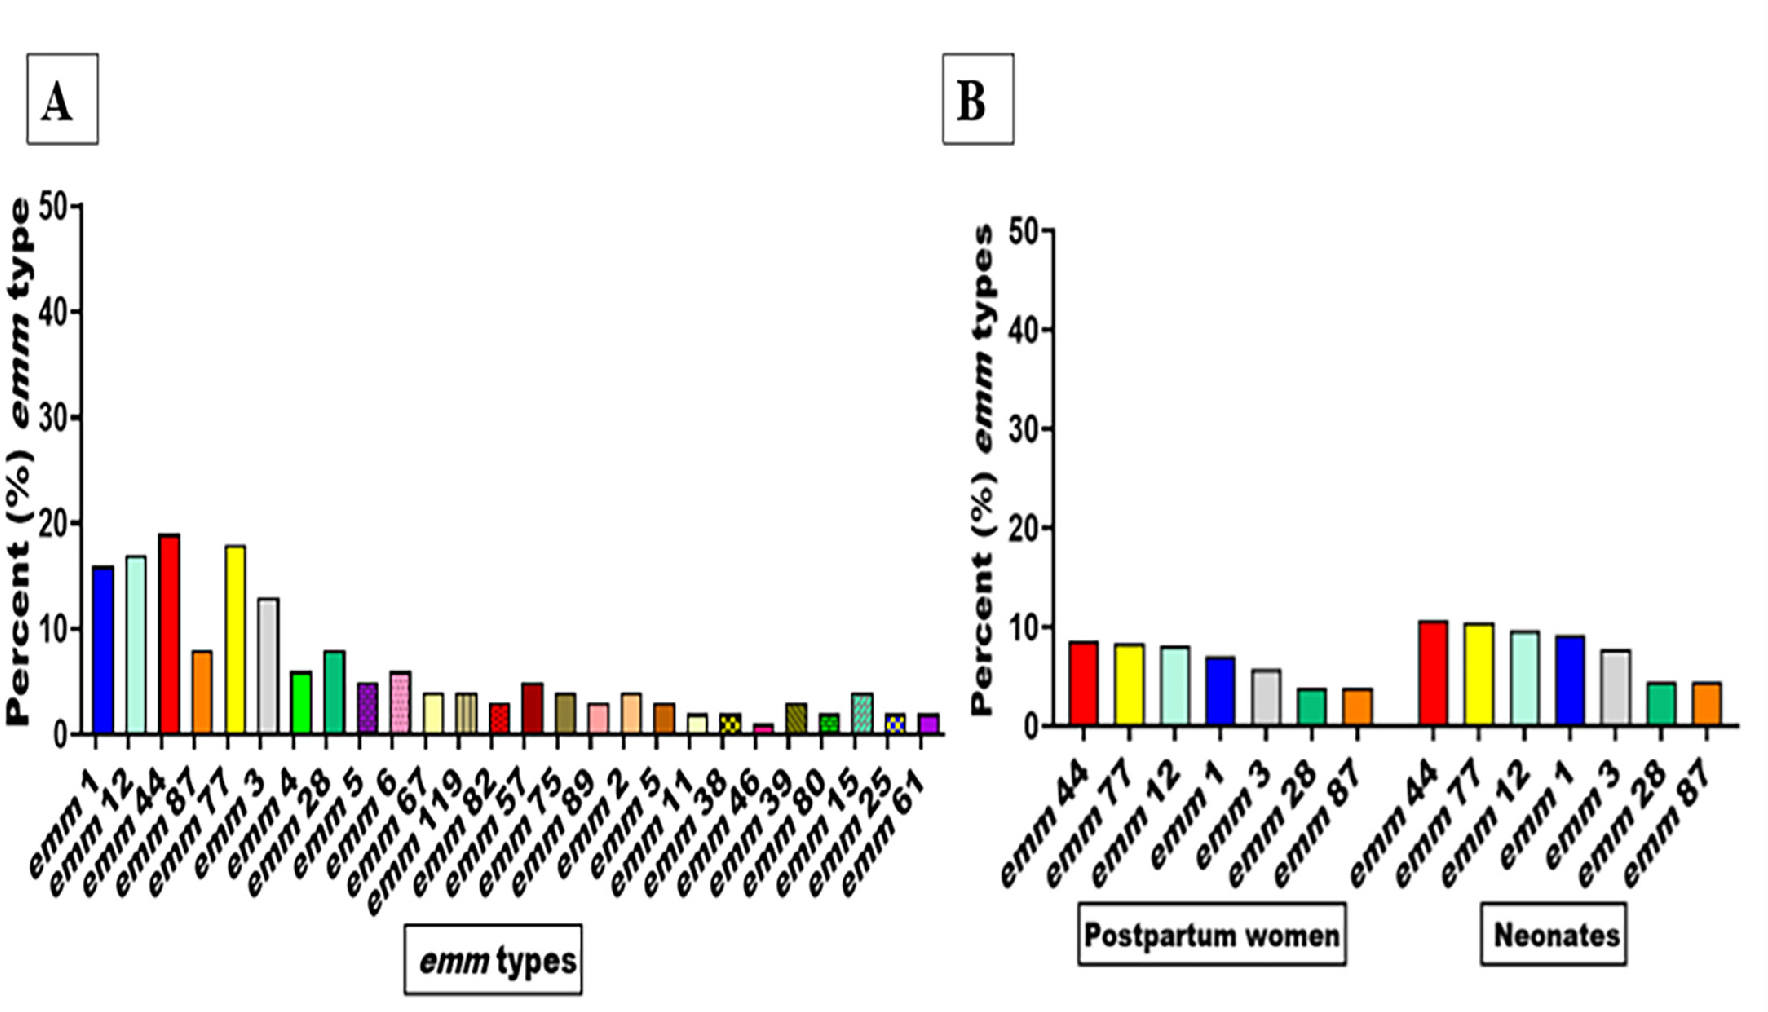
Fig. 3.
Distribution of emm types of Streptococcus pyogenes.
A) Percentage of different emm types among isolates; B) the most common emm types in postpartum women and neonates identified in the study population. Various colors and patterns indicate distinct emm types.
Table II
Clinical manifestations of Streptococcus pyogenes infection in postpartum women and neonates in Khyber Pakhtunkhwa.
| Clinical Feature | Postpartum women (n = 32) | Neonates (n = 23) | χ2 Value | p-Value |
|---|---|---|---|---|
| Fever (> 38°C) | 24 (75.0%) | 16 (66.7%) | 0.34 | 0.56 |
| Hypothermia (< 36°C) | 4 (12.5%) | 6 (27.8%) | 1.98 | 0.16 |
| Sepsis | 16 (50.0%) | 12 (55.6%) | 0.16 | 0.69 |
| Meningitis | 6 (16.7%) | 8 (33.3%) | 2.18 | 0.14 |
| Wound infection | 10 (33.3%) | – | – | – |
| Bacteremia | 18 (58.3%) | 16 (66.7%) | 0.37 | 0.54 |
| Respiratory distress | – | 12 (55.6%) | – | – |
| Jaundice | – | 8 (33.3%) | – | – |
| Hypotension | 7 (20.8%) | 5 (22.2%) | 0.01 | 0.92 |
| Tachycardia | 8 (25.0%) | 9 (38.9%) | 1.13 | 0.29 |
| Multi-organ dysfunction | 4 (12.5%) | 3 (11.1%) | 0.02 | 0.88 |
| Vomiting | 8 (25.0%) | 10 (44.4%) | 2.25 | 0.13 |
| Hypoglycemia | 6 (16.7%) | 9 (38.9%) | 3.73 | 0.05 |
| Lethargy | 7 (20.8%) | 12 (50.0%) | 5.46 | 0.02 |
| Rash | 6 (16.7%) | 6 (27.8%) | 0.96 | 0.33 |
| Abdominal pain | 10 (29.2%) | – | – | – |
| Feeding difficulties | – | 8 (33.3%) | – | – |
| Cyanosis | – | 4 (16.7%) | – | – |
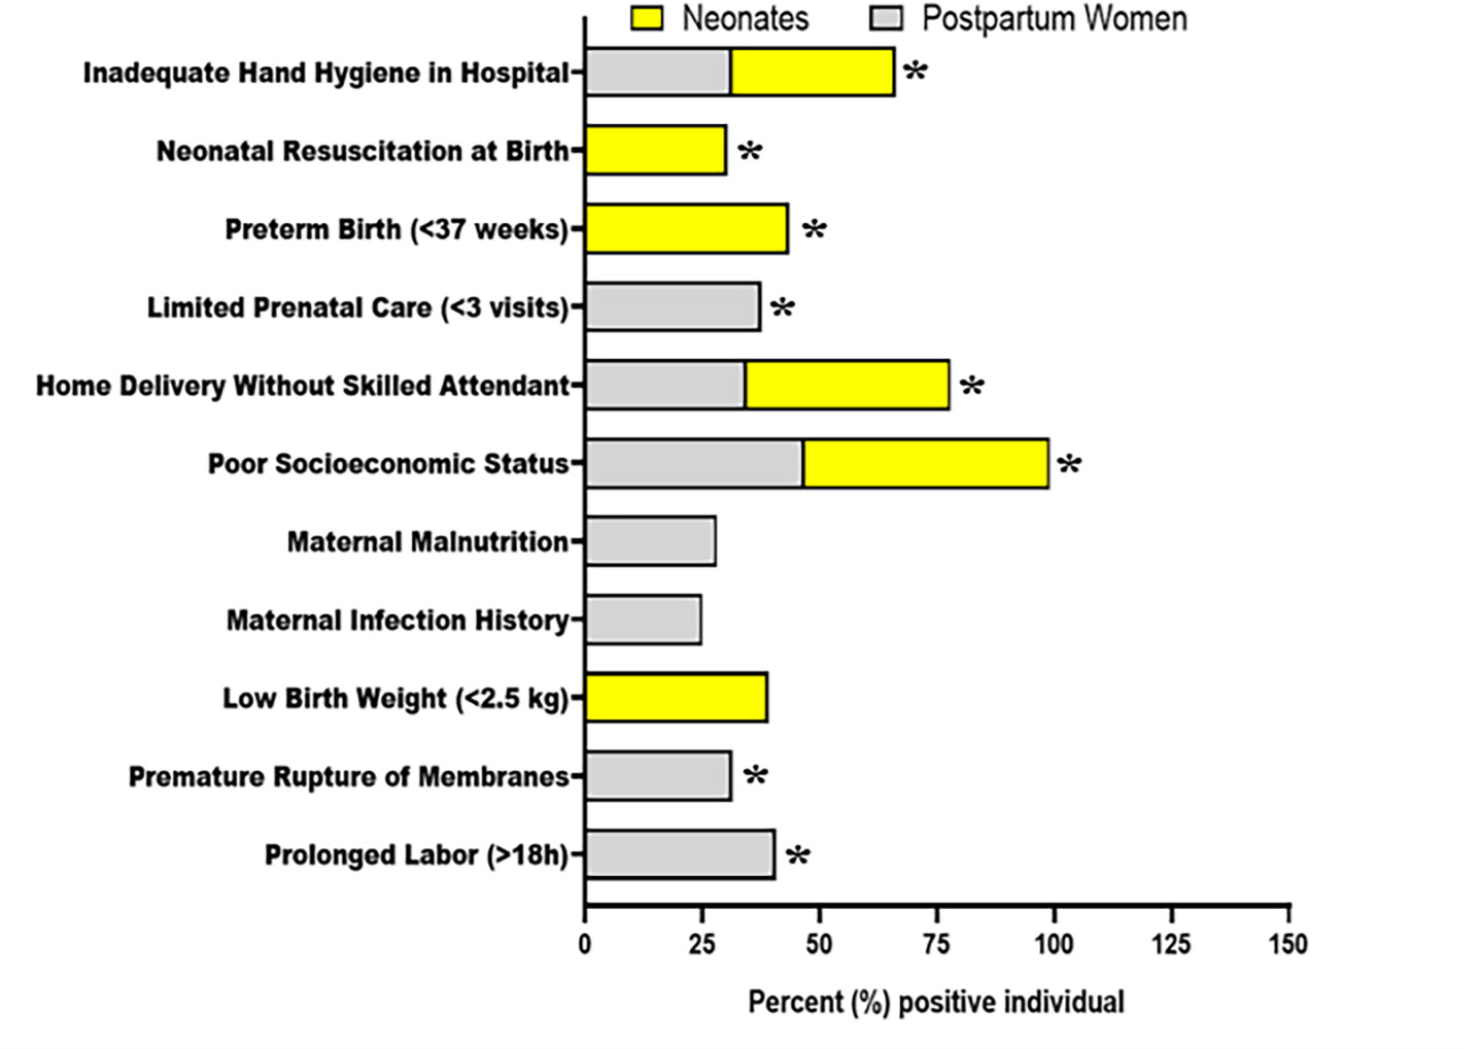
Fig. 4.
Risk factors associated with neonatal and postpartum maternal infections. Neonatal-associated factors are highlighted in yellow, whereas postpartum maternal-associated factors are shown in gray. * – indicates statistical significance (p< 0.05)
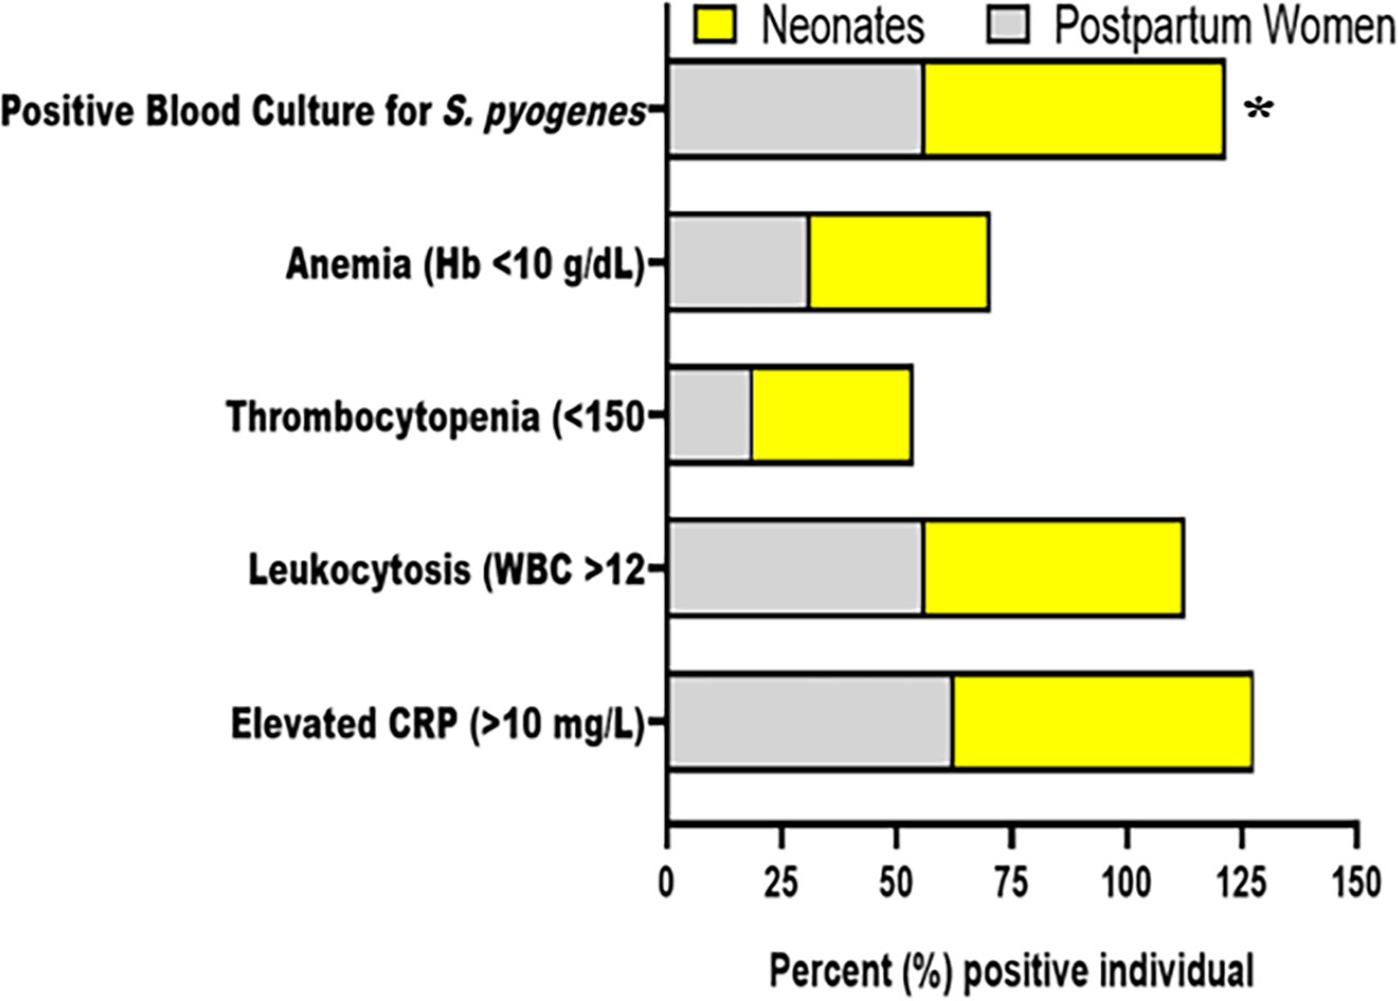
Fig. 5.
Clinical and laboratory findings in neonates and postpartum women with S. pyogenes infections. Neonatal-associated cases are shown in yellow, whereas postpartum maternal cases are depicted in gray. * – indicates statistical significance (p< 0.05)
Table III
Risk factors and laboratory findings associated with Streptococcus pyogenes infection.
| Parameter | Postpartum women (%) (n = 32) | Neonates (%) (n = 23) | Crude OR (95% CI) | Adjusted OR (95% CI) | p-Value |
|---|---|---|---|---|---|
| Risk factors | |||||
| Prolonged labor (> 18h) | 13 (40.6%) | – | 2.9 (1.3–6.4) | 2.6 (1.2–6.0) | 0.030 |
| Premature rupture of membranes | 10 (31.3%) | – | 2.3 (1.1–4.8) | 2.1 (1.0–4.6) | 0.039 |
| Low birth weight (< 2.5 kg) | – | 9 (39.1%) | 1.4 (0.6–3.0) | 1.2 (0.5–2.8) | 0.315 |
| Maternal infection history | 8 (25.0%) | – | 1.8 (0.9–3.5) | 1.6 (0.8–3.2) | 0.092 |
| Maternal malnutrition | 9 (28.1%) | – | 1.4 (0.7–2.8) | 1.3 (0.6–2.7) | 0.256 |
| Poor socioeconomic status | 15 (46.9%) | 12 (52.2%) | 2.6 (1.4–5.1) | 2.3 (1.2–4.6) | 0.027 |
| Home delivery without skilled attendant | 11 (34.4%) | 10 (43.5%) | 3.0 (1.5–6.0) | 2.7 (1.3–5.7) | 0.020 |
| Limited prenatal care (< 3 visits) | 12 (37.5%) | – | 2.7 (1.3–5.5) | 2.4 (1.2–5.0) | 0.036 |
| Preterm birth (< 37 weeks) | – | 10 (43.5%) | 3.3 (1.6–7.1) | 3.0 (1.4–6.7) | 0.013 |
| Neonatal resuscitation at birth | – | 7 (30.4%) | 2.9 (1.4–6.1) | 2.6 (1.2–5.7) | 0.028 |
| Inadequate hand hygiene in hospital | 10 (31.3%) | 8 (34.8%) | 2.8 (1.3–6.0) | 2.4 (1.1–5.2) | 0.034 |
| Laboratory features | |||||
| Elevated CRP (> 10 mg/l) | 20 (62.5%) | 15 (65.2%) | 1.2 (0.6–2.3) | 1.1 (0.5–2.2) | 0.984 |
| Leukocytosis (WBC > 12,000/μl) | 18 (56.3%) | 13 (56.5%) | 1.4 (0.7–2.7) | 1.2 (0.6–2.4) | 0.874 |
| Thrombocytopenia (< 150,000/μl) | 6 (18.8%) | 8 (34.8%) | 1.7 (0.8–3.5) | 1.5 (0.7–3.1) | 0.365 |
| Anemia (Hb < 10 g/dl) | 10 (31.3%) | 9 (39.1%) | 1.5 (0.7–3.1) | 1.4 (0.6–2.9) | 0.710 |
| Positive Blood Culture for S. pyogenes | 18 (56.3%) | 15 (65.2%) | 2.0 (1.1–3.9) | 1.8 (0.9–3.7) | 0.054 |