Fig. 1.
Fig. 2.
Fig. 3.
Fig.4.
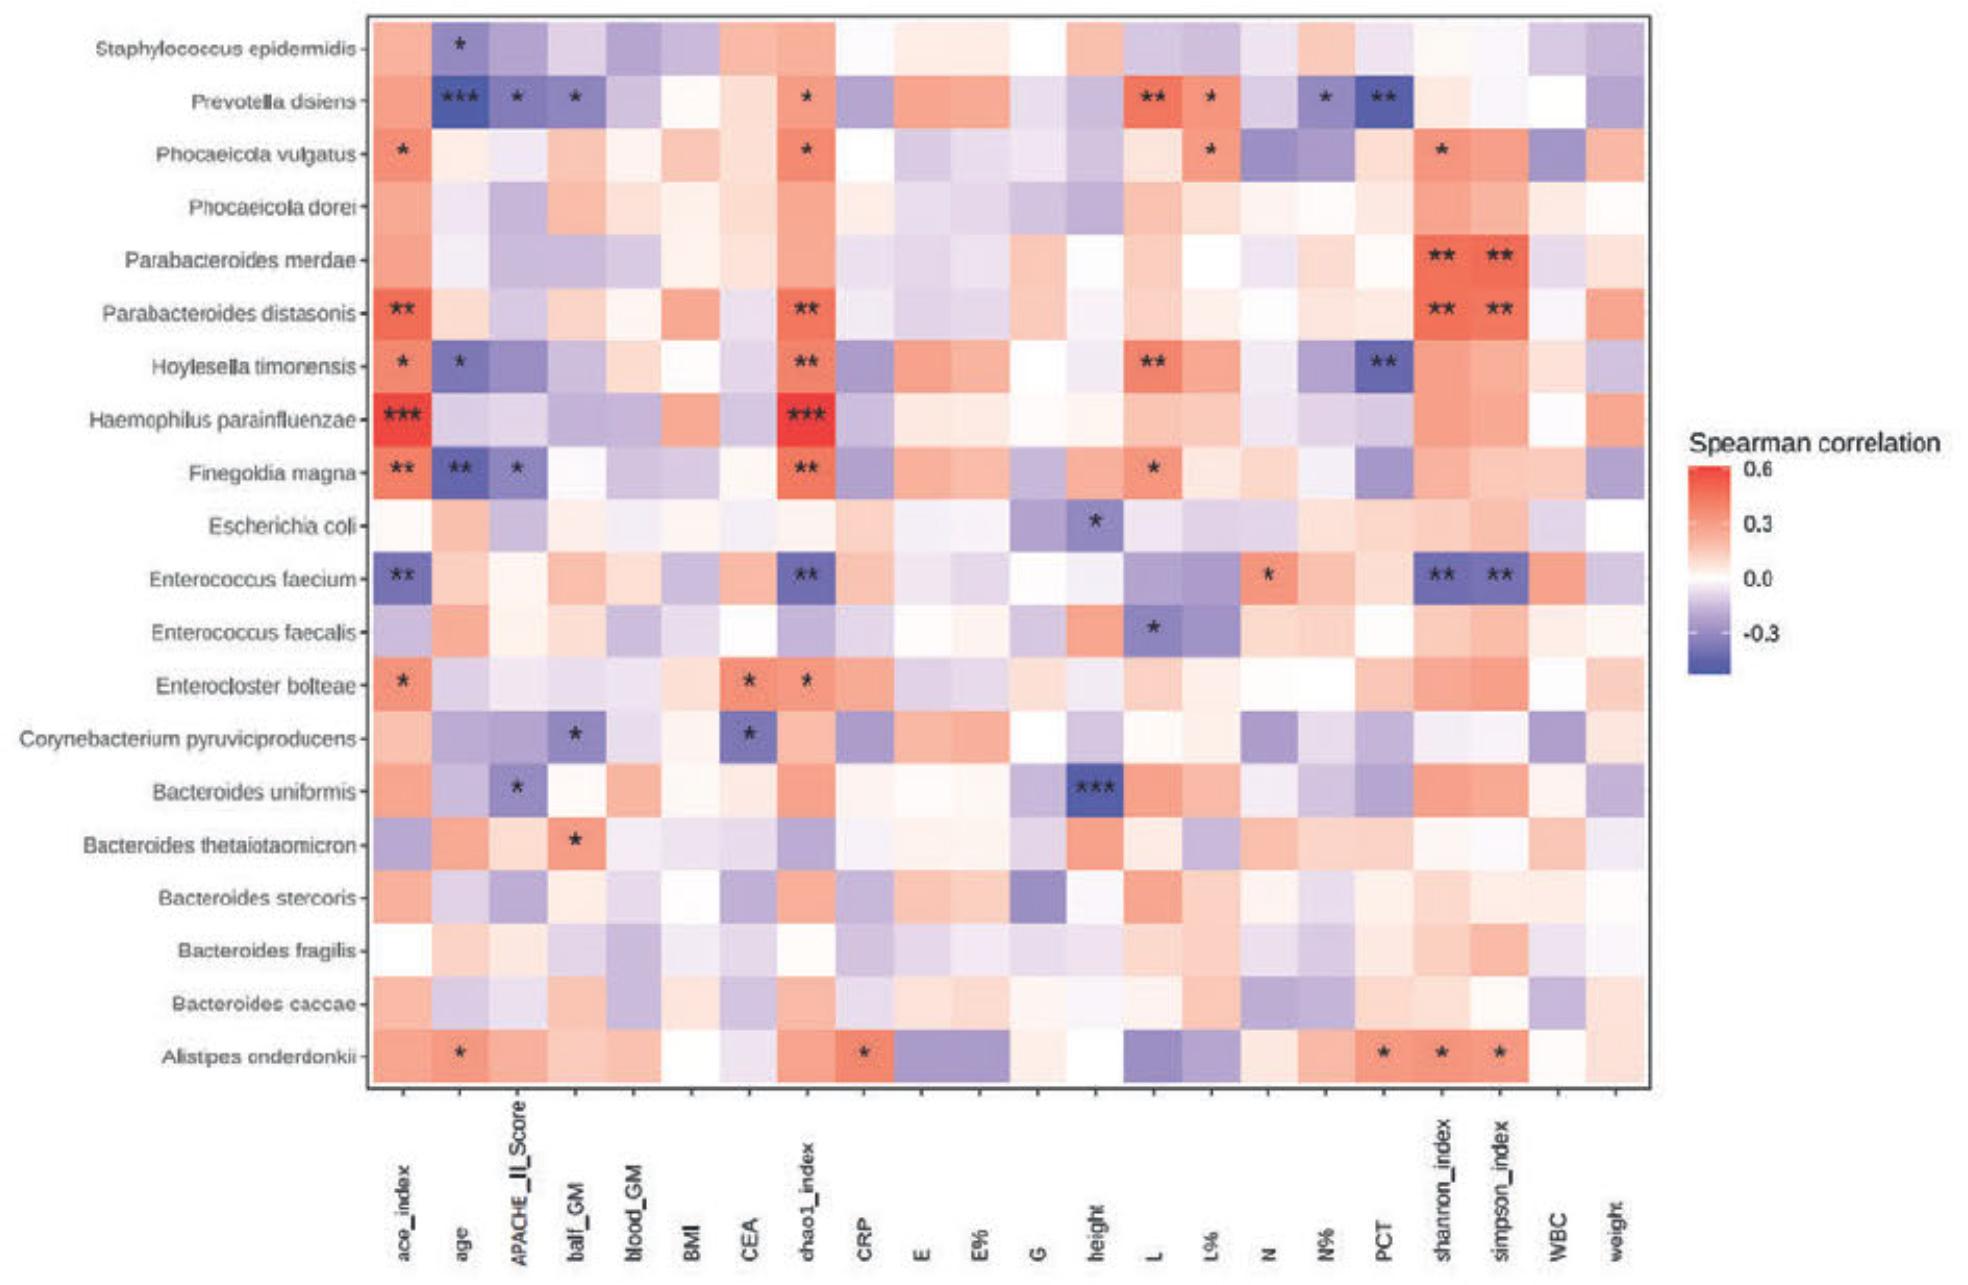
Fig. 5.
Comparison of general data between the two groups of patients_
| Project | IPA group (n = 43) | H group (n = 31) | p-value |
|---|---|---|---|
| Basic information | |||
| Sex (Male) [n (%)] | 32 (74.4) | 18 (58.1) | p>0.05 |
| Age (years) (IQR) | 73 (67 ~ 77) | 63 (54 ~ 82) | p>0.05 |
| Underline illness [n (%)] | |||
| Diabetes | 2 (4.7) | 1 (3.2) | p>0.05 |
| Hypertension | 11 (25.6) | 3 (9.7) | p>0.05 |
| Chronic obstructive pulmonary disease | 7 (16.3) | 0 | p>0.05 |
| Malignant diseases of the blood system | 7 (16.3) | 0 | p>0.05 |
| Rheumatic diseases | 5 (11.6) | 0 | p>0.05 |
| Solid organ malignancy | 2 (4.7) | 0 | p>0.05 |
| No underline diseases | 9 (20.9) | 27 (87.1) | p< 0.05 |
| Clinical indicators | |||
| White blood cell (109/l) | 6.3 ± 3.5 | – | |
| Neutrophil count (109/l) | 5.0 ± 3.1 | – | |
| Neutrophil percentage (%) | 73.9 ± 15.4 | – | |
| Eosinophil count (109/l) | 0.1 ± 0.1 | – | |
| Eosinophil percentage (%) | 1.5 ± 3.0 | – | |
| Lymphocyte count (109/l) | 0.9 ± 0.6 | – | |
| Lymphocyte percentage (%) | 17.5 ±11.8 | – | |
| Serum (1-3)-β-d-glucan (pg/ml) | 48.8 ±79.9 | – | |
| Serum galactomannan (μg/l) | 0.8 ± 1.3 | – | |
| Bronchoalveolar lavage fluid Galactomannan (μg/l) | 3.7 ± 4.0 | – | |
| Carcinoembryonic antigen (ng/ml) | 2.9 ± 2.6 | – | |
| C-reactive protein (mg/l) | 73.6 ±71.1 | – | |
| Procalcitonin (ng/ml) | 2.3 ± 5.9 | – | |
| APACHE II score | 16.1 ±10.0 | – | |