
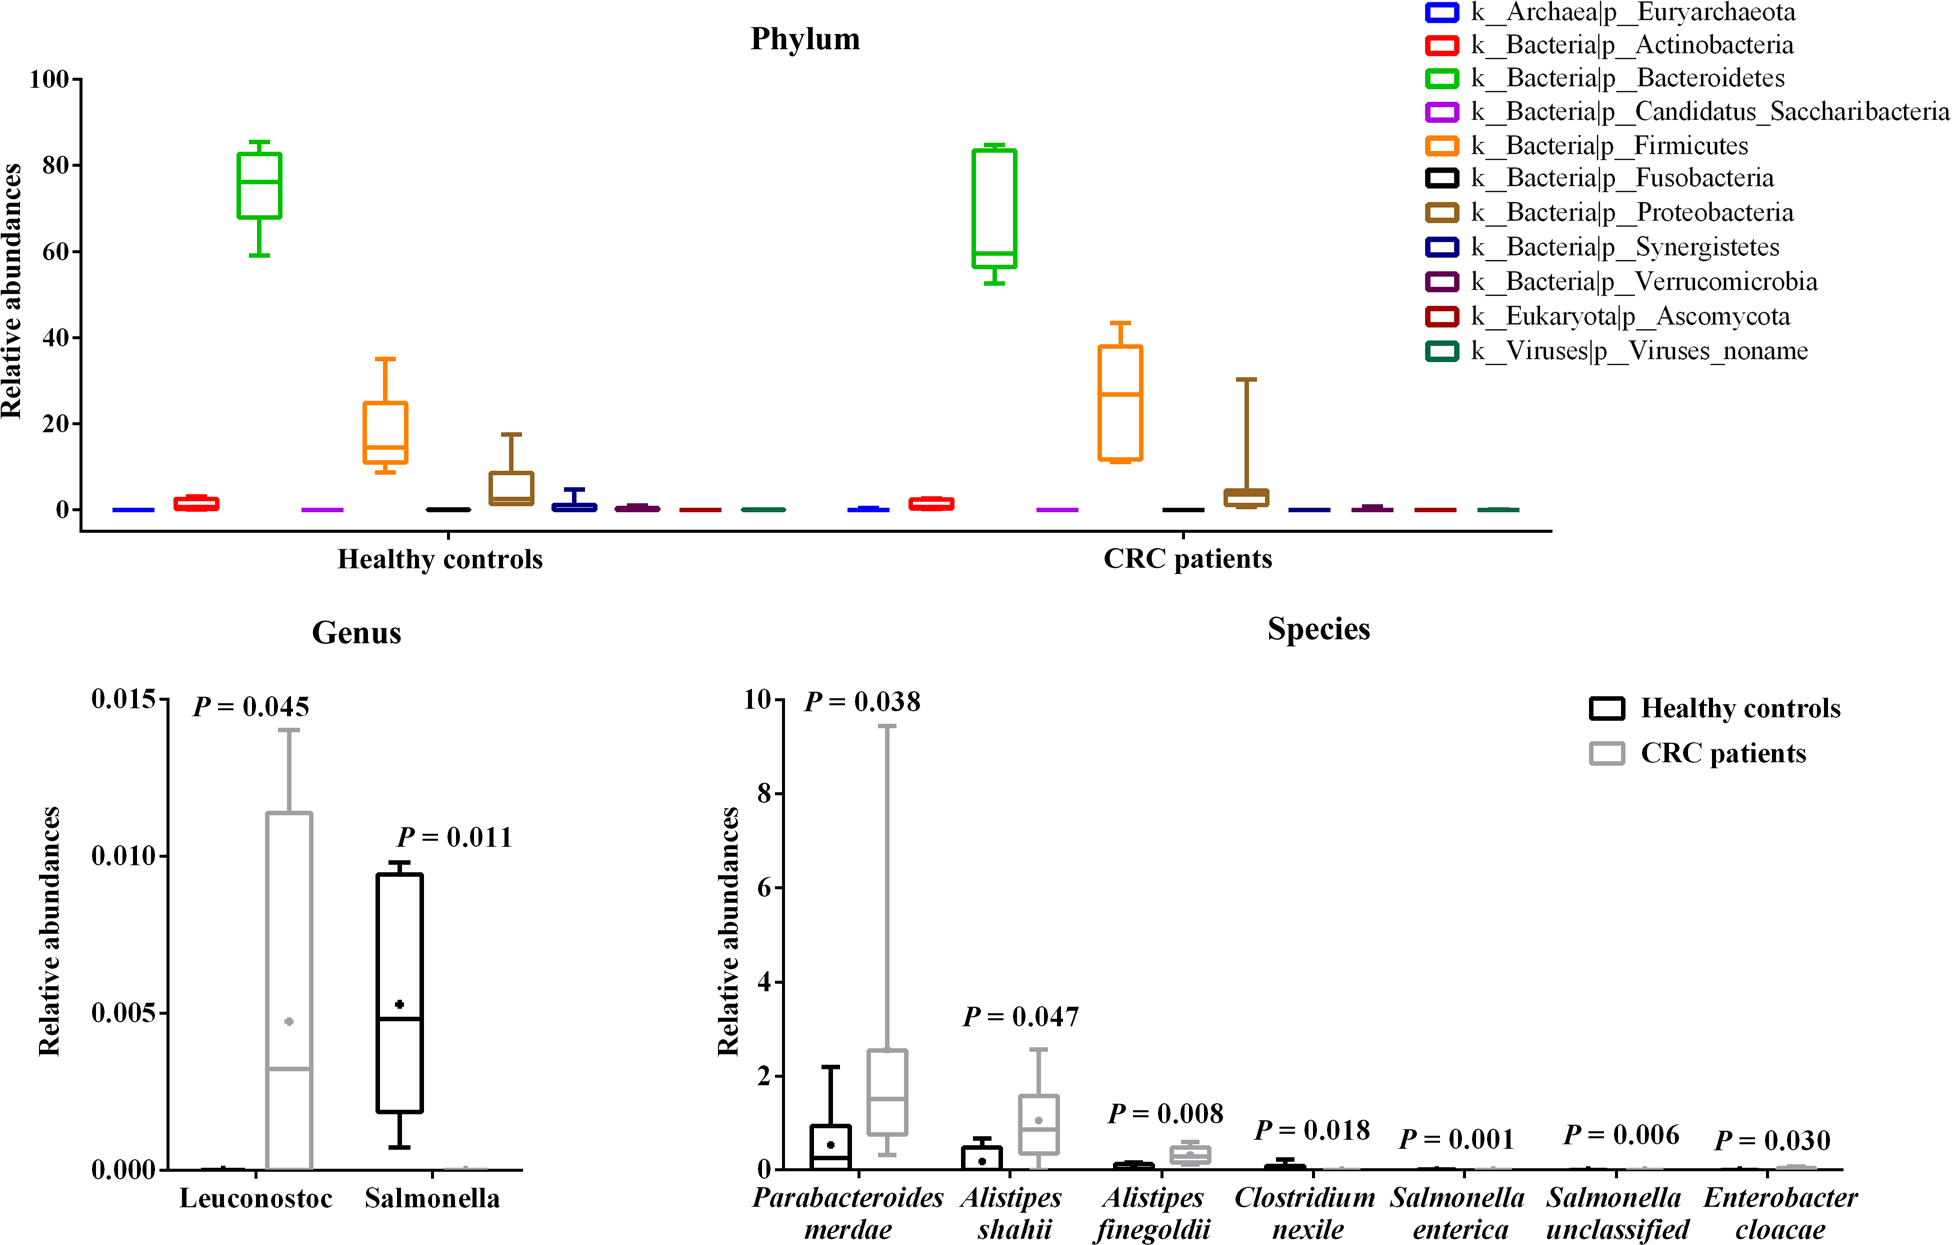
Fig. 1.
Comparison of GIT microbial relative abundance at the phylum, genus and species level between CRC patients and healthy subjects. CRC – colorectal cancer, GIT – gastrointestinal tract
Table I
Baseline characteristics of healthy controls and CRC patients.
| Subject code | Age (years), average (range)* | Sex | Weight (kg) | Height (cm) | Cancer history | Medical history | Diagnosis | |
|---|---|---|---|---|---|---|---|---|
| Healthy controls | ZJPQ | 67 (44–71) | Male | 75 | 167 | N/A | N/A | N/A |
| SKZL | Male | 74 | 172 | N/A | N/A | N/A | ||
| LJQ | Male | 74 | 178 | N/A | N/A | N/A | ||
| LDGL | Male | 75 | 178 | N/A | N/A | N/A | ||
| HMXL | Male | 86 | 182 | N/A | N/A | N/A | ||
| DHBL | Male | 73 | 167 | N/A | N/A | N/A | ||
| CRC patients | LYZ.1 | 57 (42–67) | Male | 59 | 170 | No | None | CRC with liver metastasis for 1 month |
| ANJ.1 | Male | 70 | 165 | No | None | CRC with liver metastasis for half month | ||
| LXL.1 | Female | 58 | 160 | No | Hypertension | CRC | ||
| MYL.1 | Female | 57 | 157 | No | None | CRC | ||
| XHM.1 | Female | 56 | 156 | No | None | CRC with cervical lymph node metastasis for 5 days | ||
| GWX.1 | Male | 90 | 168 | No | None | CRC with multiple metastases for 5 days | ||
| WZL.1 | Male | 73 | 172 | No | None | CRC with multiple metastases for 1 month |
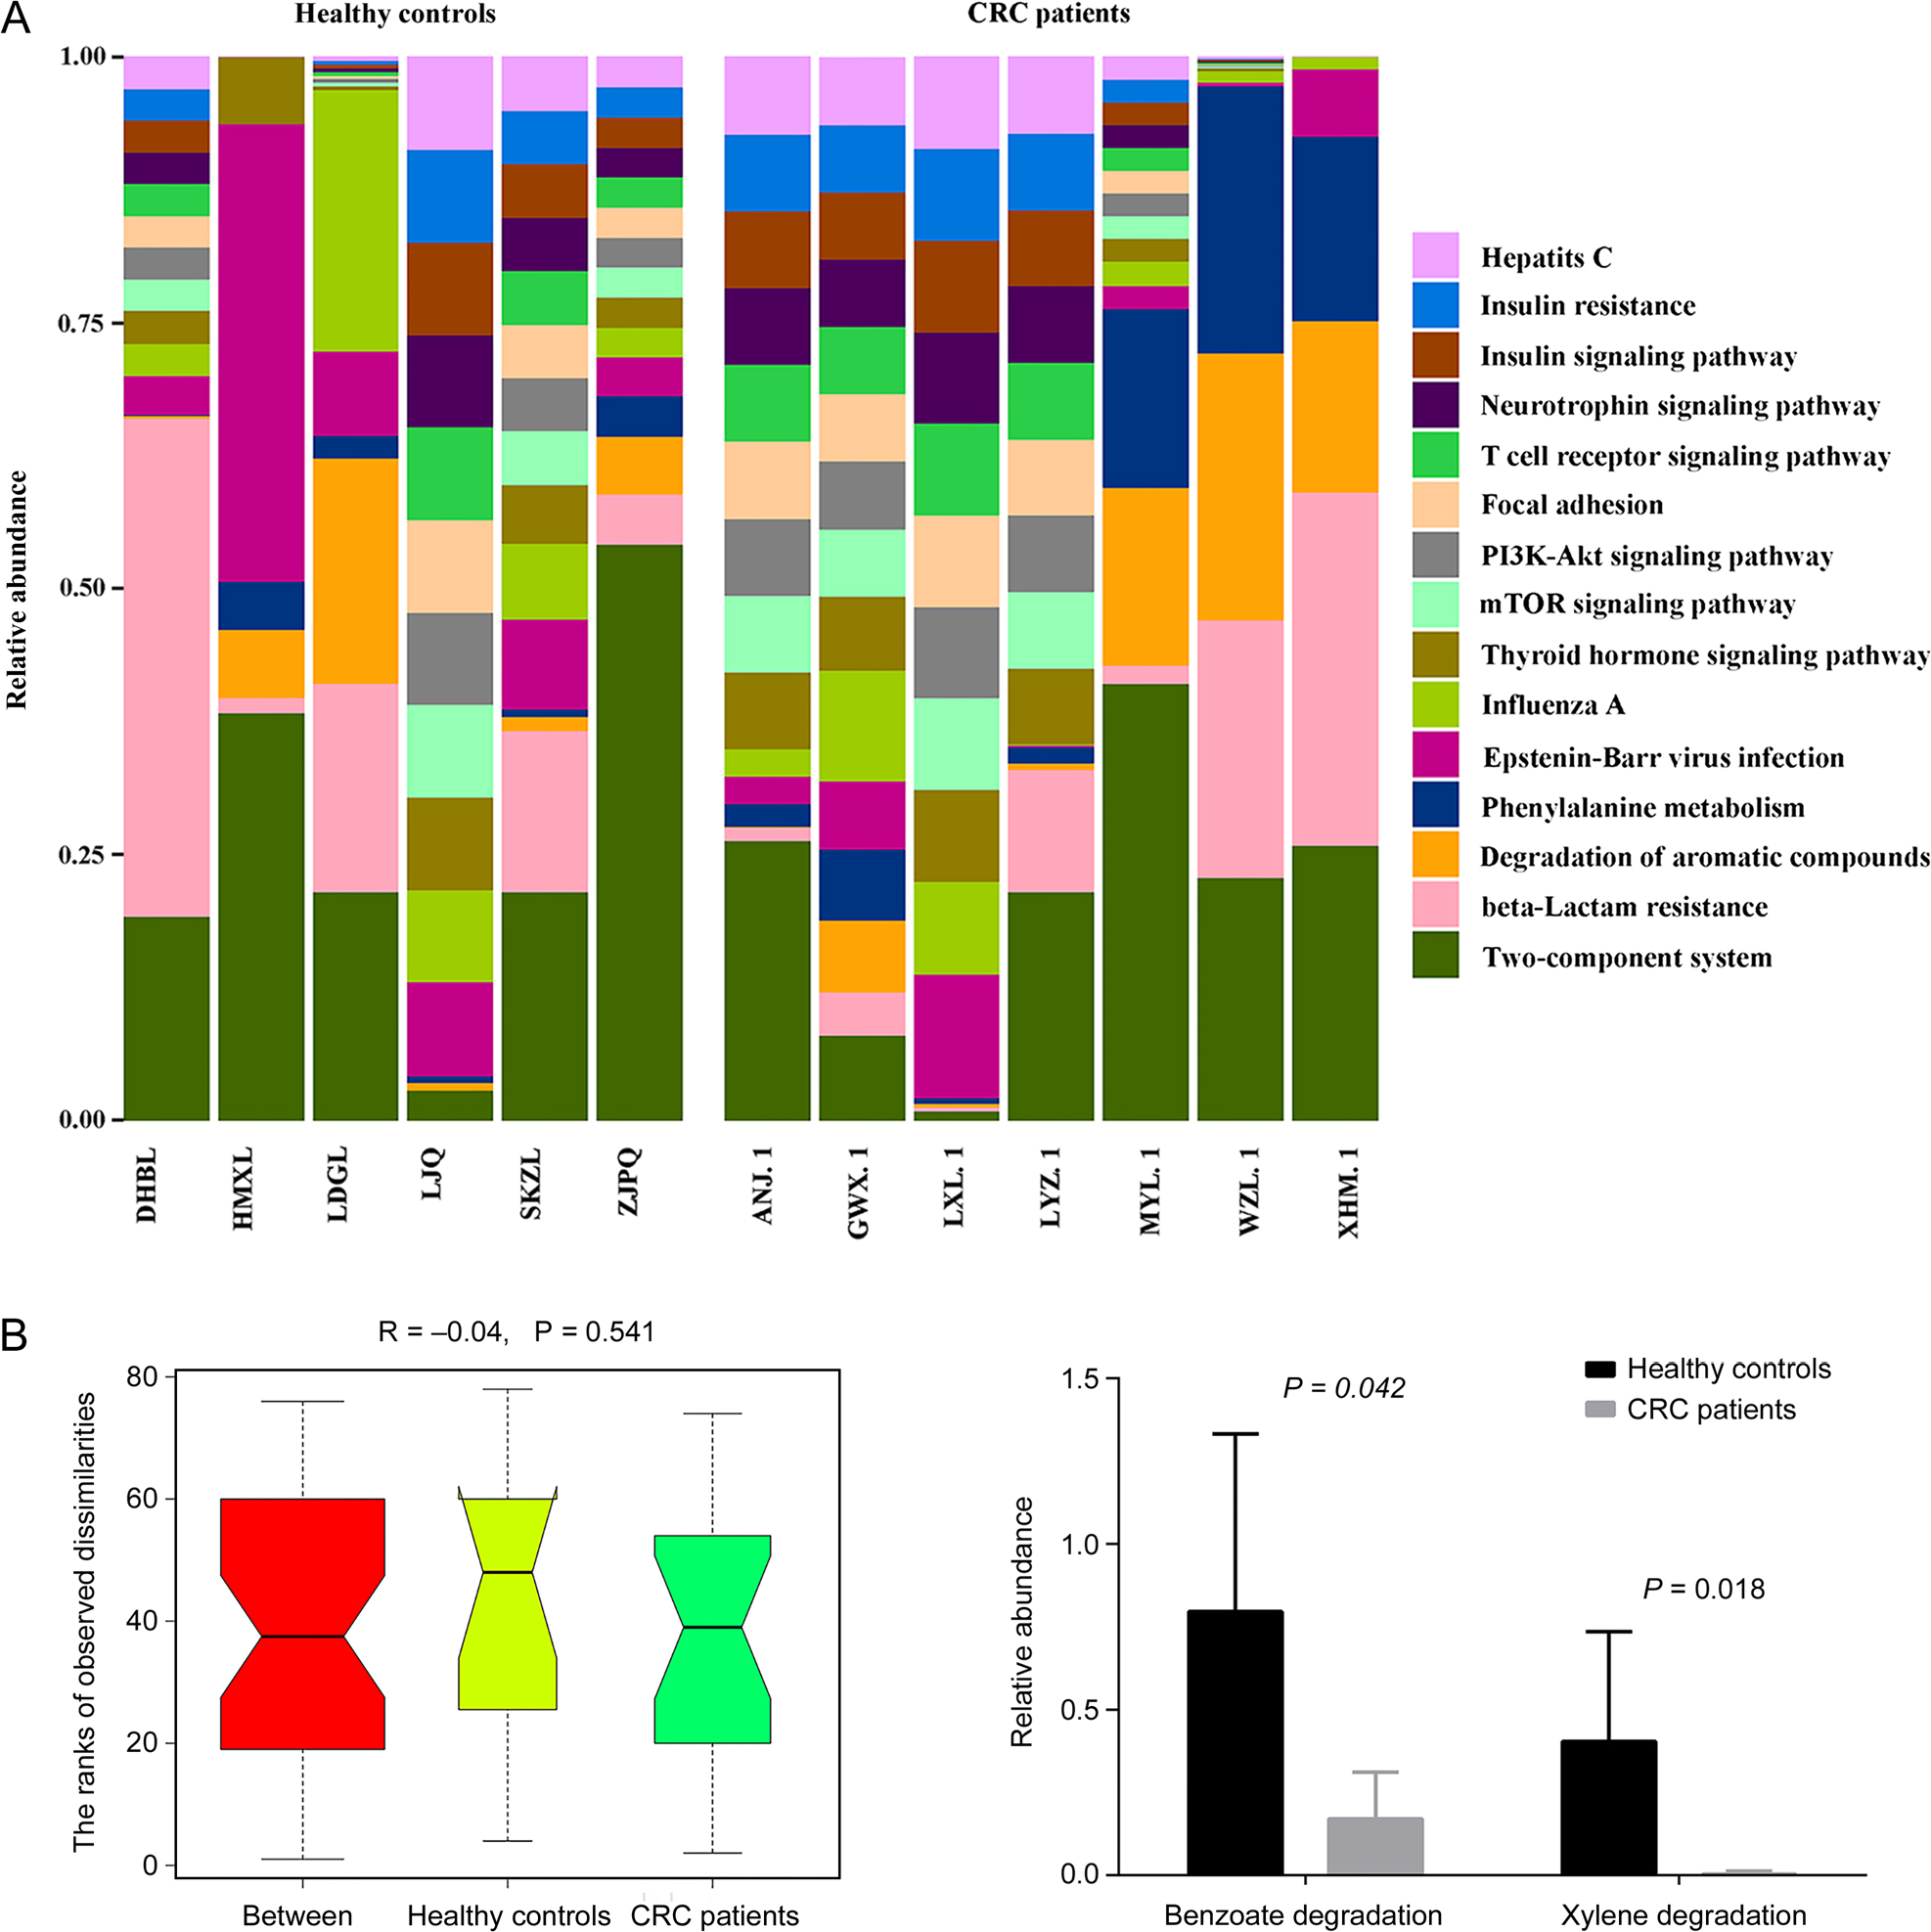
Fig. 2.
Analysis of metabolic function between CRC – colorectal cancer patients and healthy subjects.
A) Histogram of intestinal microbiota metabolism and functional gene relative abundance in patients with CRC and healthy controls; B) analysis of similarity in each group or between the two groups; C) relative abundance comparison in CRC patients and healthy controls.
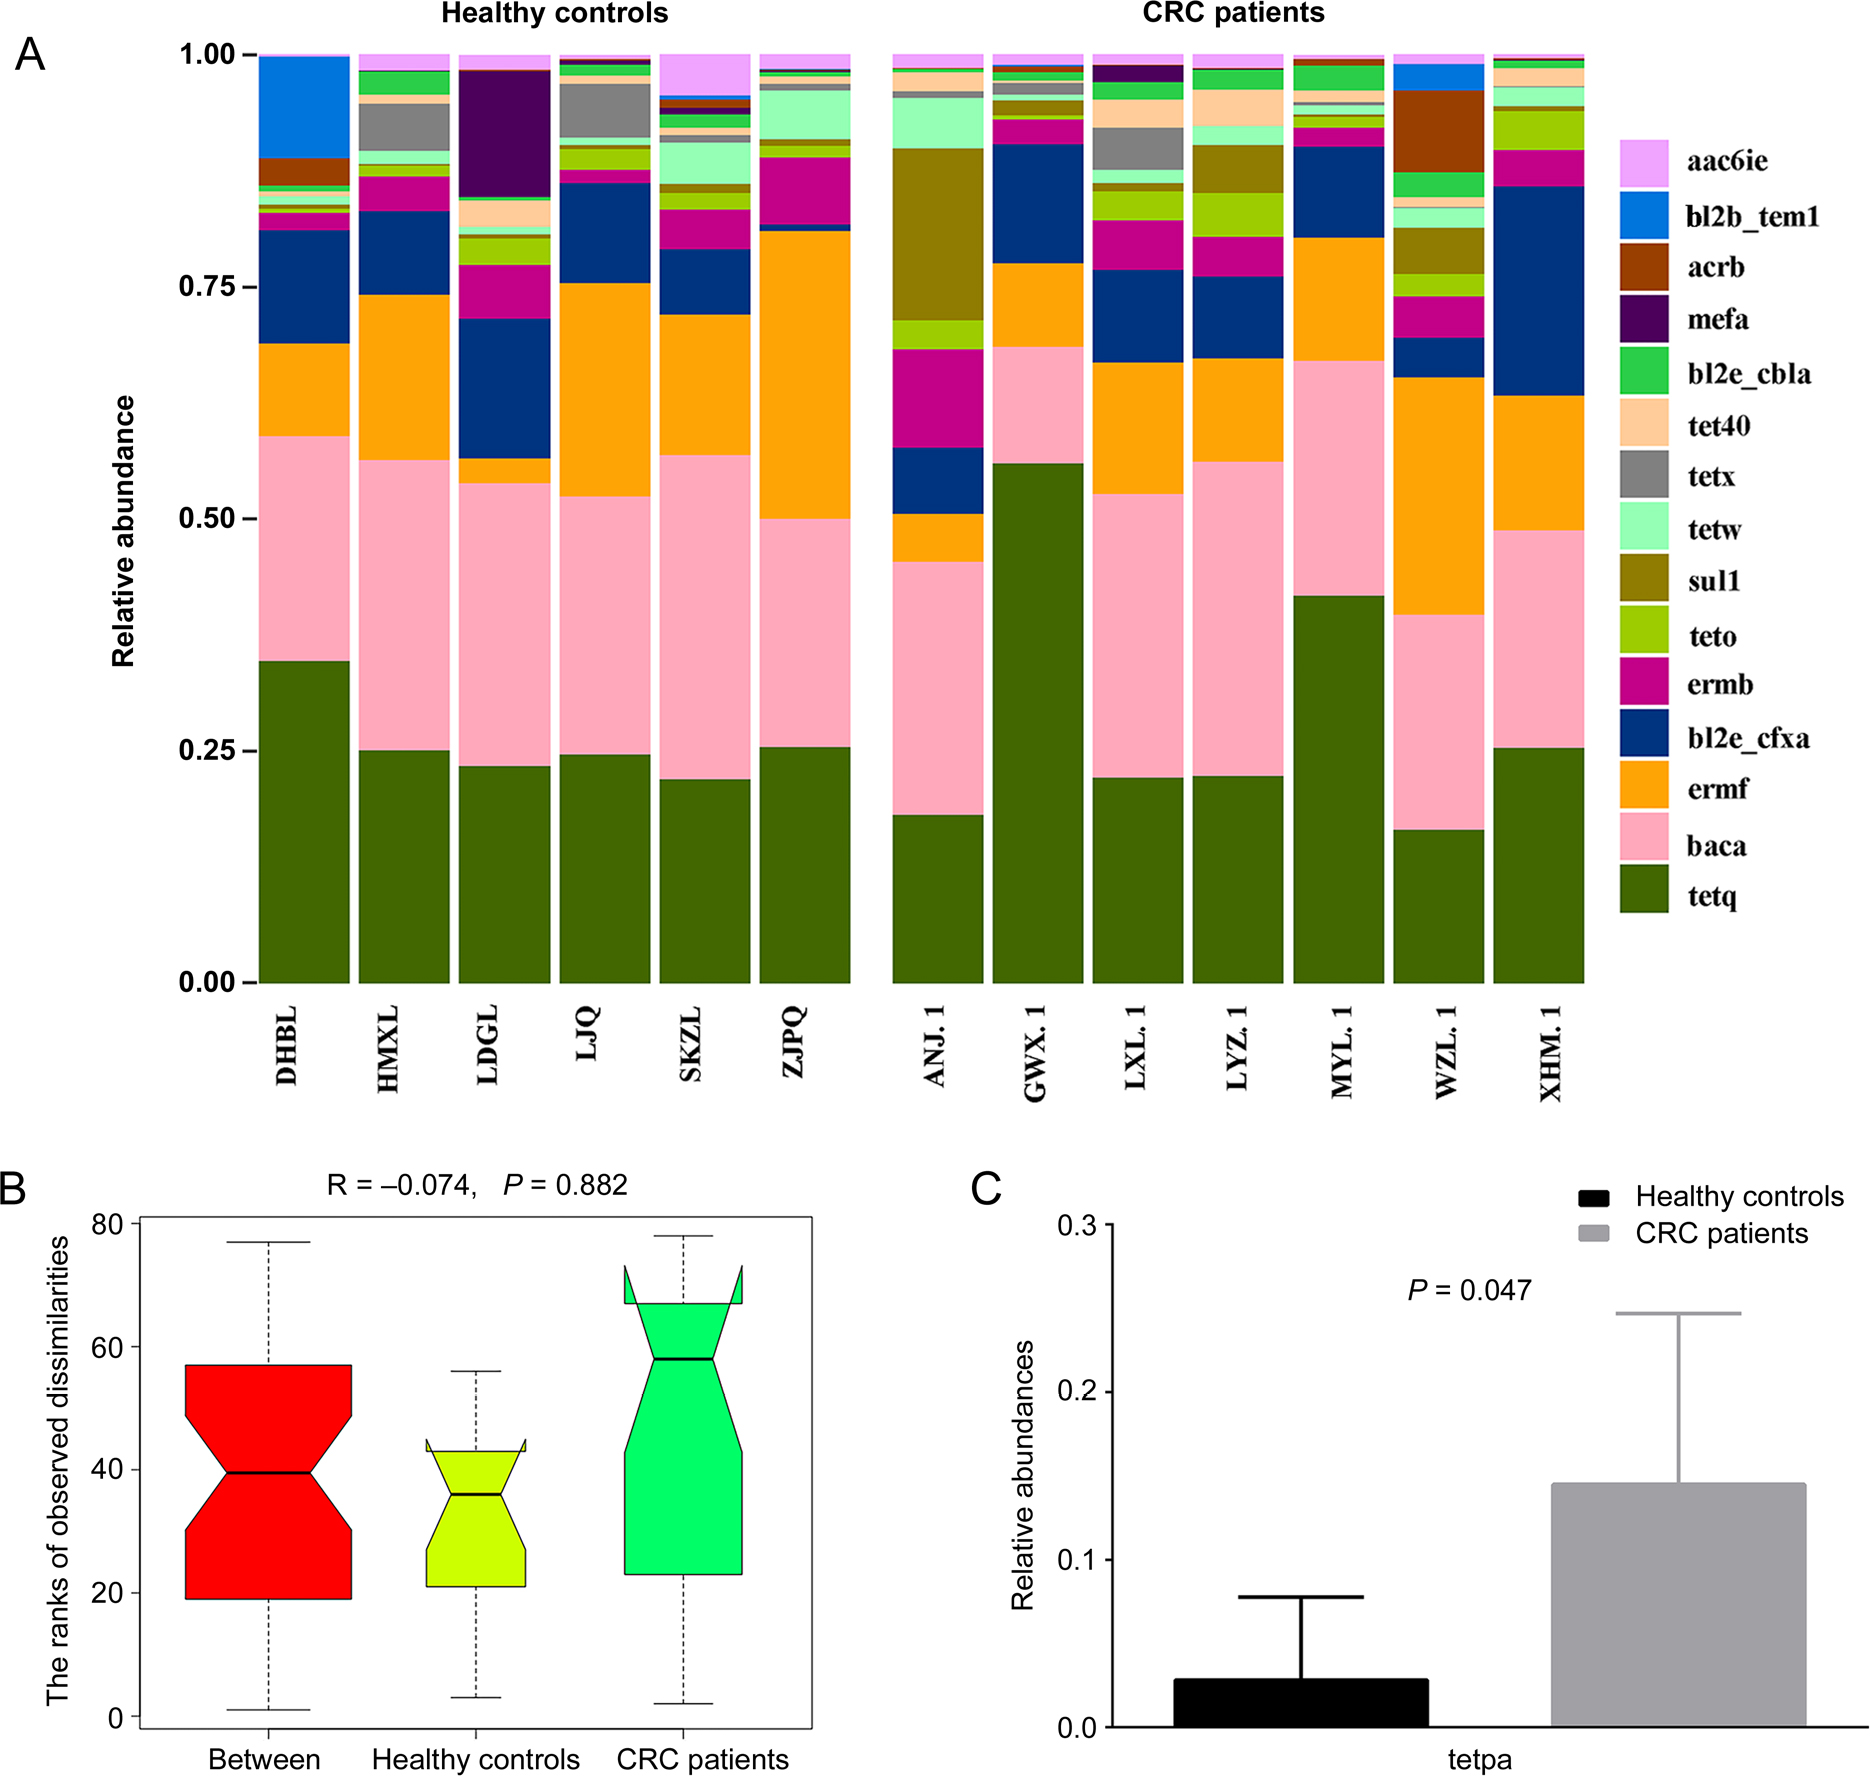
Fig. 3.
Analysis of resistant genes between CRC patients and healthy subjects.
A) Histogram of intestinal microbiota ARG relative abundance in patients with CRC and healthy controls; B) analysis of similarity in each group or between the two groups; C) comparison of intestinal microbiota ARGs between CRC patients and healthy controls. ARG – antibiotic resistance genes, CRC – colorectal cancer
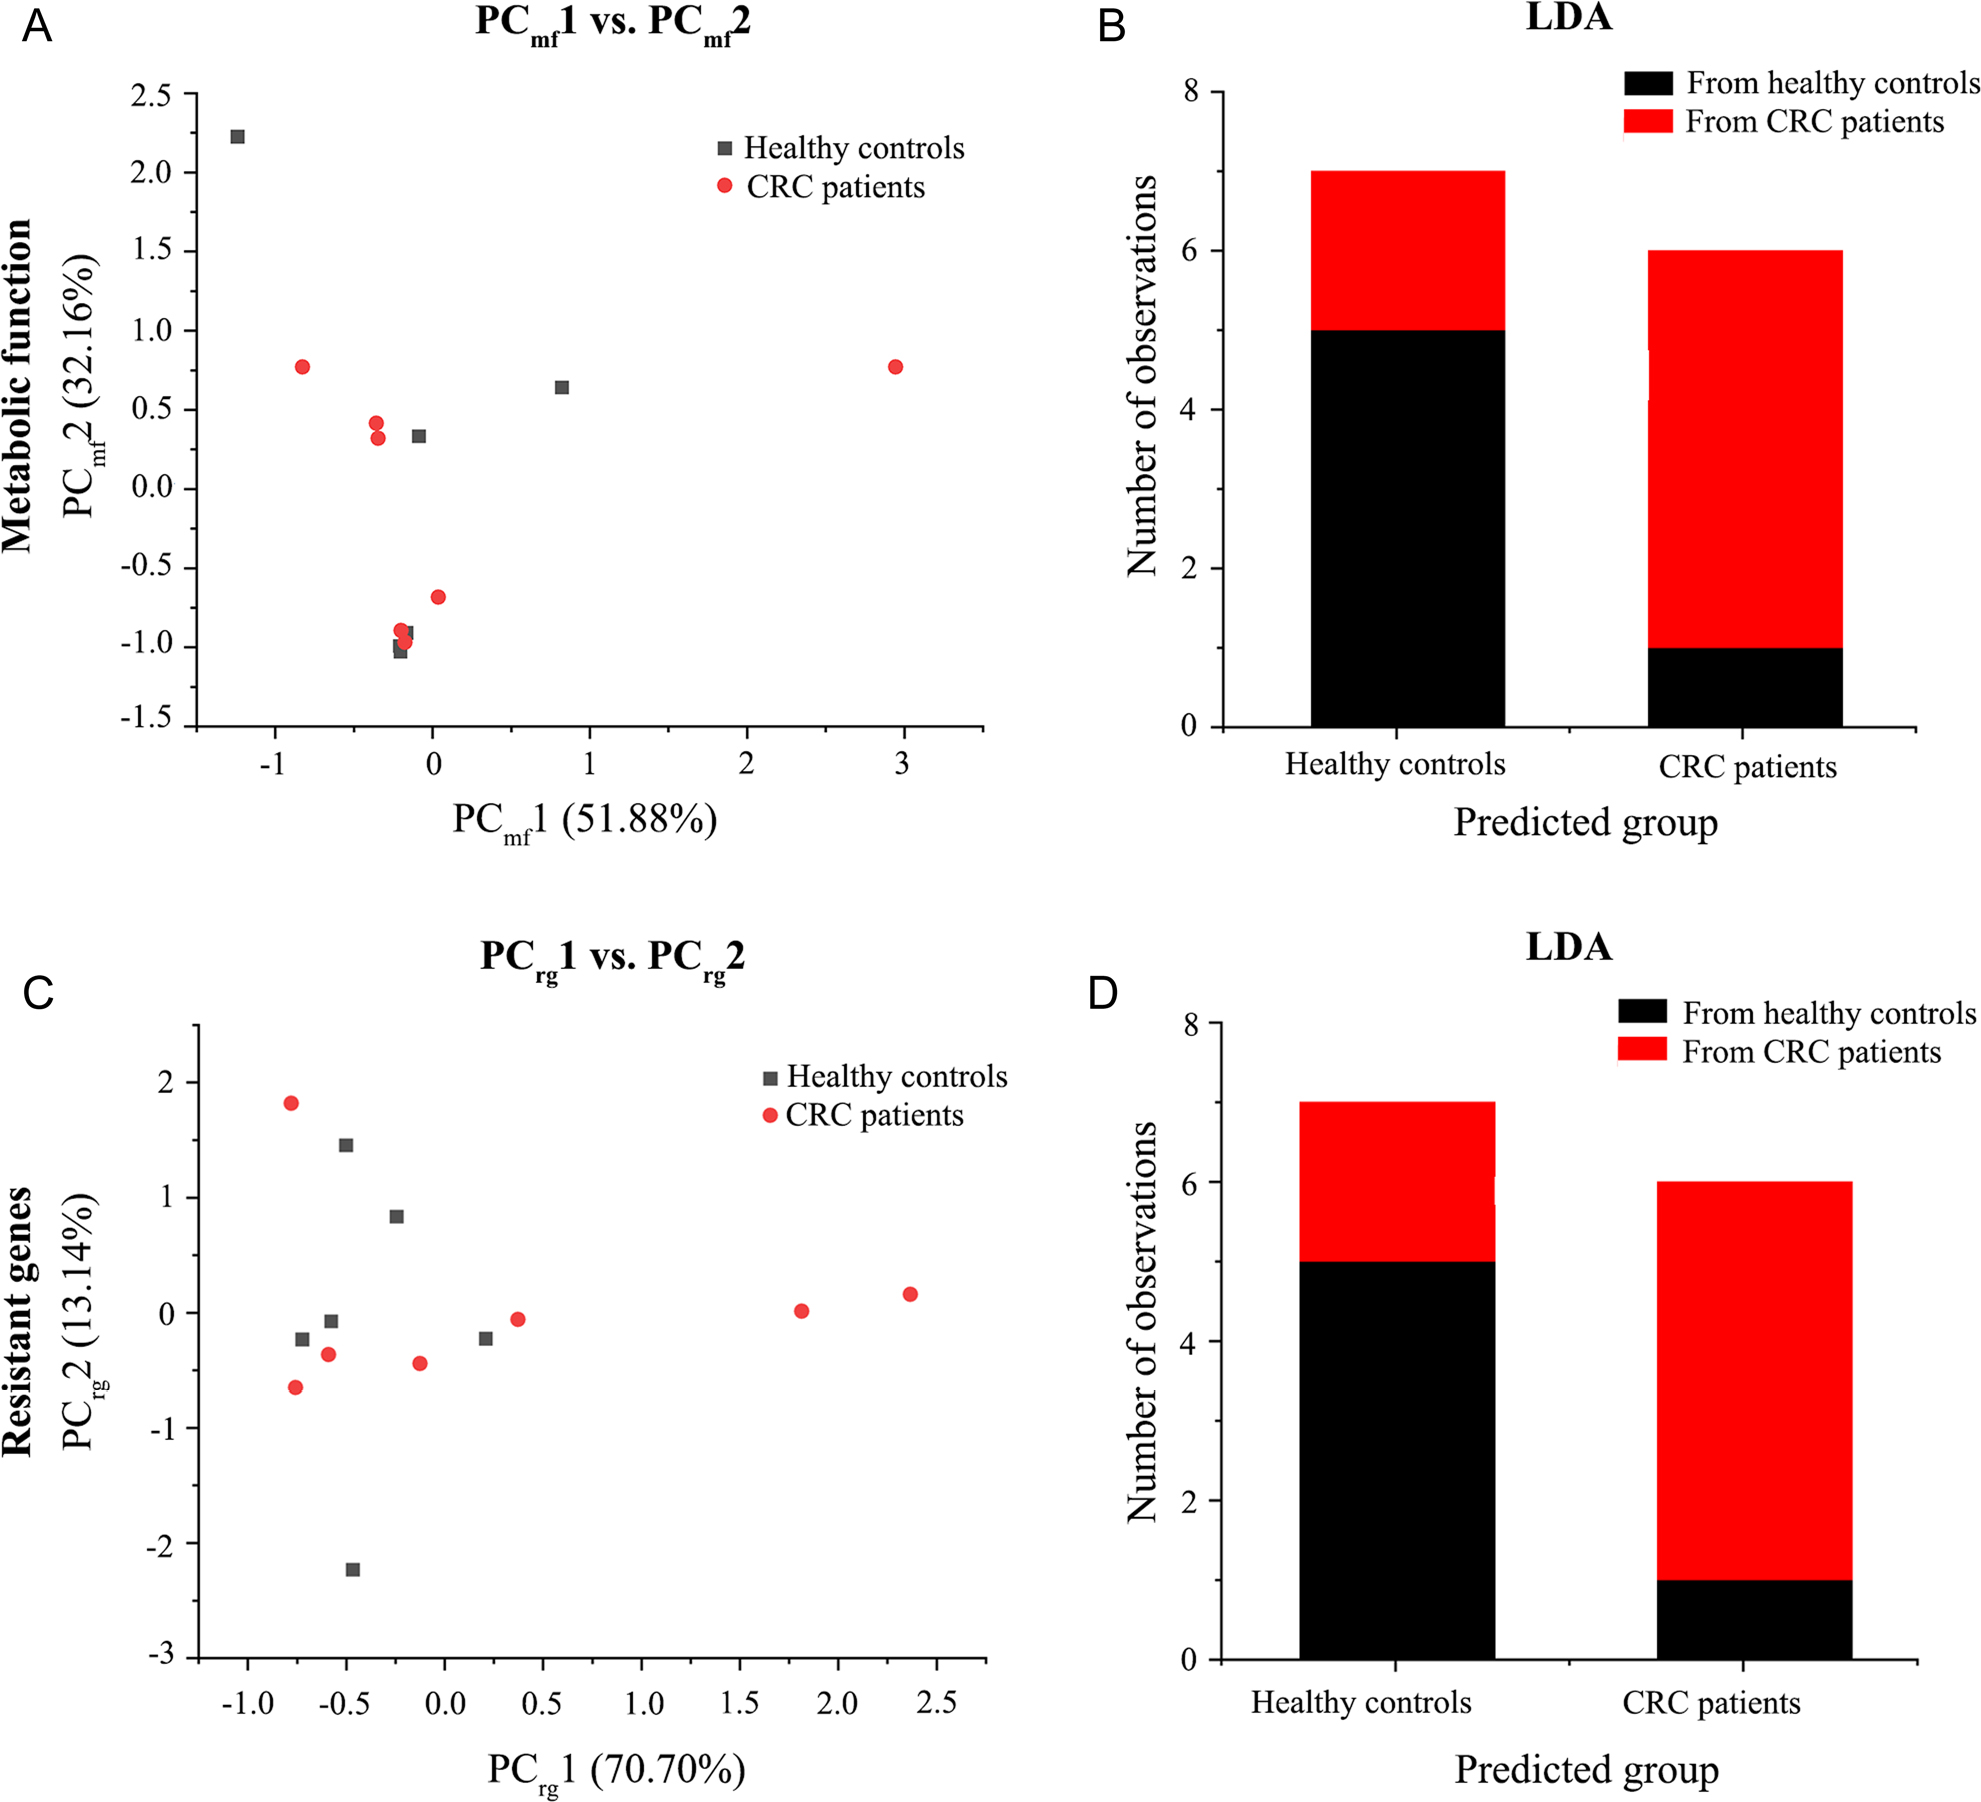
Fig. 4.
Multivariate analysis of metabolic functions and resistant genes in CRC patients and healthy controls. CRC – colorectal cancer, LDA – linear discriminant analyse
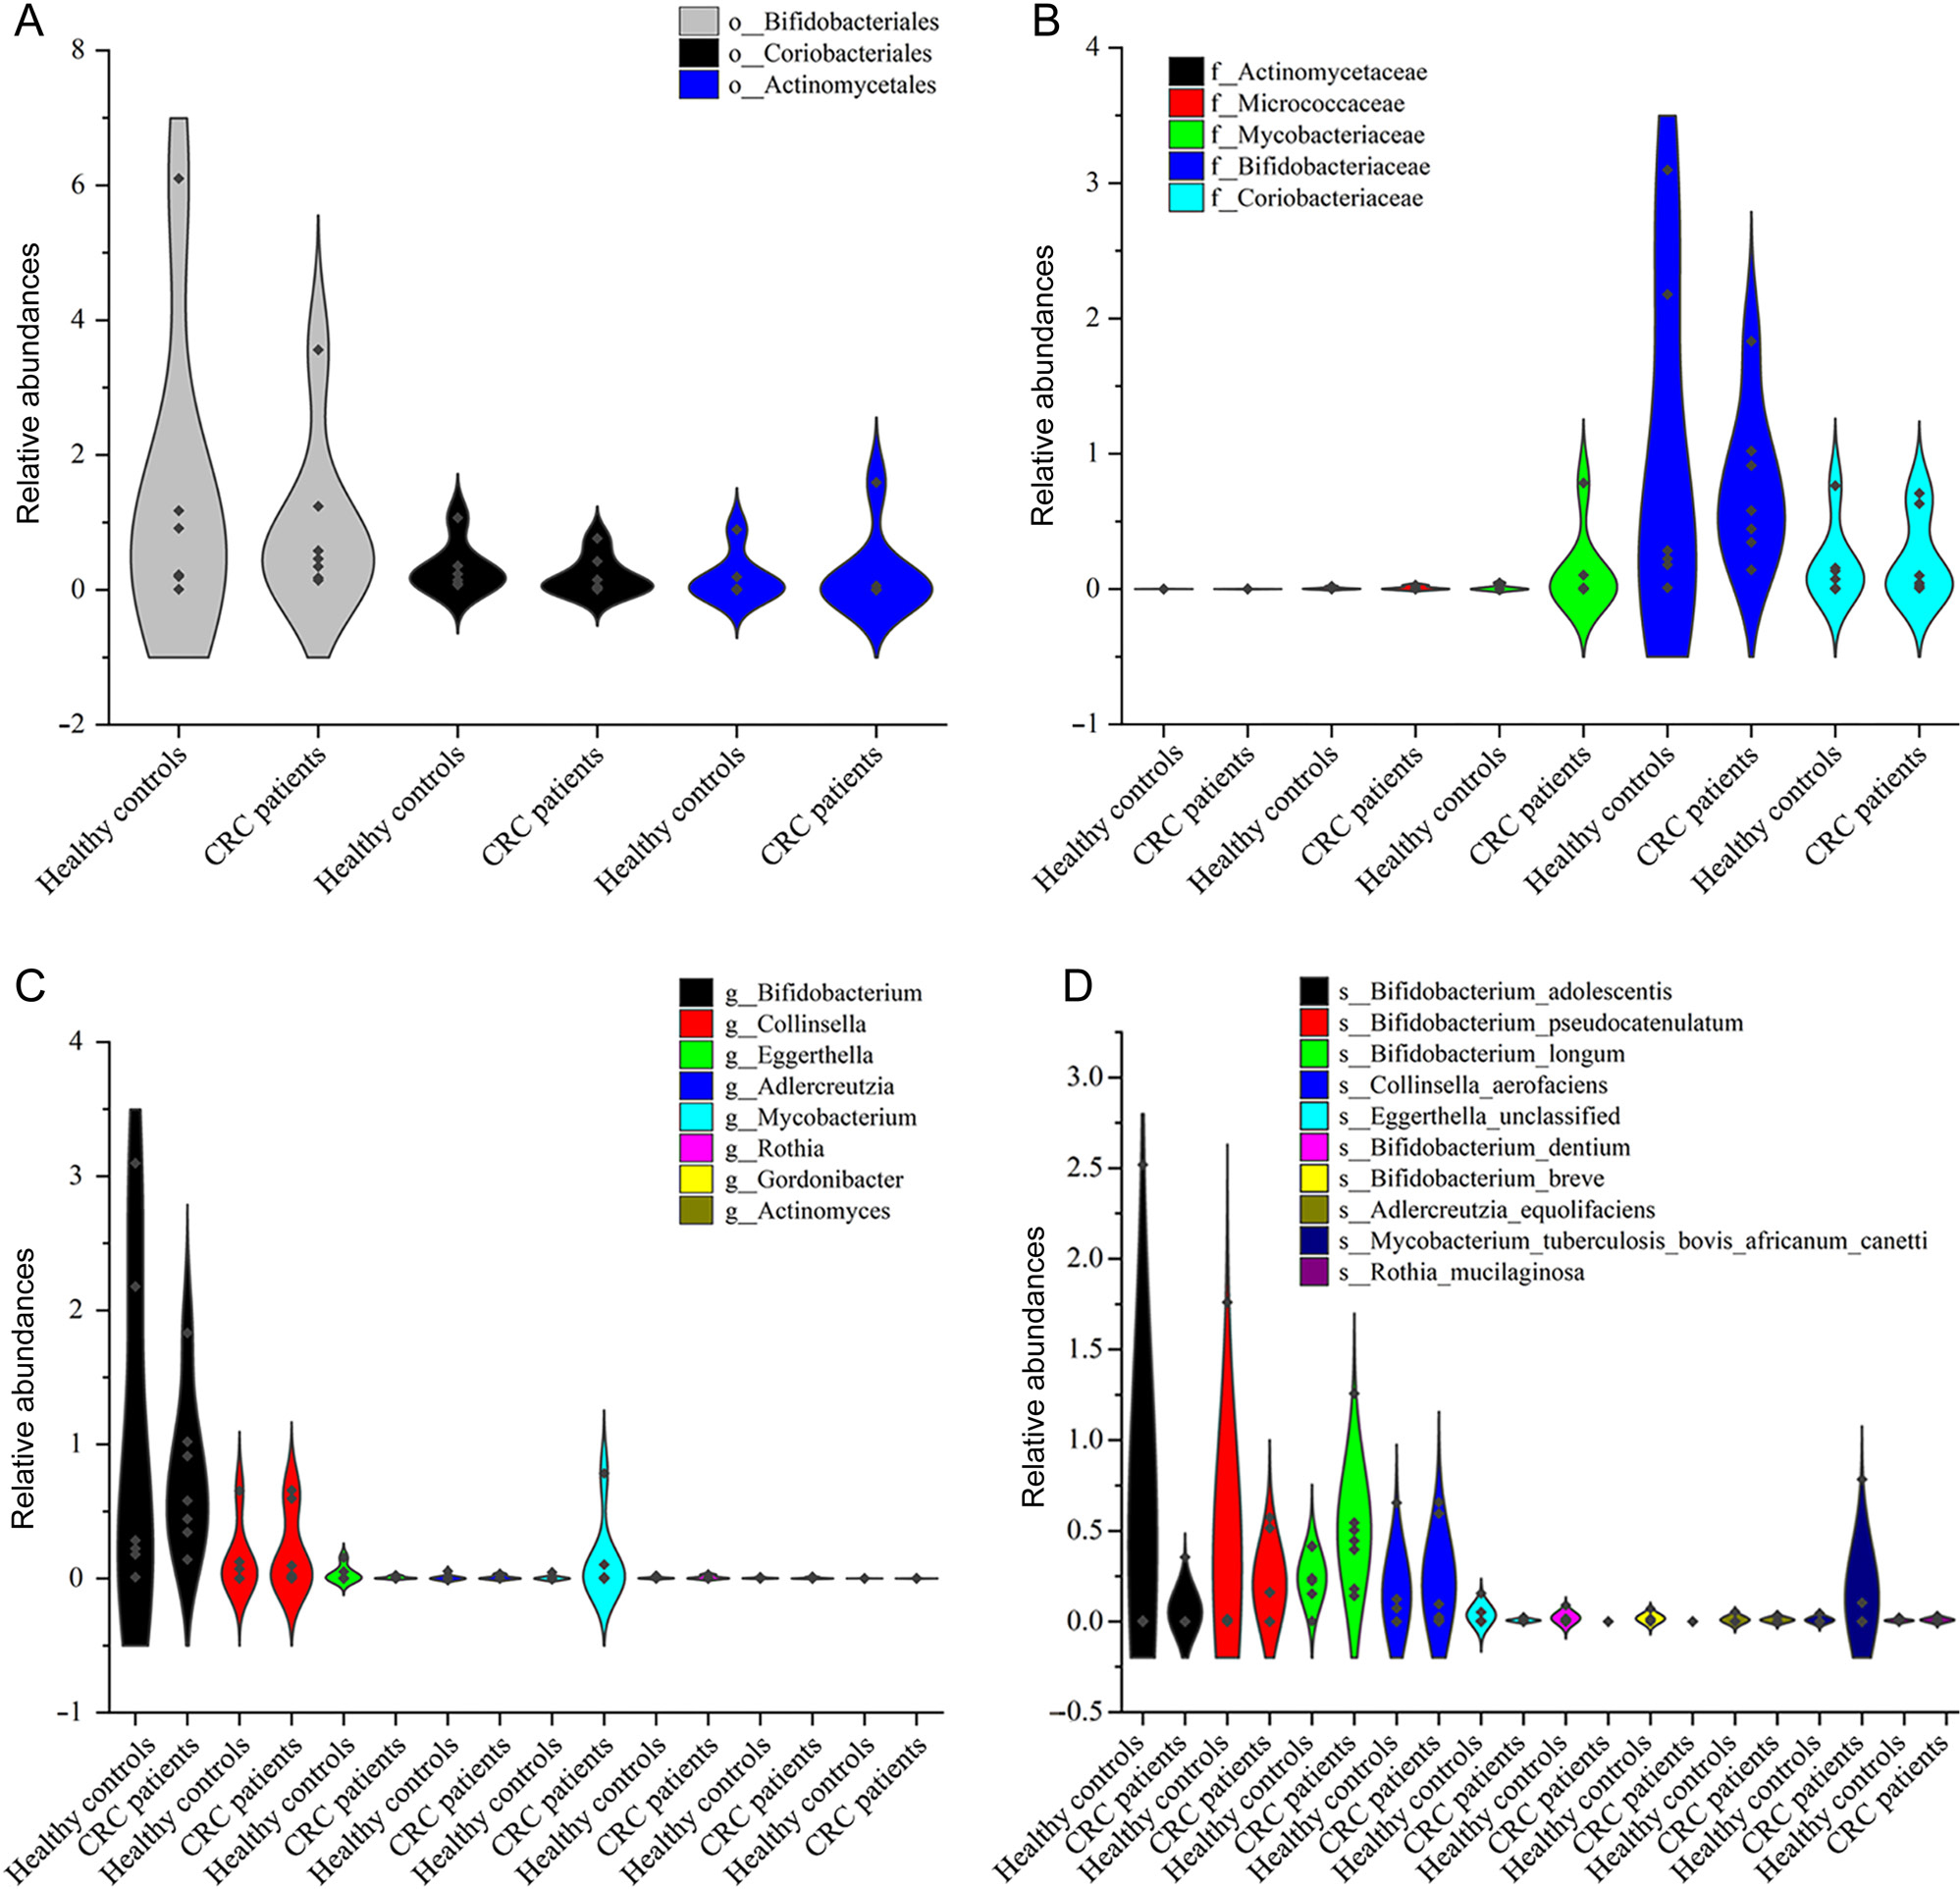
Fig. 5.
Comparison of Actinobacteria at the A) order, B) family, C) genus and D) species level in CRC patients and the healthy control group. CRC – colorectal cancer