
Table I
Enrichment factor (EF) scale, according to Sutherland (2000).
| EF = < 2 | deficient to low enrichment |
| EF = 2–5 | moderate enrichment |
| EF = 5–20 | considerable enrichment |
| EF = 20–40 | high enrichment |
| E = > 40 | extremely high enrichment |
Table II
Contamination categories for Igeo values (Huu et al. 2010).
| Igeo < 0 | unpolluted |
| 0 ≤ Igeo < 1 | unpolluted to moderately contaminated |
| 1 ≤ Igeo < 2 | moderately contaminated |
| 2 ≤ Igeo < 3 | moderately to strongly contaminated |
| 3 ≤ Igeo < 4 | strongly contaminated |
| 4 ≤ Igeo < 5 | strongly to extremely contaminated |
| Igeo ≥ 5 | extremely contaminated |
Table III
Heavy metal concentration in soil collected from Donja Paklenica.
| Soil type | Cd | Ni | Mn | Pb | Co | Zn | Cr | Cu | Fe | |
|---|---|---|---|---|---|---|---|---|---|---|
| Donja Paklenica | HM (ppm) | 0 | 1,912.45 | 1042.51 | 5.76 | 87.7 | 33.69 | 203.42 | 22.19 | 16,983 |
| EF | − | 56.305 | 1.637 | 0.242 | 8.607 | 0.749 | 5.208 | 2.904 | − | |
| Igeo | − | 5.202 | 0.238 | -2.505 | 2.634 | -0.891 | 1.9178 | 1.0570 | -0.472 | |
| TV | HM (ppm) | 0.8a | 35a | − | 85a | 20a | 50a | 100a | 36a | − |
| IV | HM (ppm) | 12a | 210a | 3,000–40,000c | 530b | 240b | 720b | 380a | 190b | 3,000–500,000d |
1 IV – intervention values, serious concentration of heavy metals in soil, remediation needed. Heavy metal concentrations above TV and IV values are marked in bold.
1c ATSDR, 2008
Table IV
The content of macroelements in soil collected from Donja Paklenica.
| Locality/Element | Ca (%) | Mg (%) | K (%) | Ca/Mg |
|---|---|---|---|---|
| Donja Paklenica | 0.009 | 1.439 | 0.036 | 0.0063 |
Table V
All Identified Rb and Eb with heavy metal resistance, nitrogen fixation, and ACC deaminase activity.
| Isolate | PGP properties | Heavy metal resistance | |||||
|---|---|---|---|---|---|---|---|
| Nitrogen fixation | ACC deaminase activity | Growth on TY agar plates supplemented with heavy metals 14 d | |||||
| Blue color, pellicle 7 d | Growth on DF + ACC agar plates | Ni 100 mg/l | Ni 200 mg/l | Cu 100 mg/l | Cu 200 mg/l | Co 100 mg/l | |
| Rb1-Pseudomonas sp. | + | + | + | + | + | − | + |
| Rb2-Pseudomonas sp. | + | + | + | + | + | − | + |
| Rb3-Pseudomonas sp. | + | + | + | + | + | − | + |
| Rb4-Pseudomonas sp. | + | + | + | + | + | − | + |
| Rb5-Pseudomonas sp. | + | + | + | + | + | − | + |
| Rb6-Pseudomonas sp. | + | + | + | + | + | − | + |
| Rb7-Pseudomonas sp. | + | + | + | + | + | − | + |
| Rb8-Pseudomonas sp. | + | + | + | + | + | − | + |
| Rb9-Bacillus sp. | + | + | + | − | − | − | − |
| Rb10-Pseudomonas sp. | + | + | + | + | + | − | + |
| Rb11-Pseudomonas sp. | + | + | + | + | + | − | + |
| Rb12-Pseudomonas sp. | + | + | + | + | + | − | + |
| Rb13-Pseudomonas sp. | + | + | + | + | + | − | + |
| Rb14-Pseudomonas sp. | + | − | + | + | + | − | + |
| Eb1-Bacillus sp. | + | + | − | − | + | − | + |
| Eb2-Staphylococcus sp. | + | + | + | − | + | − | + |
| Eb3-Bacillus sp. | + | + | − | − | + | − | + |
| Eb4-Bacillus sp. | + | − | − | − | + | − | + |
| Eb5-Bacillus sp. | − | − | − | − | − | − | − |
| Eb6-Bacillus sp. | + | + | + | − | − | − | − |
| Eb7-Pseudomonas sp. Eb8-Brevibacterium/ | + | − | − | − | − | − | − |
| Peribacillus/Bacillus sp. | − | + | + | − | − | − | − |
| Eb9-Lysinibacillus sp. | + | − | − | − | − | − | − |
| Eb10-Bacillus sp. | − | − | − | − | − | − | − |
| Eb11-Bacillus sp. | + | + | − | − | − | − | − |
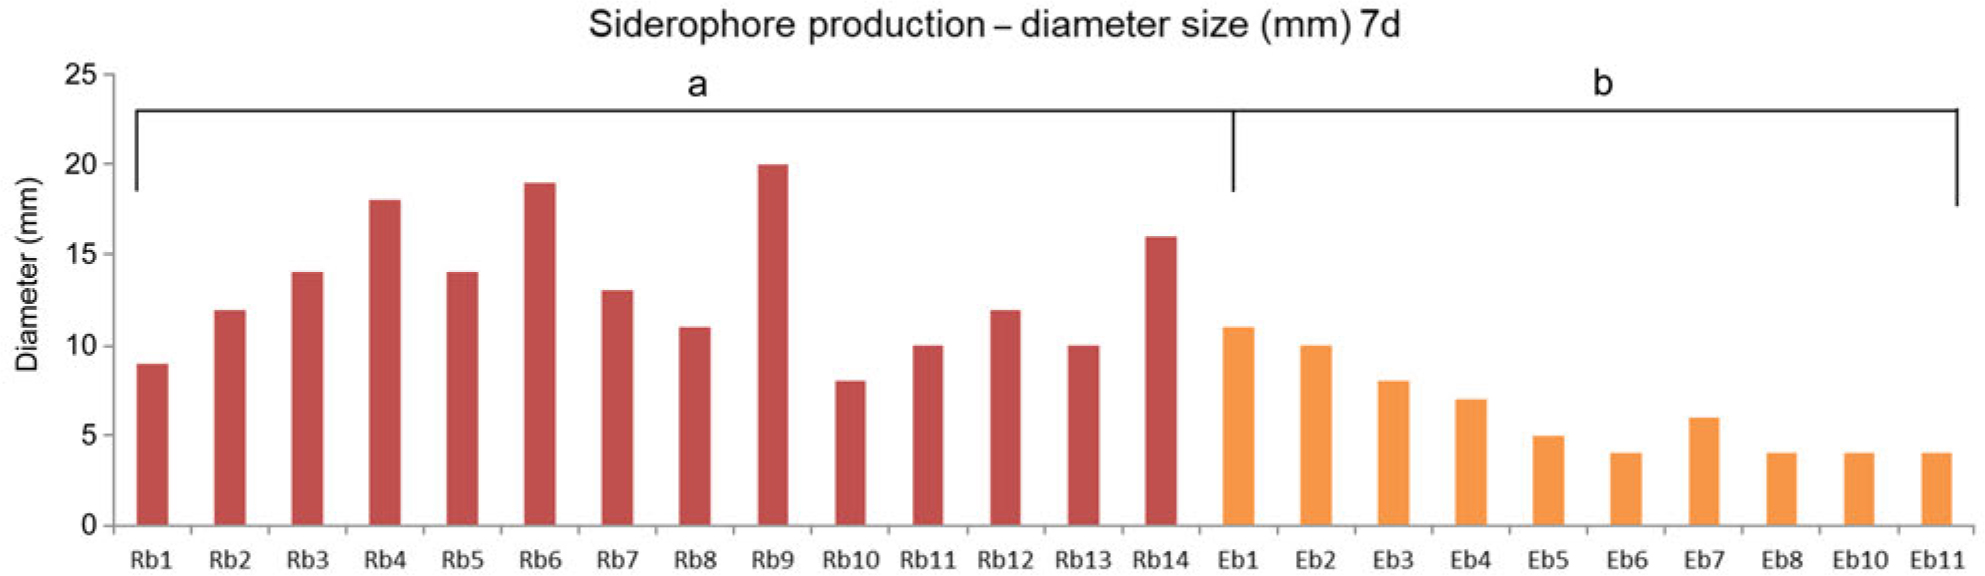
Fig 1.
Qualitative analysis of siderophore production of Rb and Eb isolates. Different characters indicate statistical differences between groups (p < 0.05).
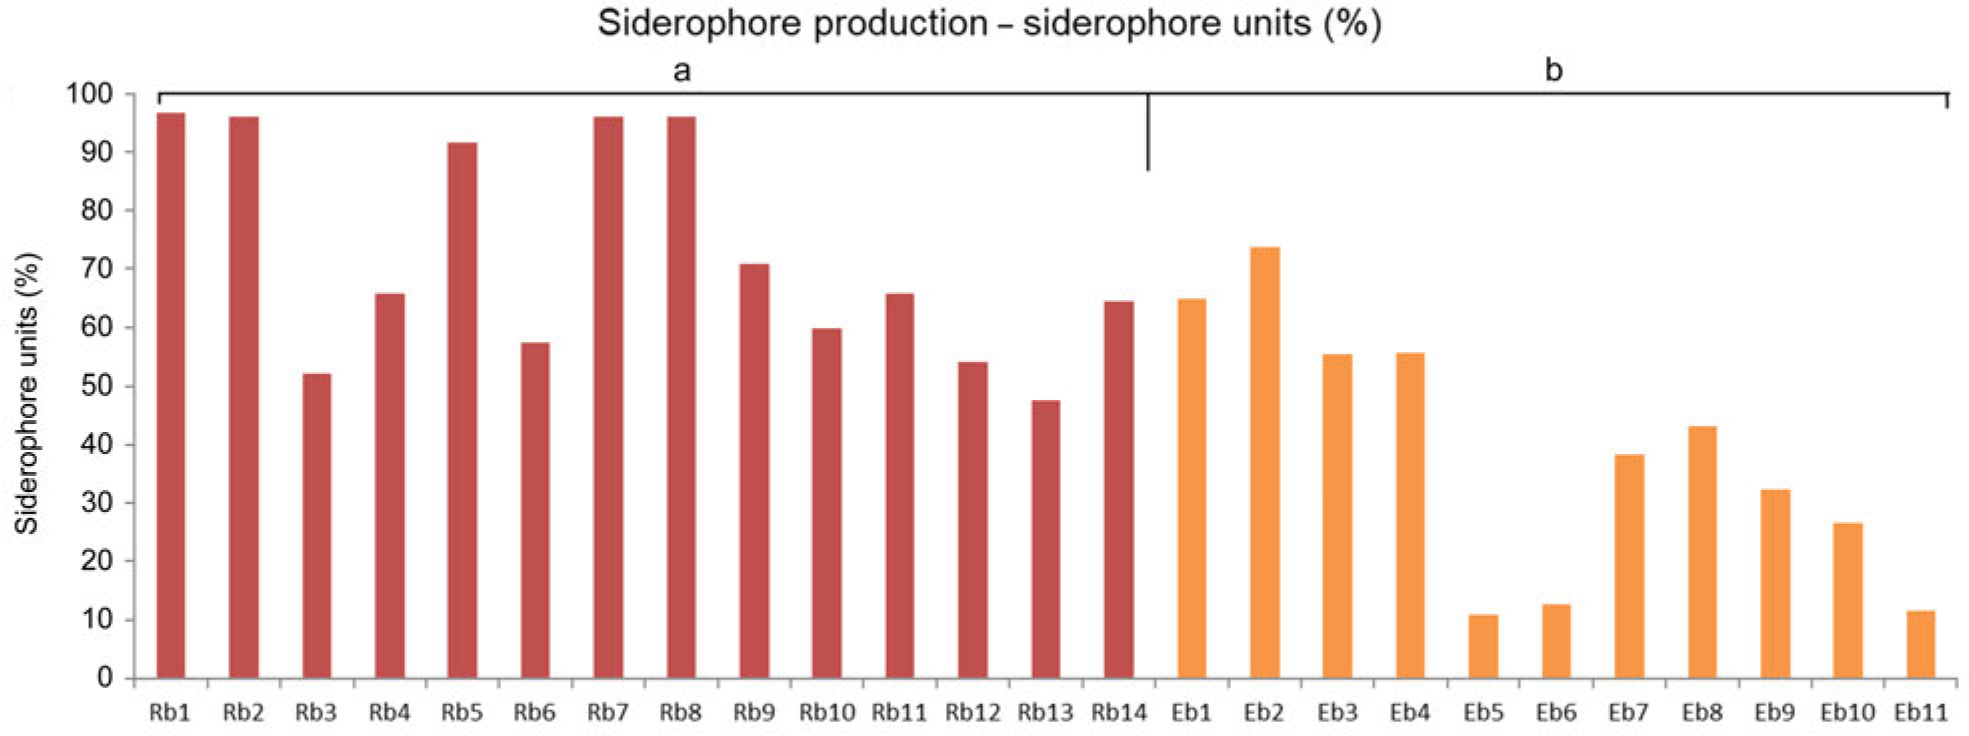
Fig 2.
Quantitative analysis of siderophore production of Rb and Eb isolates. Different characters indicate statistical differences between groups (p < 0.05).
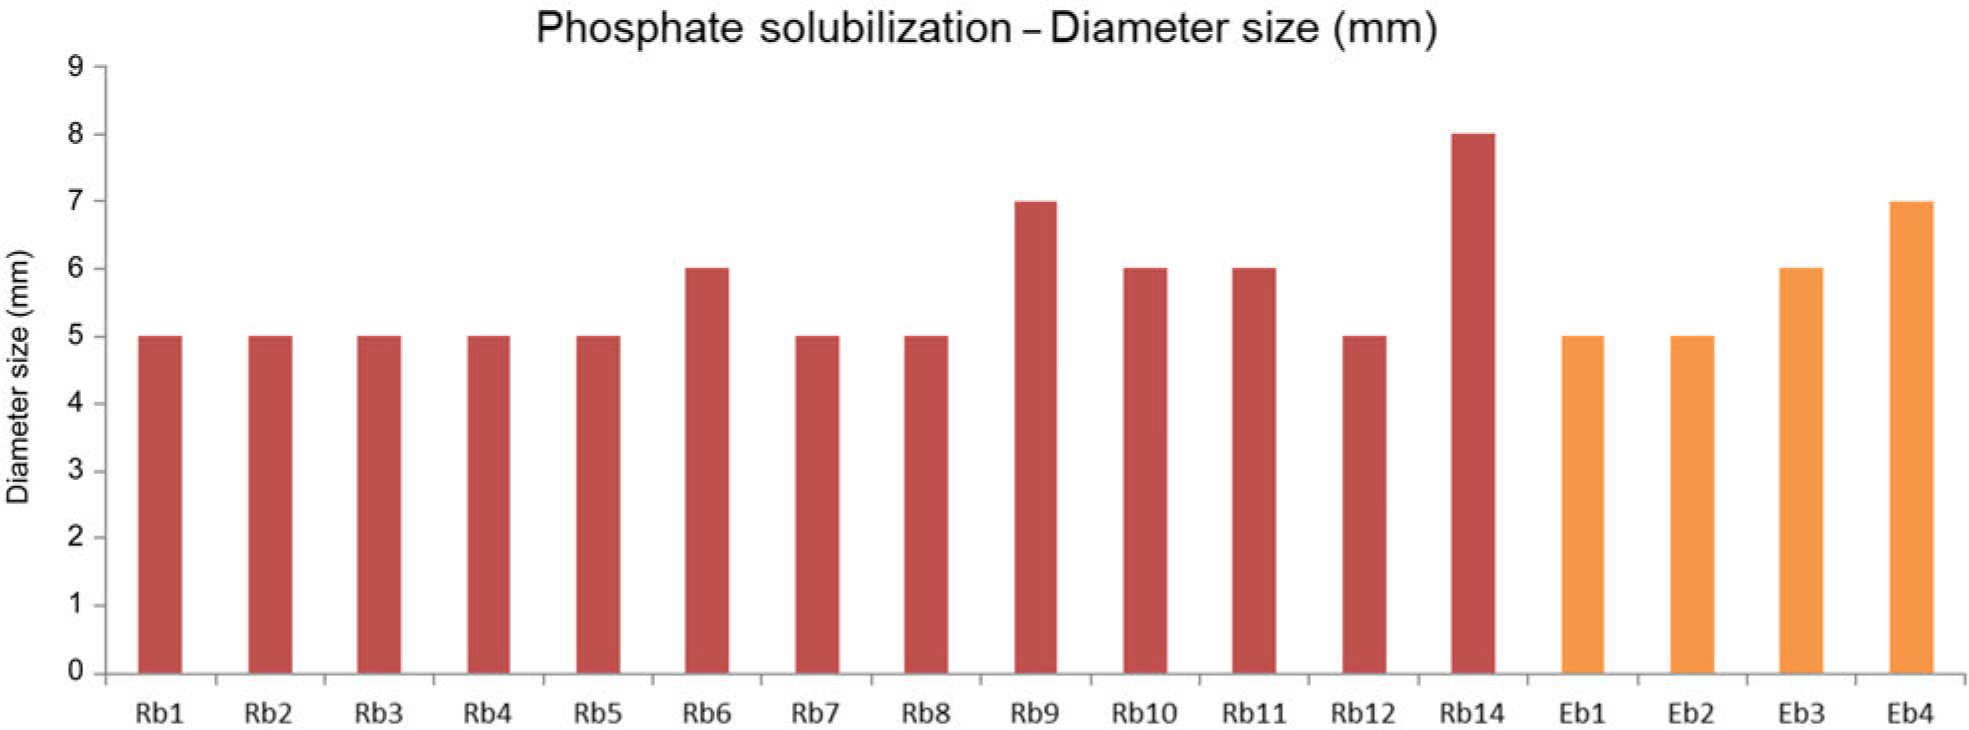
Fig 3.
Qualitative analysis of phosphate solubilization of Rb and Eb isolates.
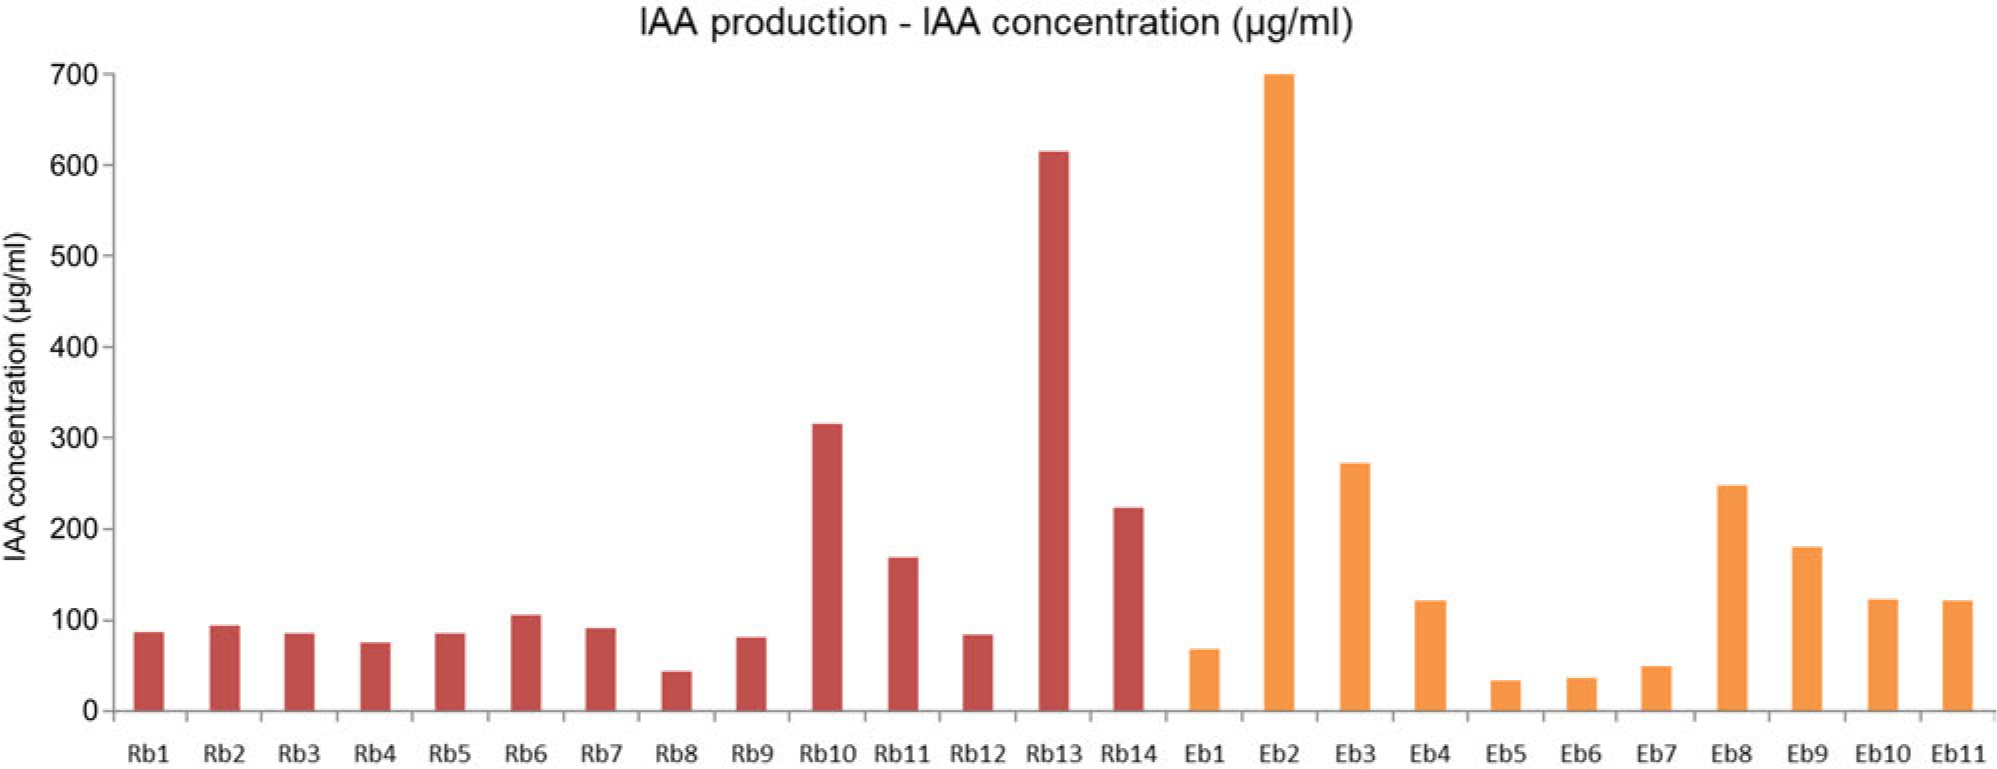
Fig 4.
Quantitative analysis of indol-3-acid (IAA) production of Rb and Eb isolates.
Table VI
BLAST results after sequence editing of Rb and Eb sequences.
| Isolate | Max score | Total score | Query cover | Query length | E-value | Percentage identity | Accession |
|---|---|---|---|---|---|---|---|
| Rb1-Pseudomonas sp. | 1033 | 1033 | 100% | 559 | 0.0 | 100.00% | MT555396.1 |
| Rb2-Pseudomonas sp. | 1029 | 1029 | 100% | 567 | 0.0 | 99.47% | MT955582.1 |
| Rb3-Pseudomonas sp. | 1007 | 1007 | 98% | 569 | 0.0 | 98.93% | MH018885.1 |
| Rb4-Pseudomonas sp. | 1026 | 1026 | 99% | 560 | 0.0 | 99.64% | KJ598026.1 |
| Rb5-Pseudomonas sp. | 1035 | 1035 | 100% | 560 | 0.0 | 100.00% | MT626826.1 |
| Rb6-Pseudomonas sp. | 1033 | 1033 | 99% | 562 | 0.0 | 100.00% | PP738394.1 |
| Rb7-Pseudomonas sp. | 1024 | 1024 | 100% | 558 | 0.0 | 98.82% | MN006008.1 |
| Rb8-Pseudomonas sp. | 1024 | 1024 | 100% | 558 | 0.0 | 98.82% | MT373558.1 |
| Rb9-Bacillus sp. | 1037 | 1037 | 97% | 573 | 0.0 | 100.00% | MG571235.1 |
| Rb10-Pseudomonas sp. | 1026 | 1026 | 99% | 561 | 0.0 | 99.64% | HM755479.1 |
| Rb11-Pseudomonas sp. | 1026 | 1026 | 99% | 560 | 0.0 | 99.64% | MH717340.1 |
| Rb12-Pseudomonas sp. | 1024 | 1024 | 100% | 558 | 0.0 | 99.82% | MT280204.1 |
| Rb13-Pseudomonas sp. | 957 | 957 | 100% | 518 | 0.0 | 100.00% | KT695830.1 |
| Rb14-Pseudomonas sp. | 1024 | 1024 | 100% | 558 | 0.0 | 99.82% | MT533925.1 |
| Eb1-Bacillus sp. | 1040 | 1040 | 98% | 574 | 0.0 | 100.00% | MT071453.1 |
| Eb2-Staphylococcus sp. | 1038 | 1038 | 100% | 562 | 0.0 | 100.00% | KM021292.1 |
| Eb3-Bacillus sp. | 1033 | 1033 | 100% | 559 | 0.0 | 100.00% | MT586023.1 |
| Eb4-Bacillus sp. | 992 | 992 | 100% | 540 | 0.0 | 99.81% | MT032498.1 |
| Eb5-Bacillus sp. | 933 | 933 | 99% | 506 | 0.0 | 100.00% | MW767008.1 |
| Eb6-Bacillus sp. | 963 | 963 | 100% | 521 | 0.0 | 100.00% | MF375095.1 |
| Eb7-Pseudomonas sp. | 966 | 966 | 100% | 523 | 0.0 | 100.00% | OM527246.1 |
| Eb8-Brevibacterium/Peribacillus/Bacillus sp. | 996 | 996 | 100% | 555 | 0.0 | 98.93% | MT538263.1 KY323319.1 |
| Eb9-Lysinibacillus sp. | 942 | 942 | 100% | 510 | 0.0 | 100.00% | OR104997.1 |
| Eb10-Bacillus sp. | 957 | 957 | 100% | 518 | 0.0 | 100.00% | MF111532.1 |
| Eb11-Bacillus sp. | 1033 | 1033 | 100% | 559 | 0.0 | 100.00% | MF111382.1 |