
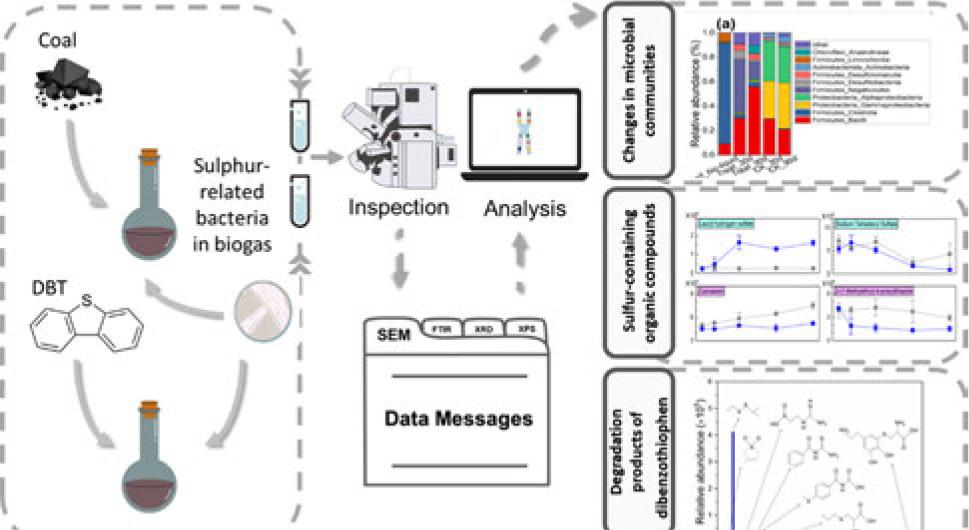
Fig. 1.
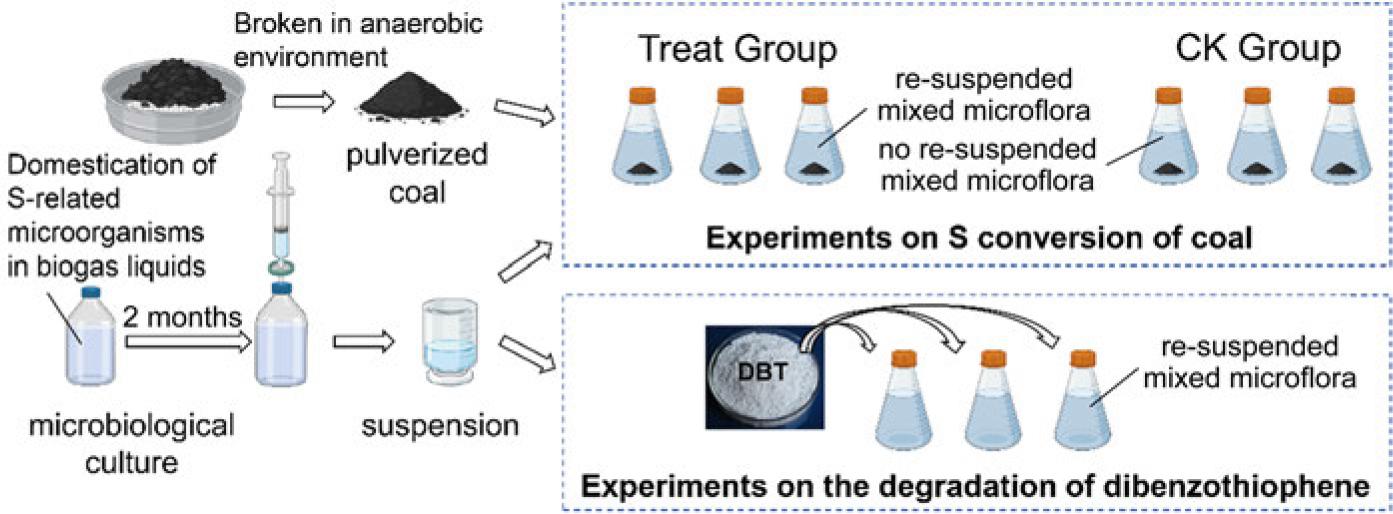
Fig. 2
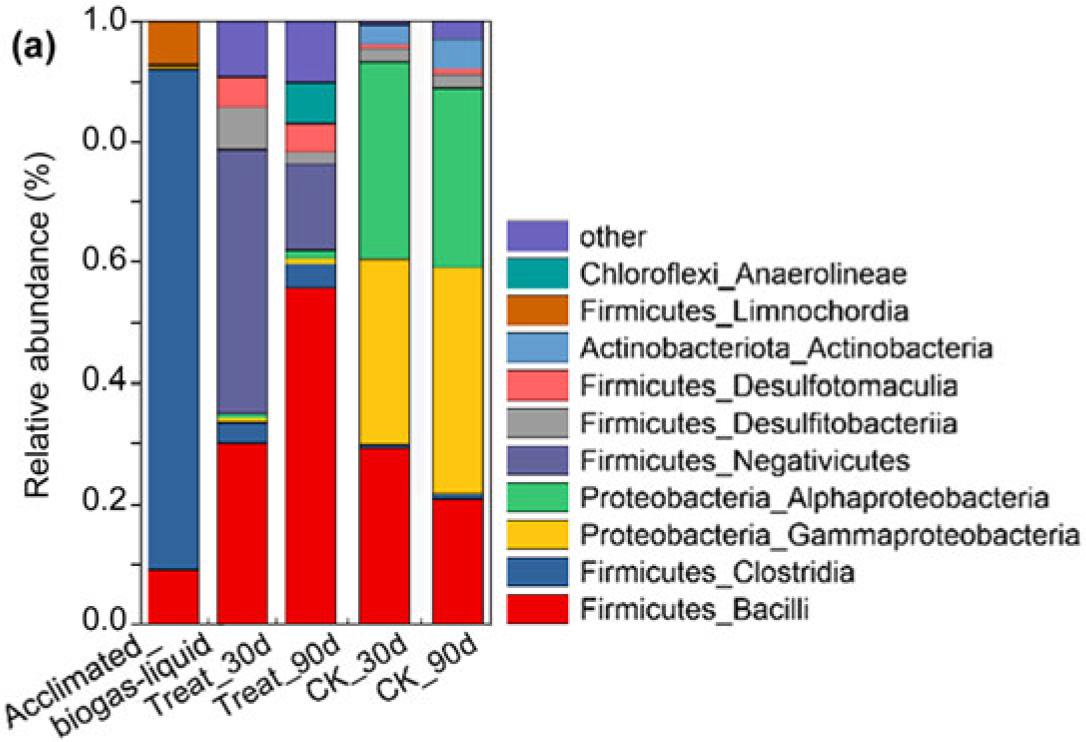
Fig. 3.
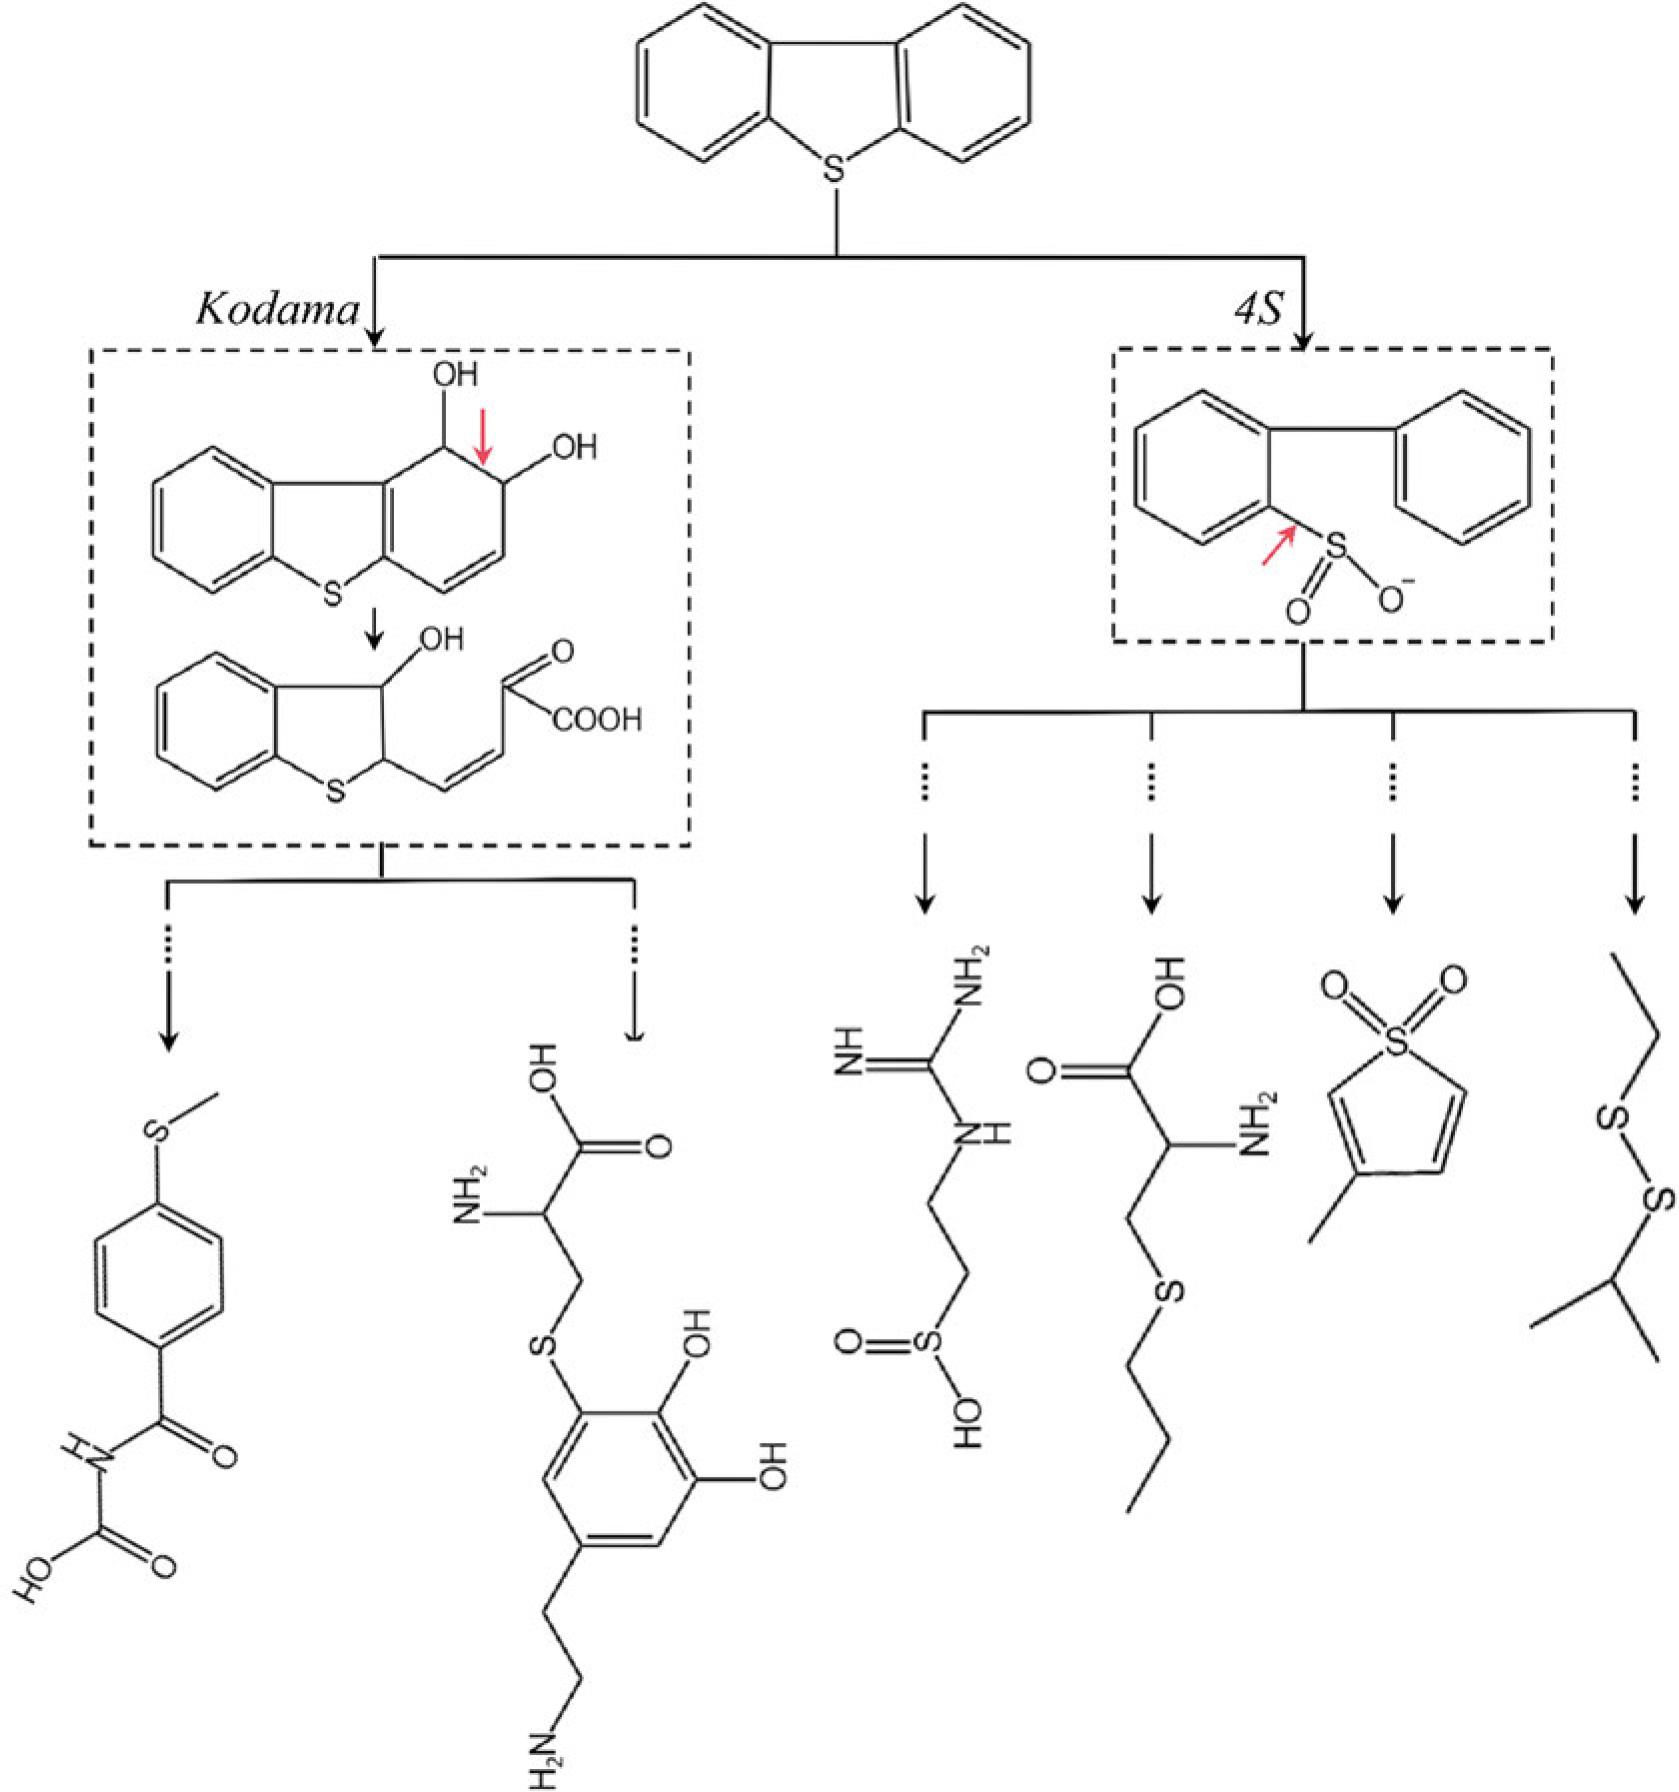
Fig. 4.
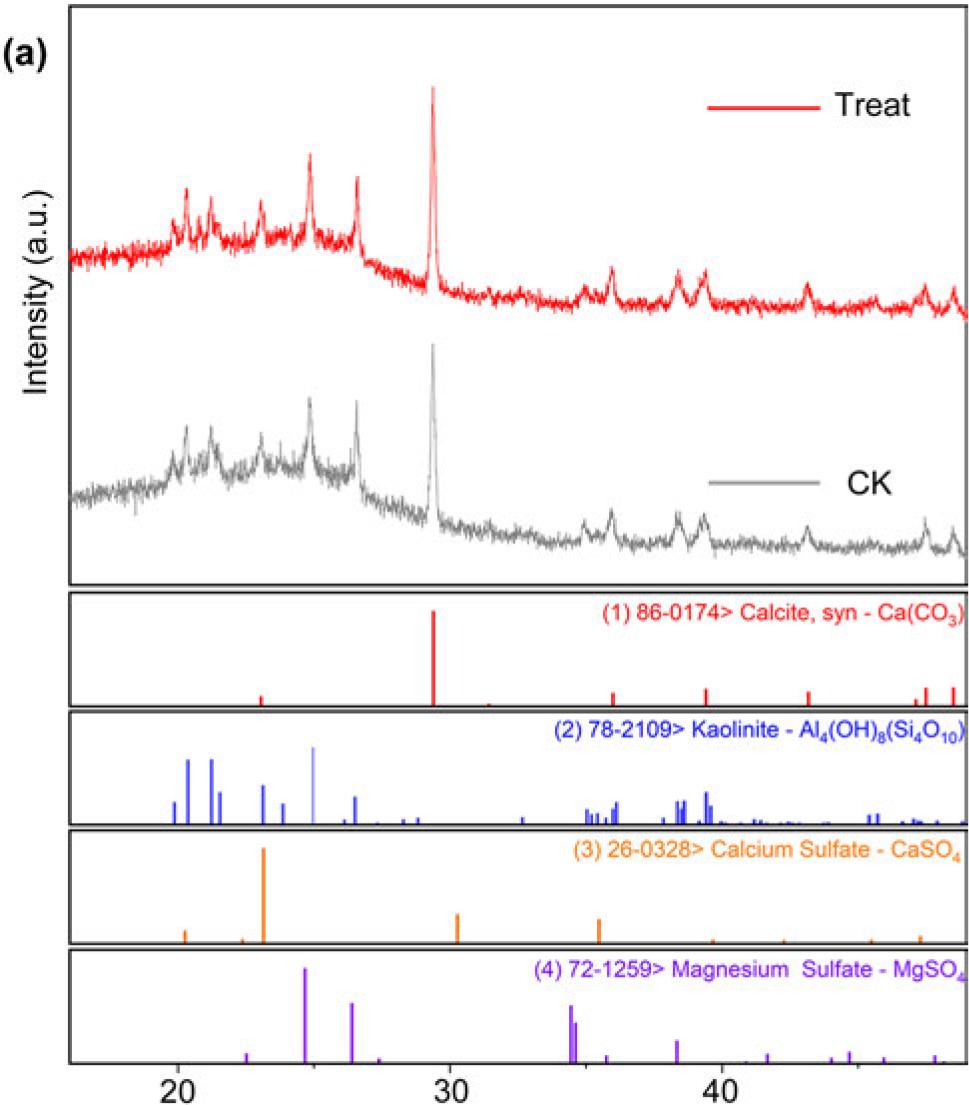
Fig. 5.
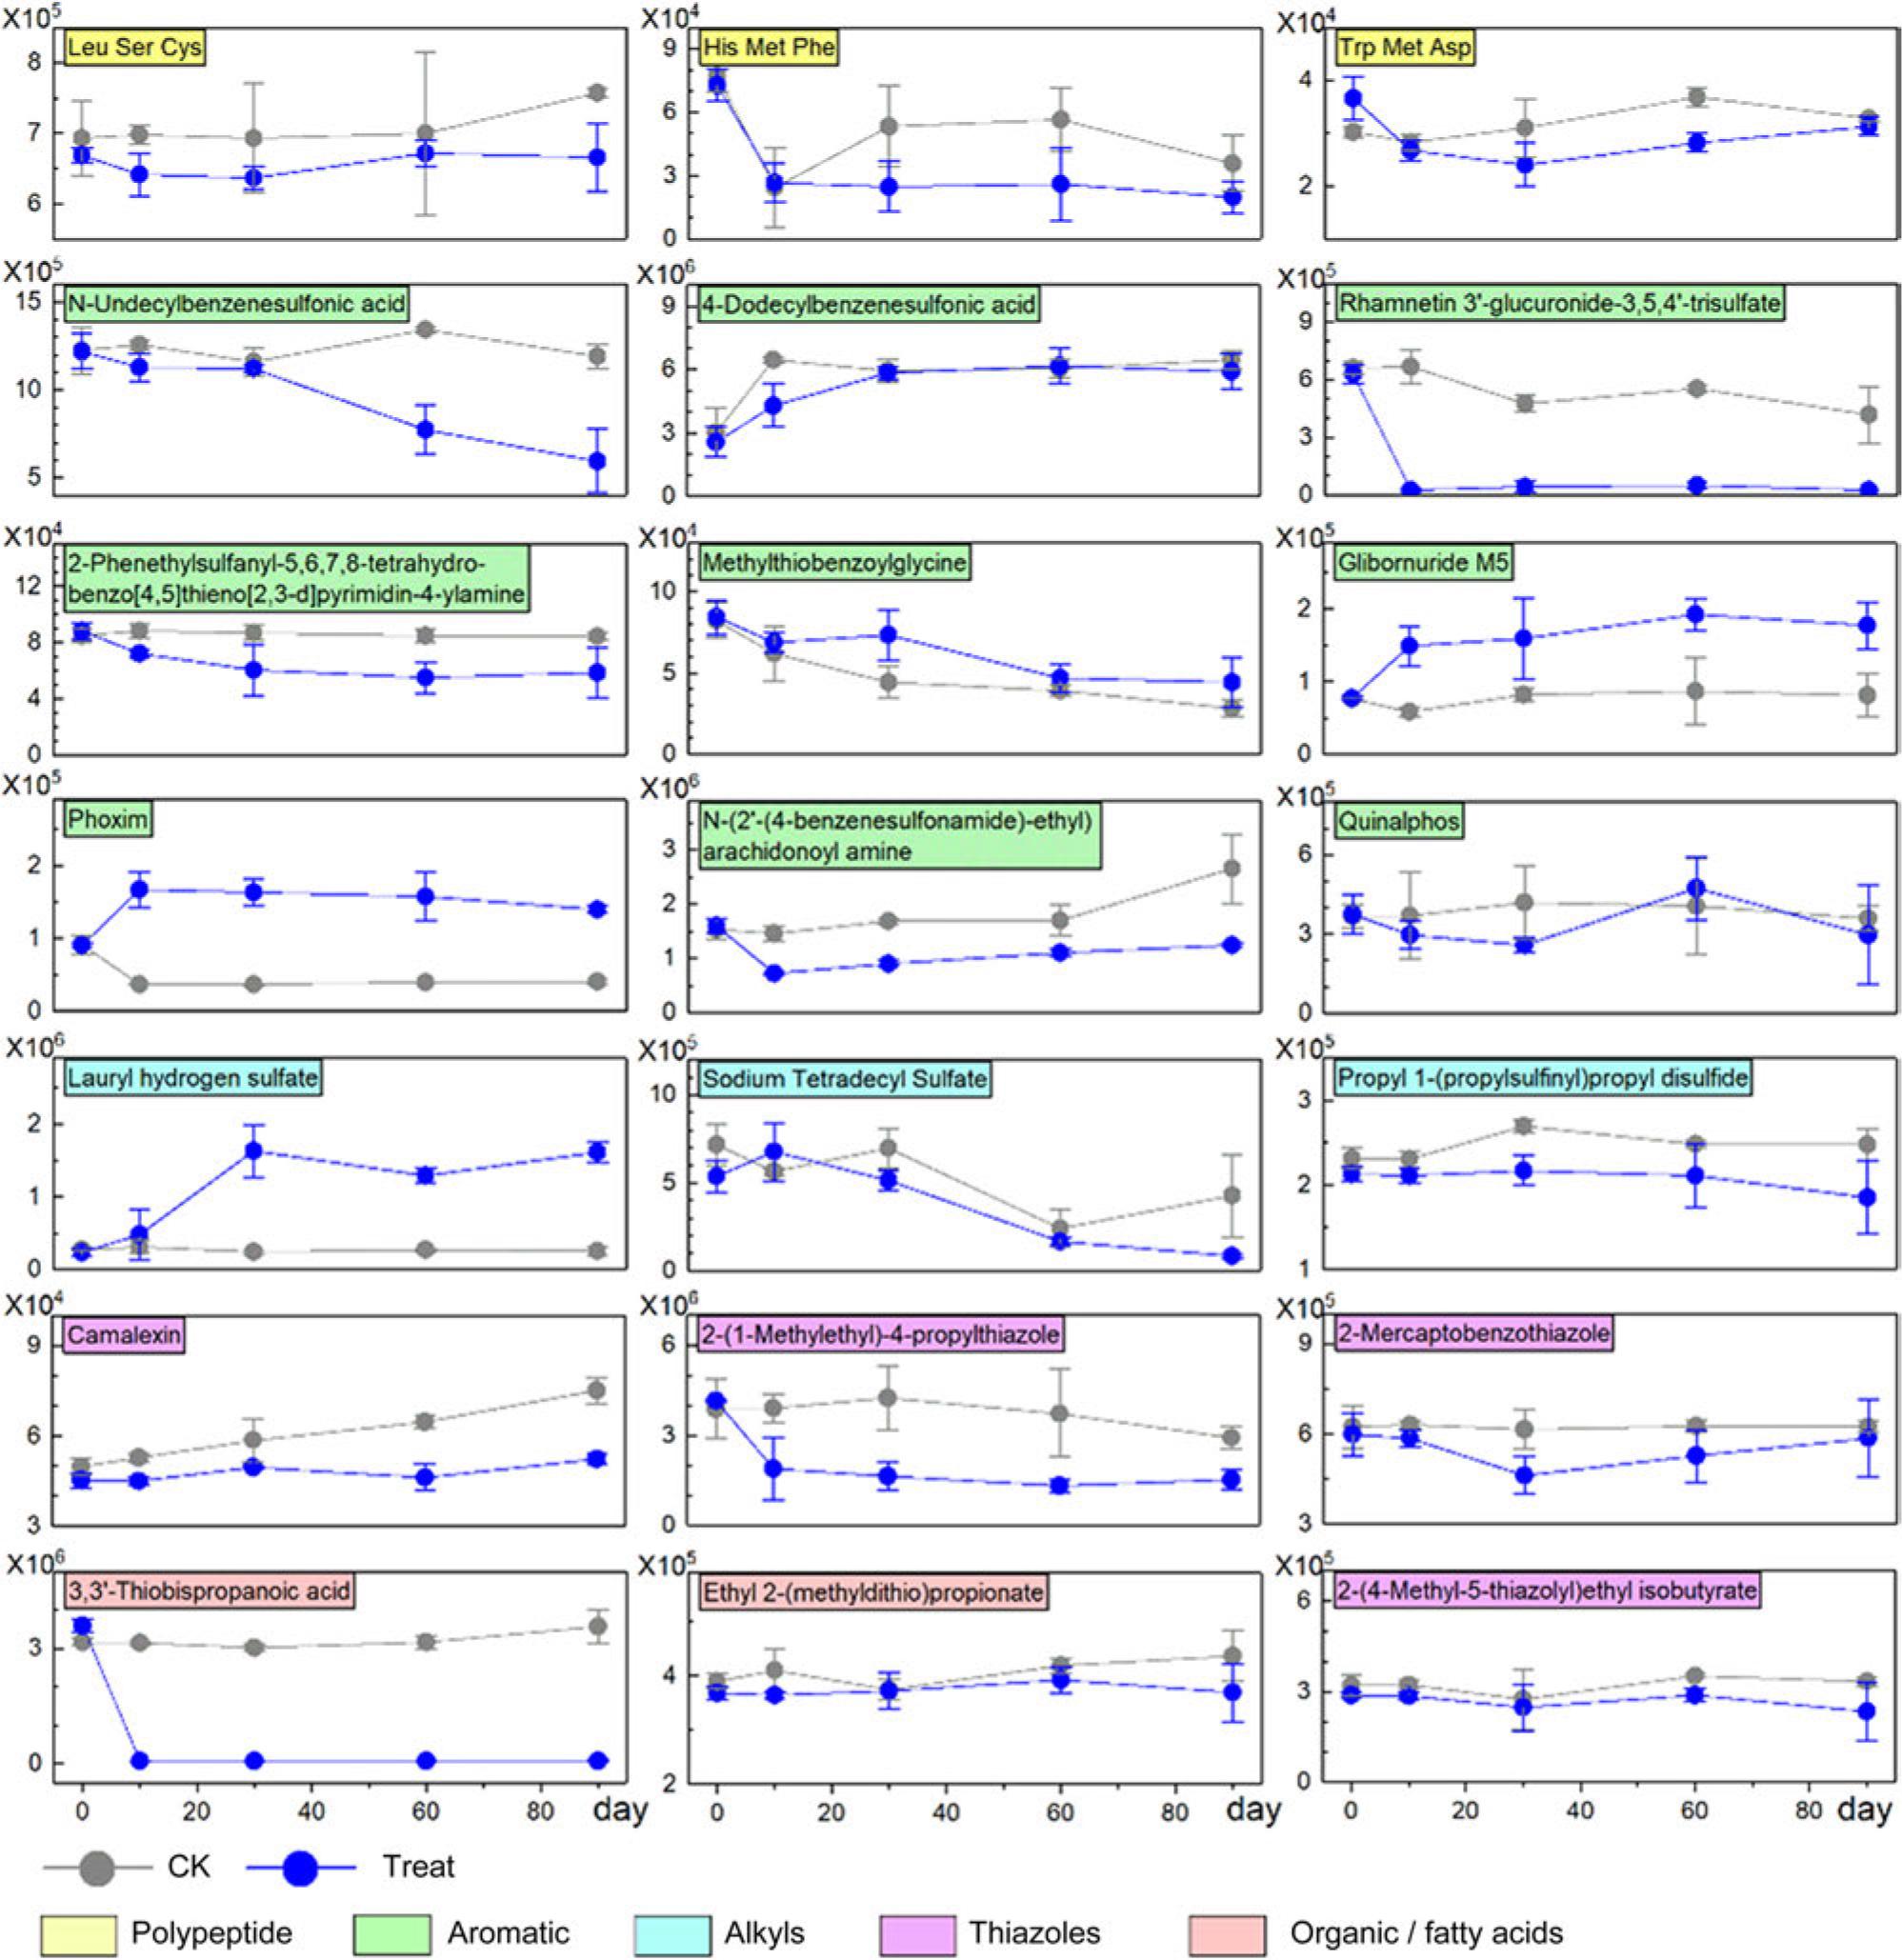
Fig. 6.
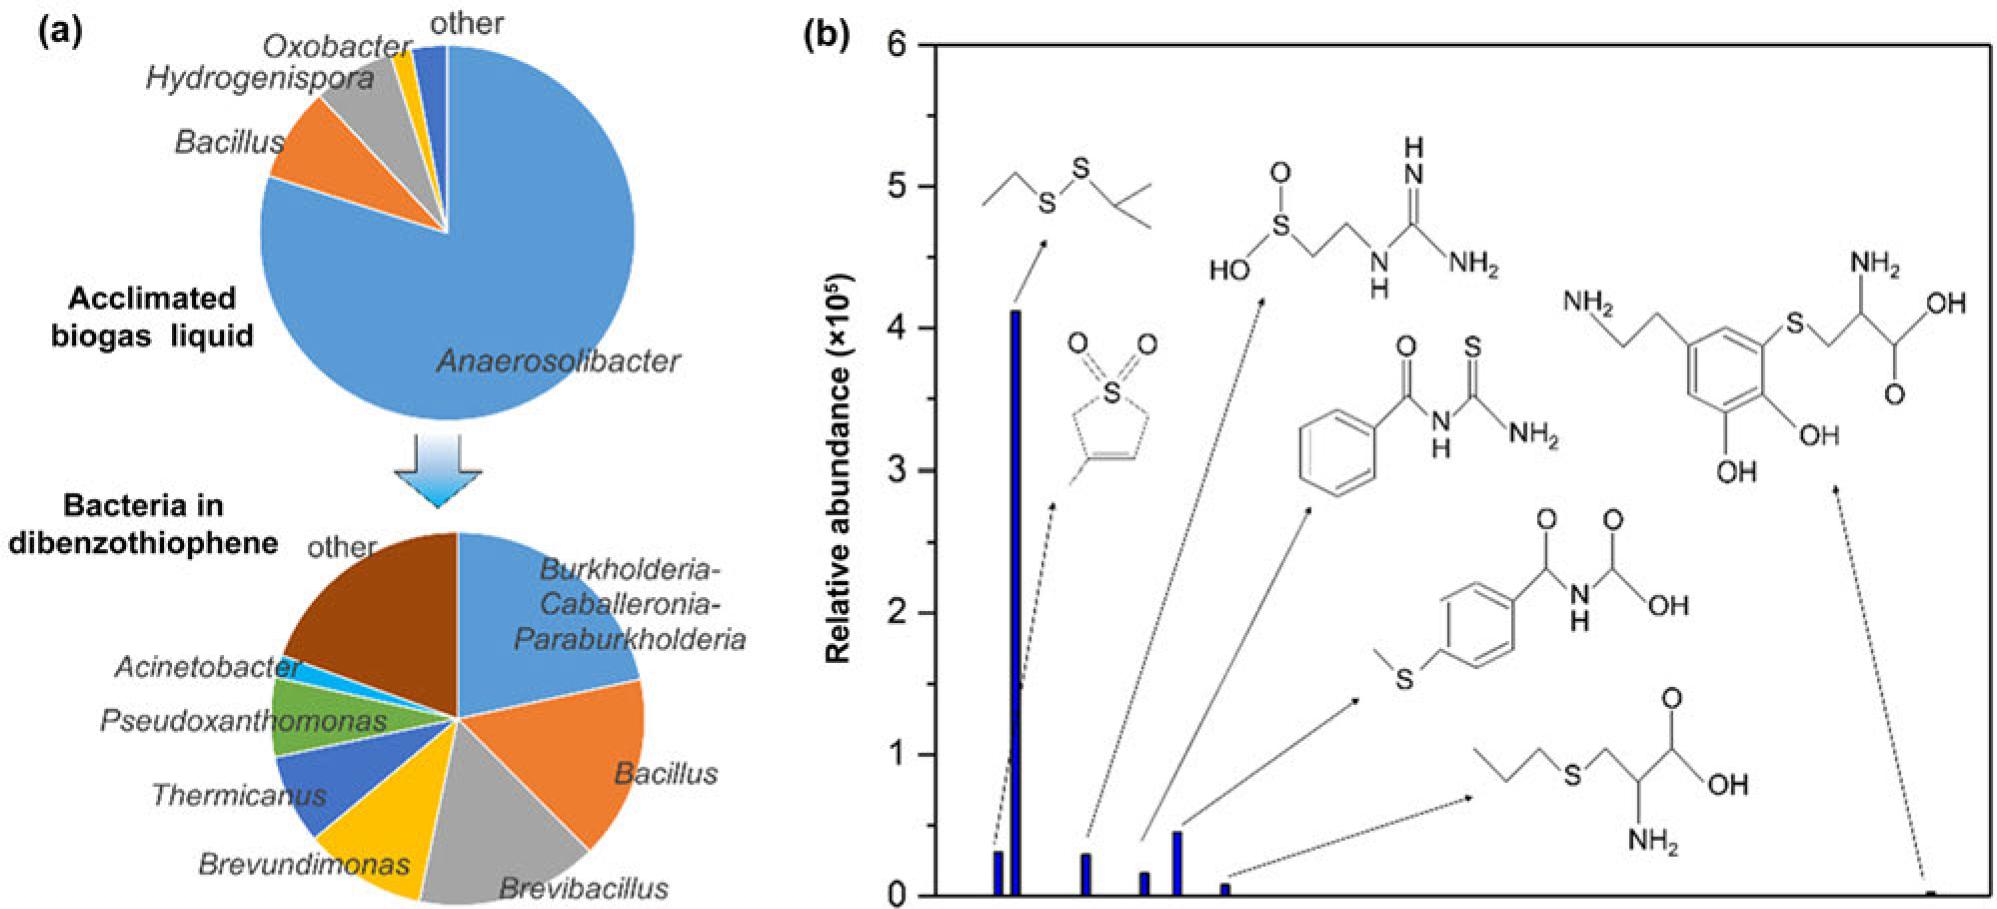
Fig. 7.
The relative abundance of dominant phyla (> 1%) in the samples, different lowercase letters indicate a significant difference (ANOVA with Tukey’s post hoc test, p < 0_05) among samples_
| Acclimated biogas liquid | CK_30d | CK_90d | Treat_30d | Treat_90d | |
|---|---|---|---|---|---|
| Firmicutes | 99.23 ± 0.18% a | 32.75 ± 19.80% b | 25.11 ± 3.87% b | 98.32 ± 0.31% a | 90.65 ± 5.36% a |
| Proteobacteria | 0.61 ± 0.12% b | 63.55 ± 20.87% a | 67.22 ± 1.41% a | 1.47 ± 0.38% b | 2.32 ± 0.69% b |
| Actinobacteriota | 0.03 ± 0.02% c | 3.14 ± 0.95% b | 5.71 ± 1.51% a | 0.03 ± 0.02% c | 0.12 ± 0.06% c |
| Chloroflexi | 0.00 ± 0.00% b | 0.09 ± 0.03% ab | 0.92 ± 0.85% ab | 0.09 ± 0.10% ab | 6.81 ± 5.56% a |
| Bacteroidota | 0.07 ± 0.03% a | 0.37 ± 0.36% a | 0.42 ± 0.27% a | 0.04 ± 0.02% a | 0.03 ± 0.01% a |