
Fig. 1.
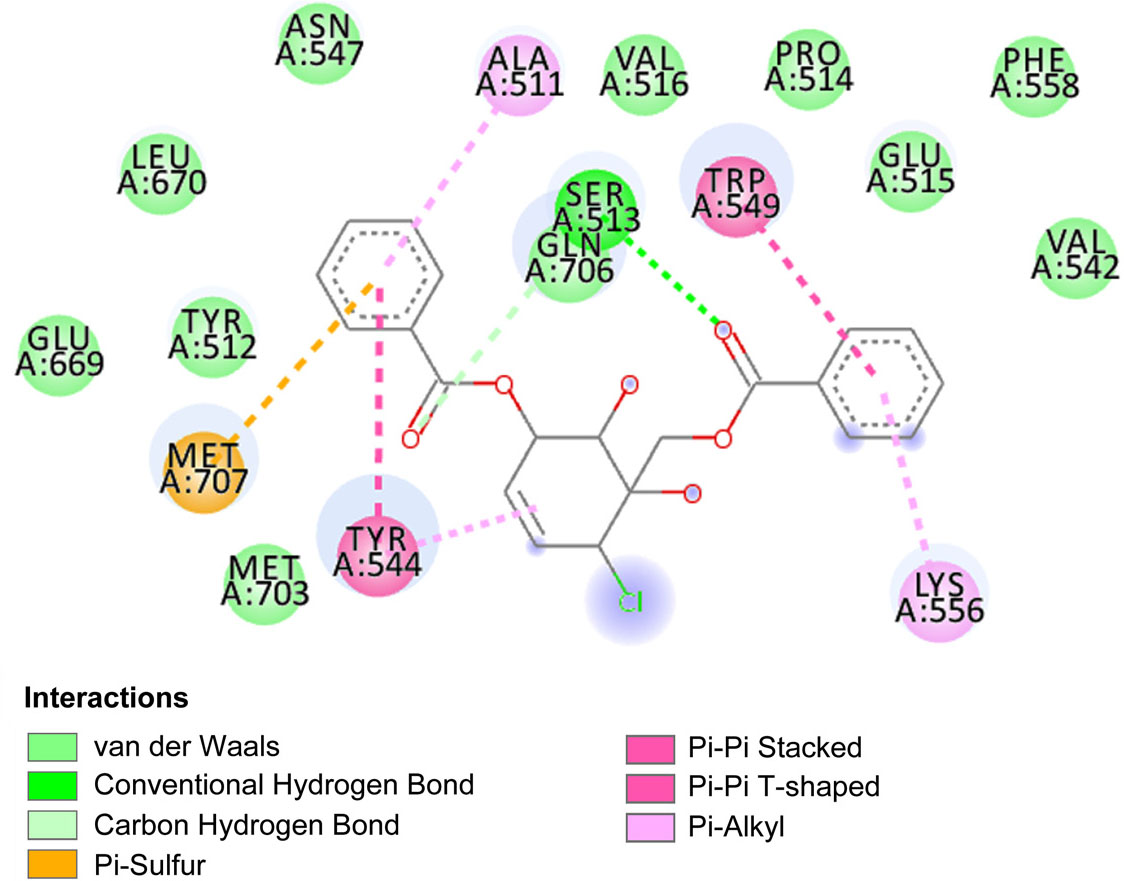
2D interaction diagram of pipoxide chlorohydrin-nsP2pro complex.
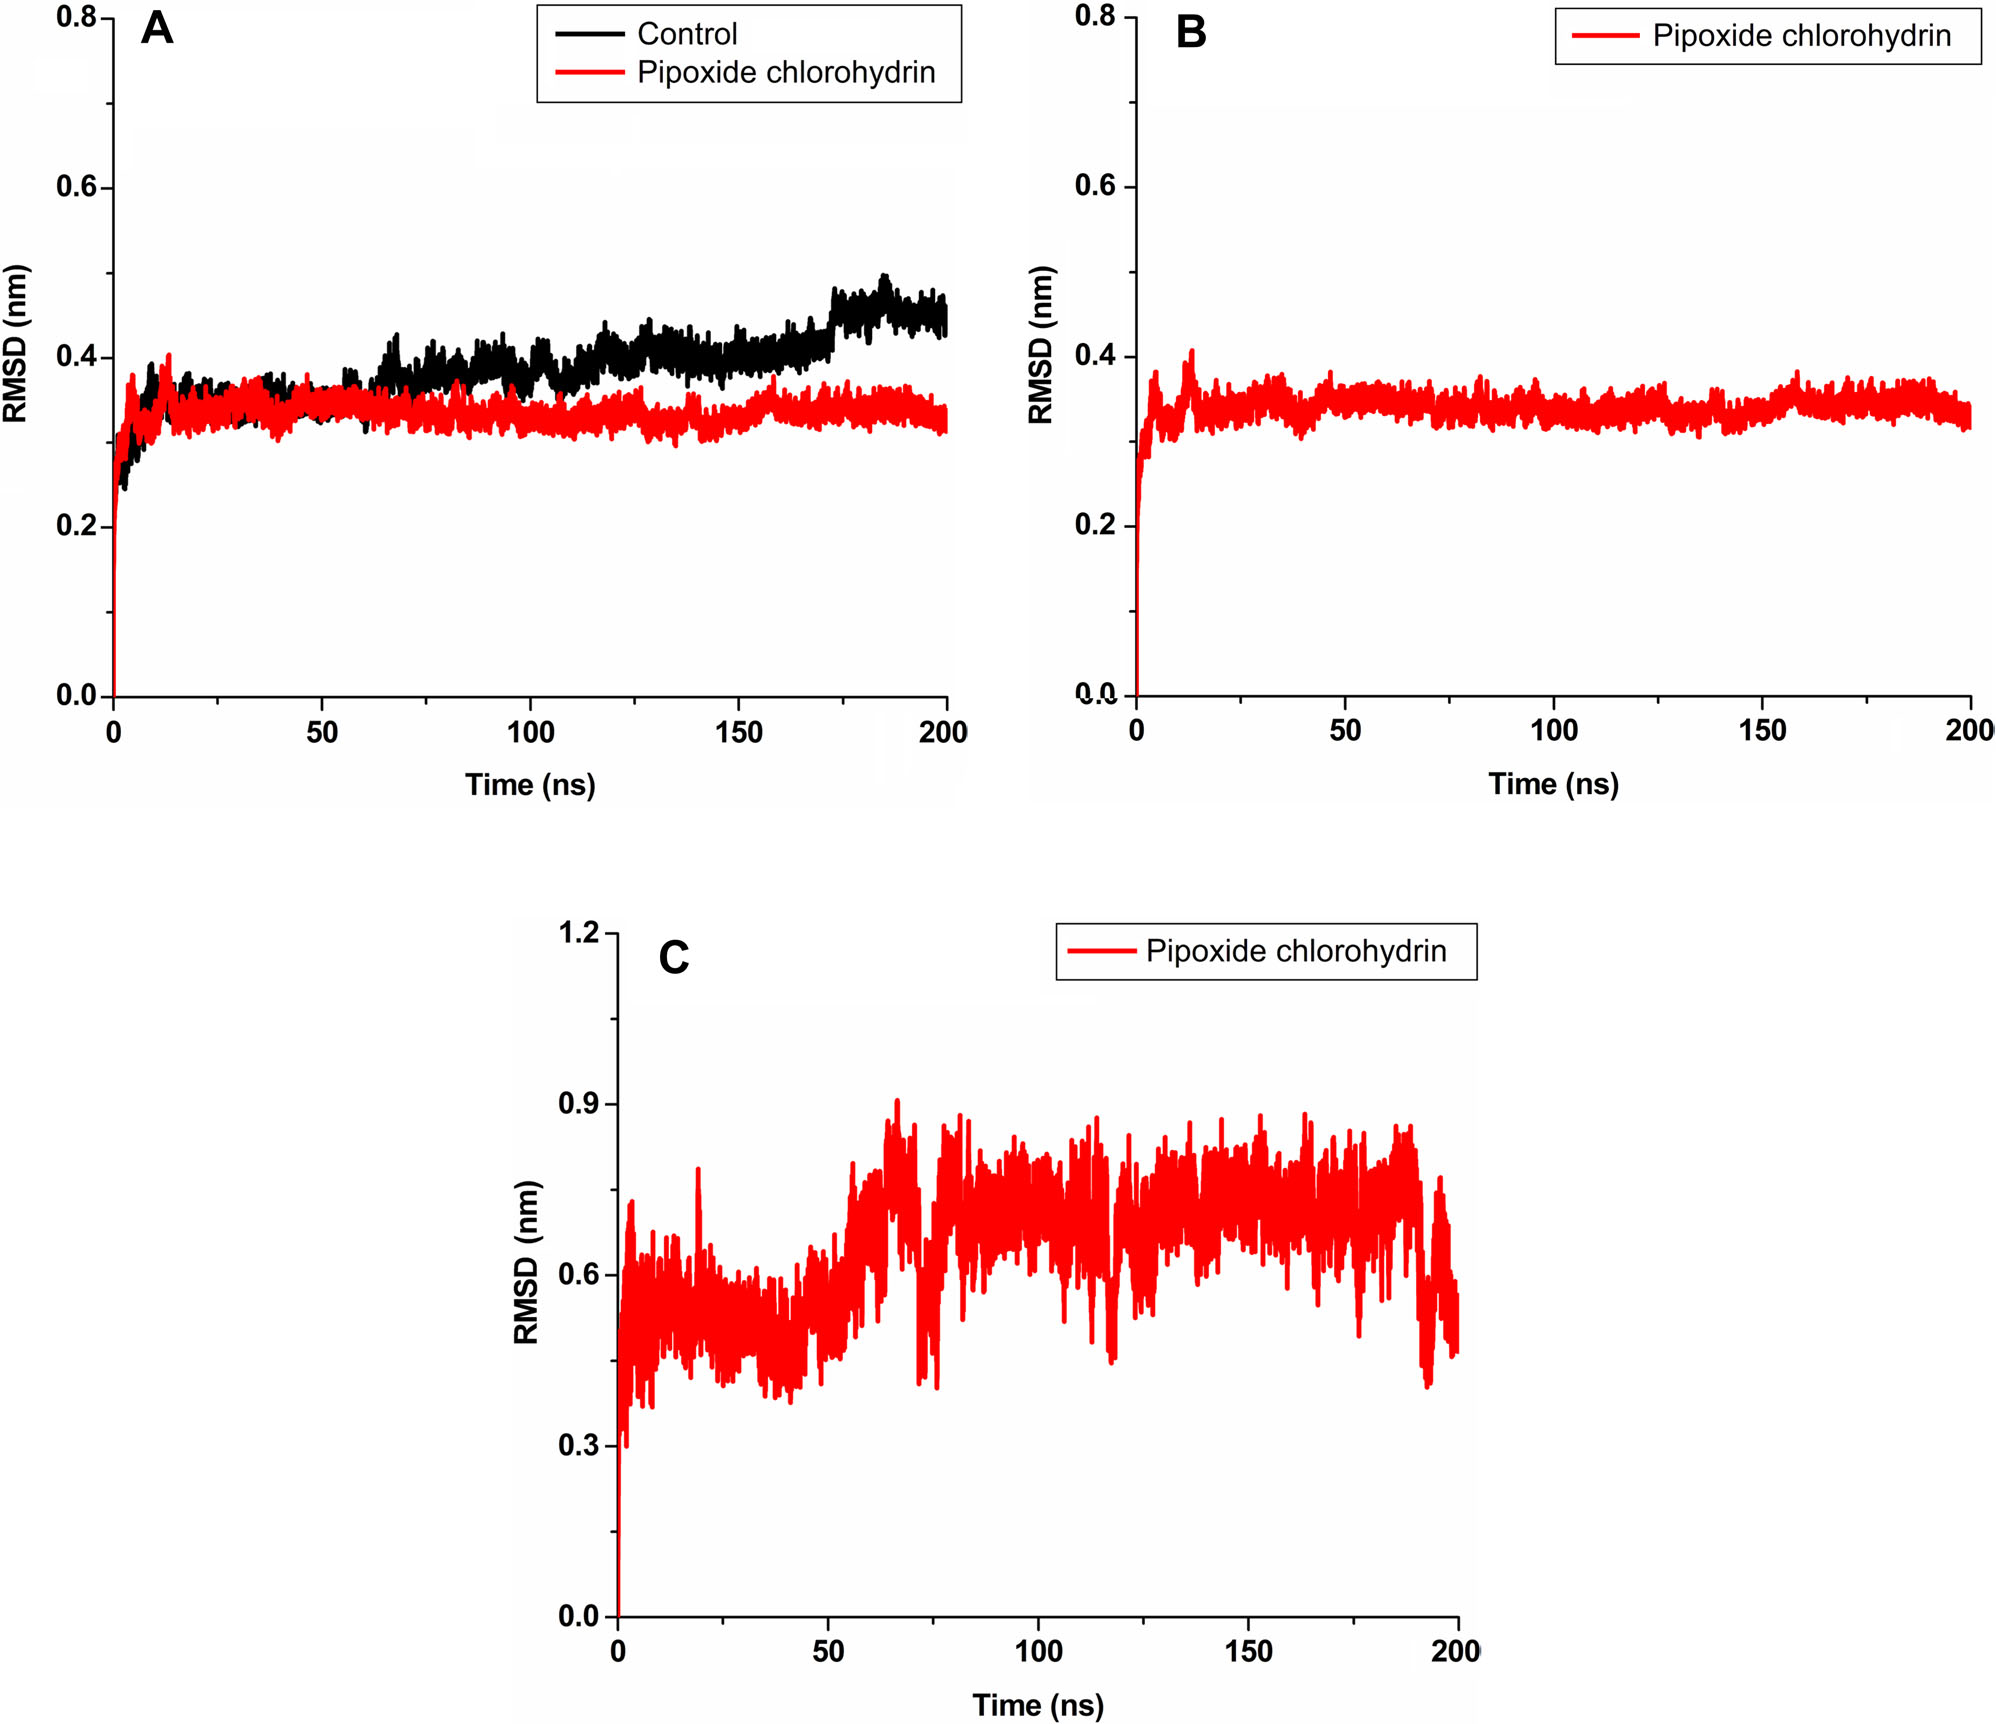
Fig. 2.
The root mean square deviation (RMSD) profile A) ns2Pro backbone, B) pipoxide chlorohydrin-nsP2pro complex, C) pipoxide chlorohydrin during the simulation length.
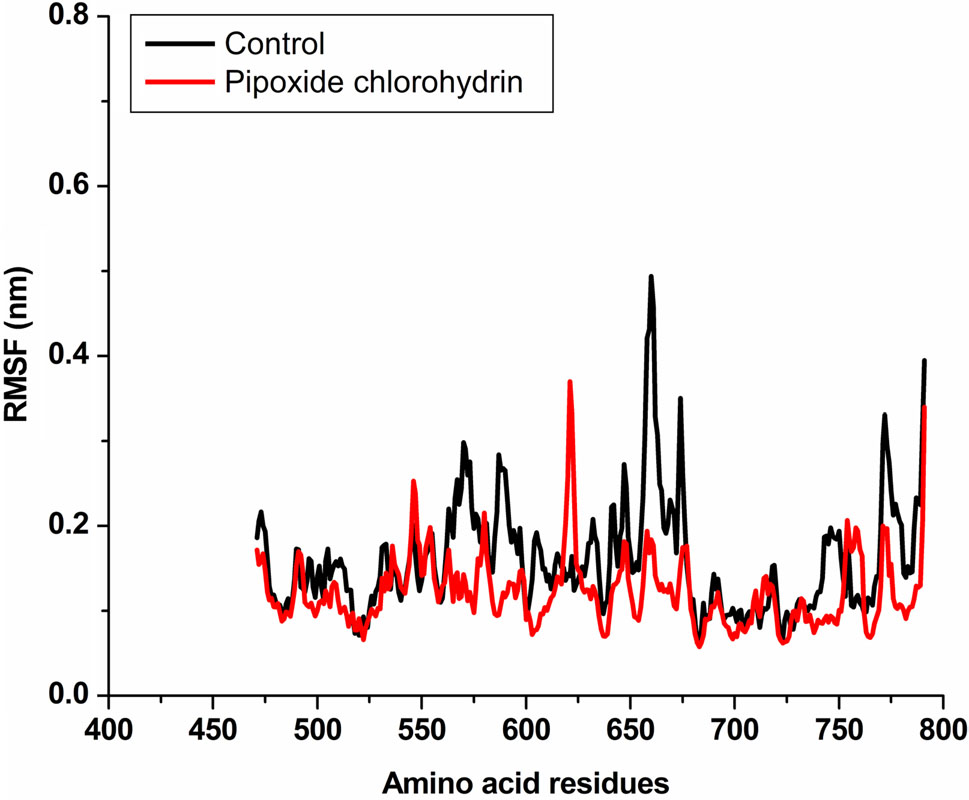
Fig. 3.
Comparison of the root mean square fluctuation (RMSF) profiles of control and pipoxide chlorohydrin-nsP2pro complex.
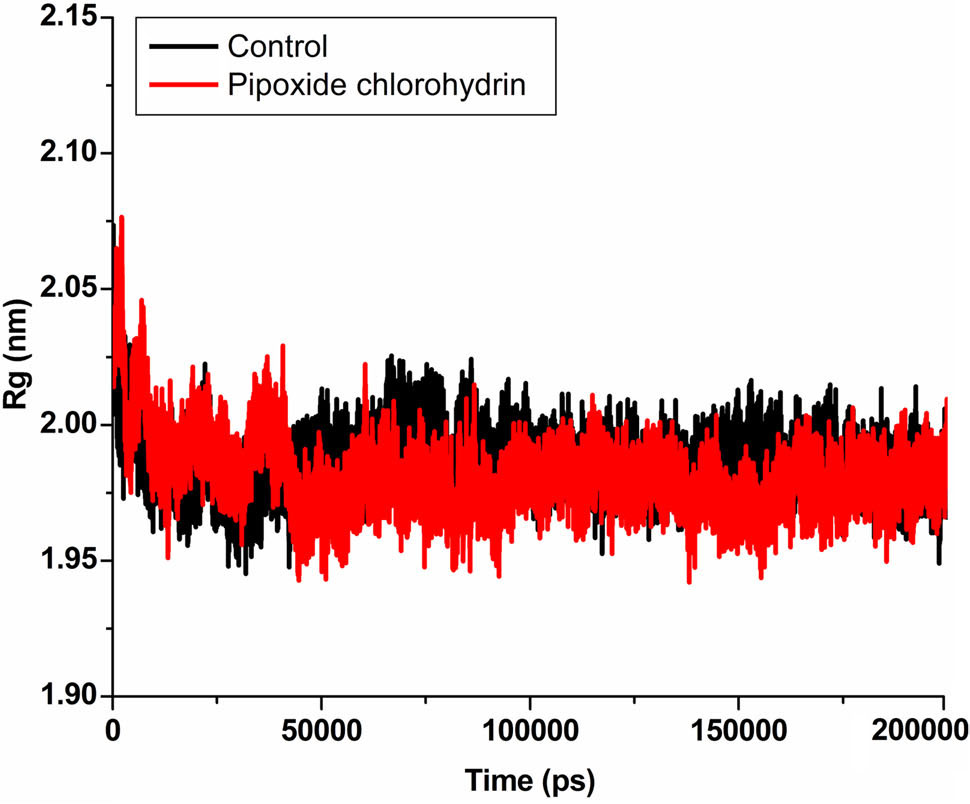
Fig. 4.
Radius of gyration comparison between control and pipoxide chlorohydrin-nsP2pro complex.
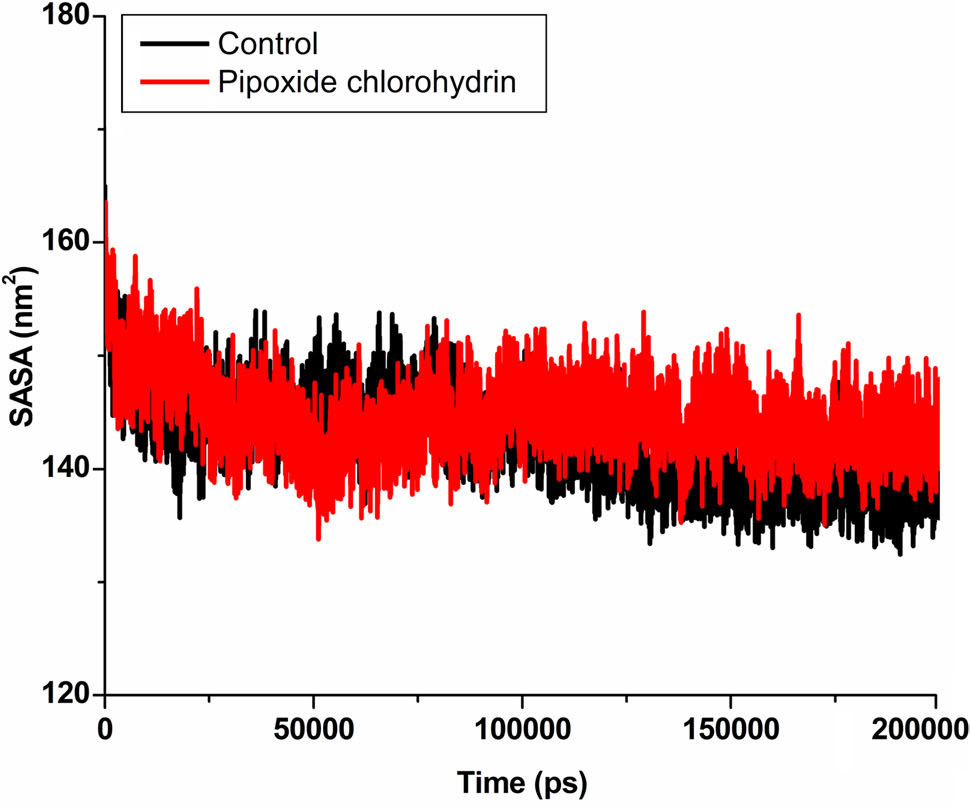
Fig. 5.
Solvent accessible surface area profile of control and pipoxide chlorohydrin-nsP2pro complex.
Table I
Average MD simulation parameters.
| Parameter | Control | Pipoxide chlorohydrin |
|---|---|---|
| Backbone RMSD | 0.38566 ± 0.04087 | 0.33465 ± 0.01483 |
| Ligand RMSD | 0.6465 ± 0.10423 | |
| Complex RMSD | 0.33977 ± 0.01469 | |
| RMSF | 0.15901 ± 0.06542 | 0.122 ± 0.04224 |
| Radius of gyration | 1.98671 ± 0.01127 | 1.98117 ± 0.01406 |
| SASA | 142.80578 ± 3.86427 | 144.61529 ± 3.2153 |
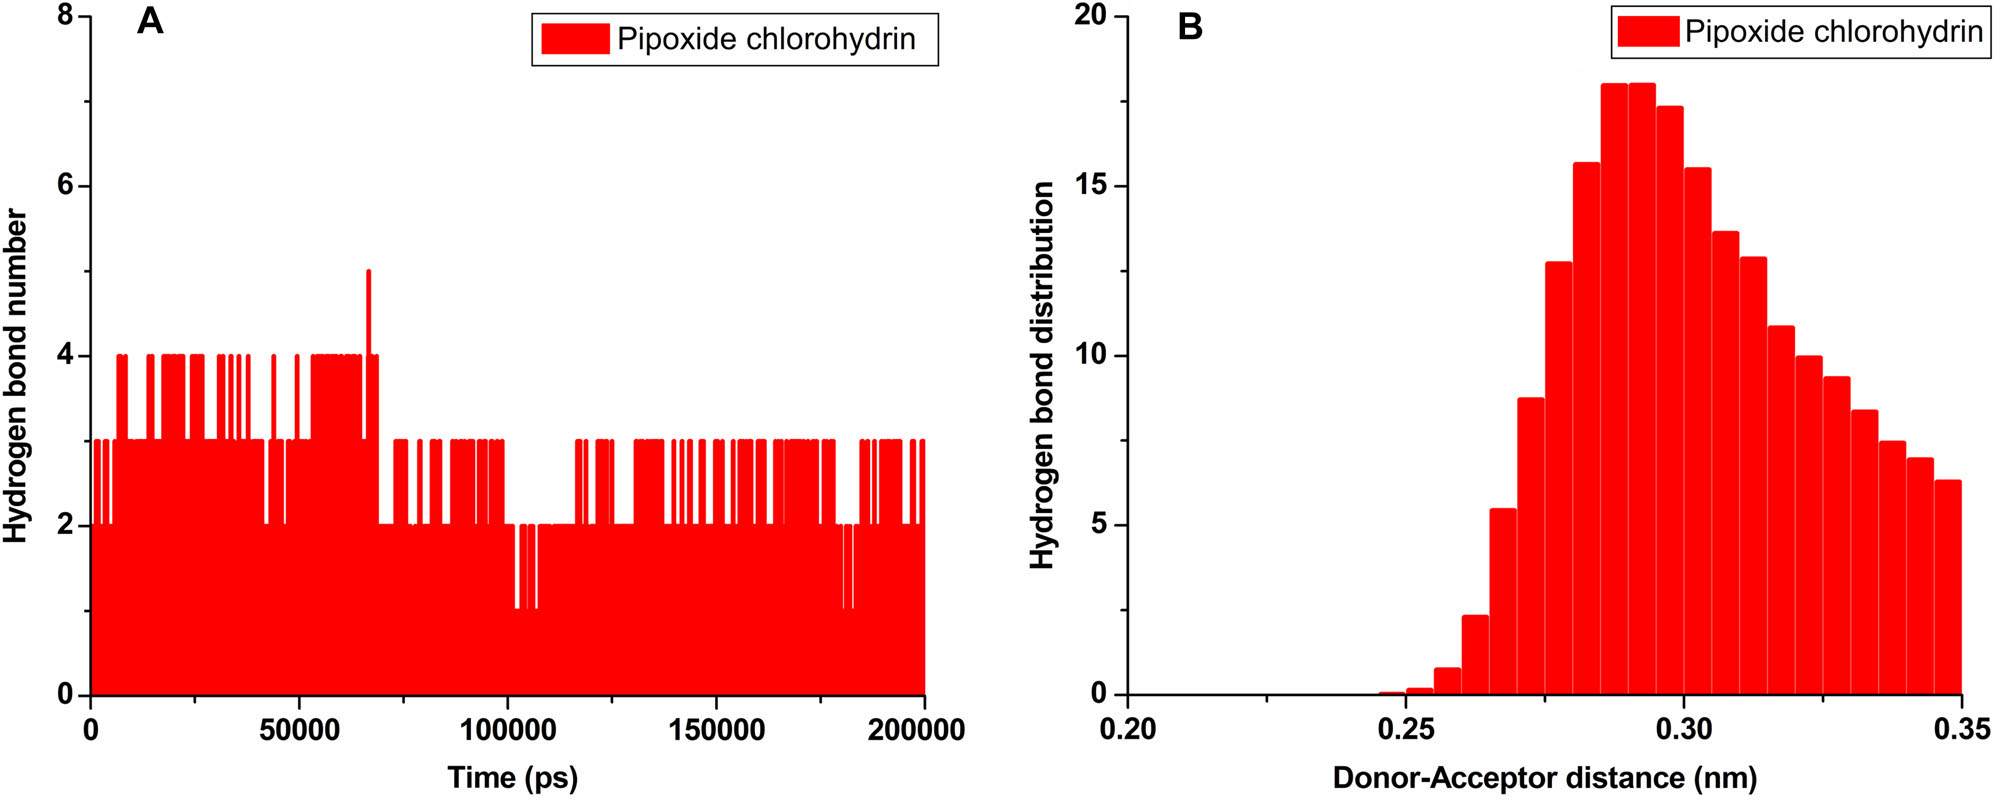
Fig. 6.
Number and distribution of hydrogen bonds between pipoxide chlorohydrin and nsPro2pro; A) hydrogen bond number, B) hydrogen bond distribution.