
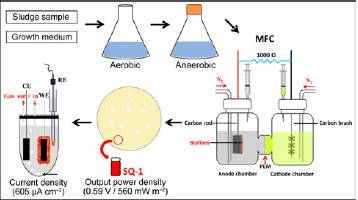
Fig. 1.
Enrichment, isolation, and identification of the strain SQ-1
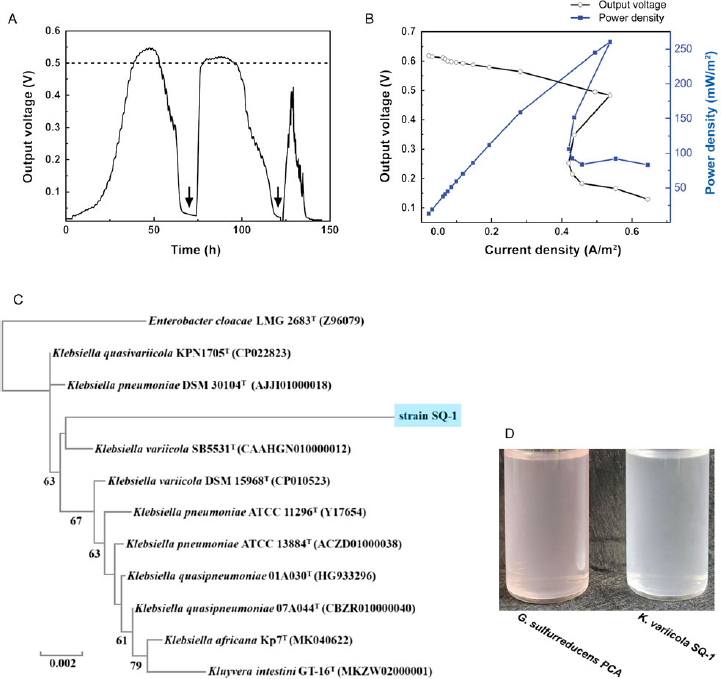
A) The output voltage performance of mixed microflora in a dual-chamber MFC using sodium acetate as a carbon source. Arrows show the supply of sodium acetate. B) The output voltage (circle) and power density (square) curves for mixed microflora. C) Phylogenetic analysis of the strain SQ-1 based on 16S rDNA gene sequences. D) The appearance of the strain SQ-1 and Geobacter sulfurreducens PCA in liquid growth medium after 3 days of growth.
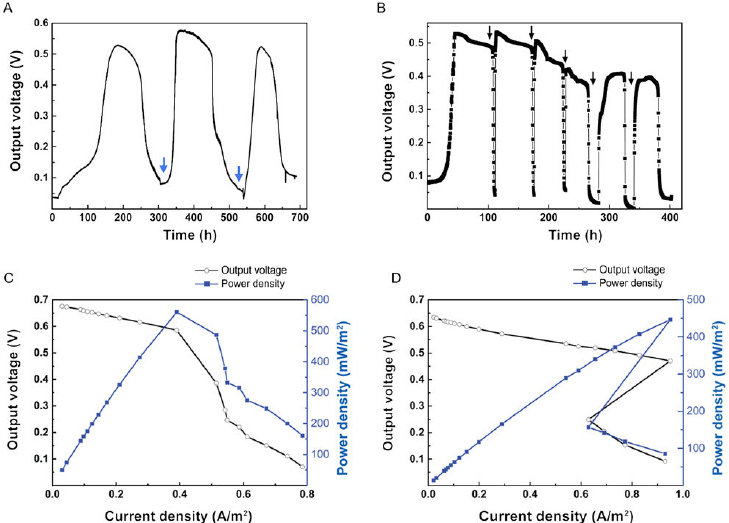
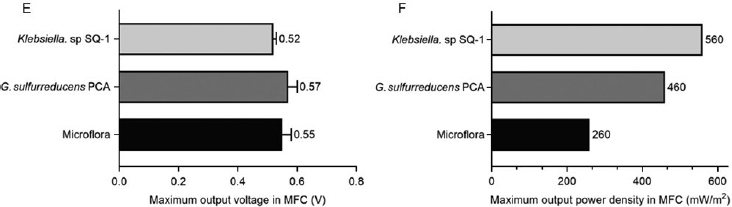
Fig. 2.
Output voltage and power density of Klebsiella sp. SQ-1 in MFC
A) The output voltage performance of the strain SQ-1 in a dual-chamber MFC using sodium acetate as a carbon source. Arrows show the supply of sodium acetate. B) The output voltage performance of a model electricigen Geobacter sulfurreducens PCA in a dual-chamber MFC using sodium acetate as a carbon source. Arrows show the supply of sodium acetate. C) The output voltage (circle) and power density (square) curve for the strain SQ-1. D) The output voltage (circle) and power density (square) curves for G. sulfurreducens PCA. E) Comparison of the maximum output voltage of mixed microflora, G. sulfurreducens PCA, and Klebsiella sp. SQ-1 in MFC. F) Comparison of maximum output power density of mixed microflora, G. sulfurreducens PCA, and Klebsiella sp. SQ-1 in MFC.
Table I
Electrical generation performance of reported electricigens.
| Strains | Substrates | Voltage (V) | Power density (mW m–A) | Current density (μA cm–2) | References |
|---|---|---|---|---|---|
| Klebsiella sp. SQ-1 | sodium acetate | 0.59 | 560 | 625 | this work |
| Geobacter sulfurreducens PCA | sodium acetate | 0.47 | 460 | 605 | (Deng et al. 2015) |
| Pseudomonas aeruginosa | glucose | / | / | 52.1 | (Yong et al. 2017) |
| Klebsiella pneumonia | glucose | 0.621 | 40.26 | / | (Guo et al. 2020) |
| Shewanella oneidensis | lactate | / | 41 | / | (Watson and Logan 2010) |
| Citrobacter freundii | citrate | / | 204.5 | / | (Huang et al. 2015) |
| Escherichia coli | glucose | / | / | 34 | (Qiao et al. 2009) |
| Rhodoferax ferrireducens | glucose | / | / | 14.6 | (Liu et al. 2007) |
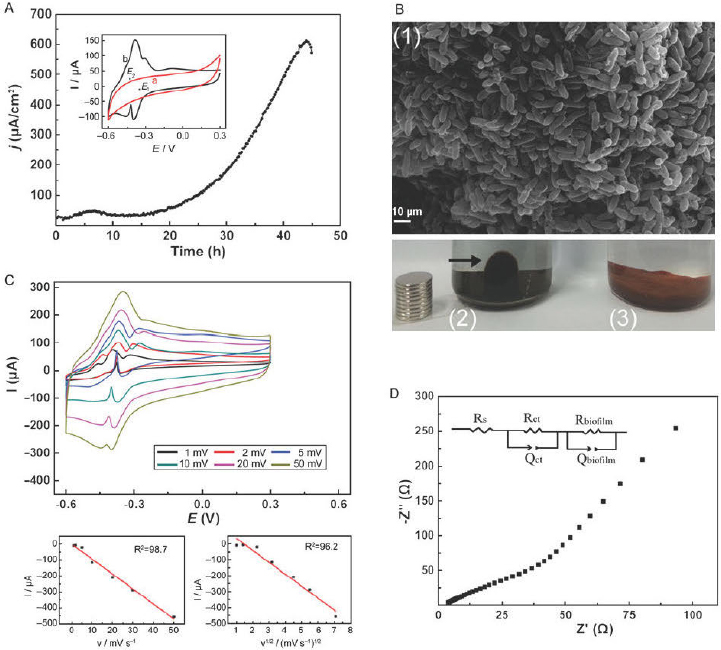
Fig. 3.
Electrochemical performance of Klebsiella sp. SQ-1 in a three-electrode system
A) Chronoamperometrlc curves for the strain SQ-1 In a three-electrode system using sodium acetate as electron acceptors. Inset, cyclic voltammograms of the enriched strain SQ-1 biofilm on electrodes in dltferent stages; a) before blofllm formation; b) after blofllm formation with a current density below 2 μA cm–2. B(1) The morphology of the strain SQ-1 blofllms under the scanning electron microscope (5,000x). Blofllms were attached to the graphite surface. B(2) The appearance of bacterial culture after 5 days of Incubation when the growth medium Is supplemented with lron(III) oxide. A magnet Is placed outside the tube. The arrow shows that the magnet attracts the black suspension. B(3) The Initial appearance of bacterial culture. C) Voltammograms of the strain SQ-1 blofllm. Scan rates: 1, 2, 5, 10, 20, 50 mV s–1. Inset, the linear dependence of the cathodic peak current density at -0.37 V versus scan rates or square roots of scan rates. D) The Nyquist plot for blofllms attached to working electrodes.
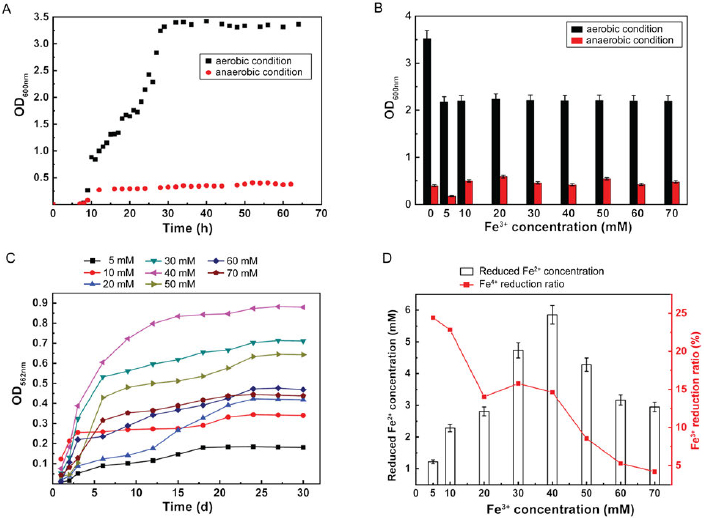
Fig. 4.
Ferric reduction of Klebsiella sp. SQ-1
A) The growth curve of strain SQ-1 measured under aerobic and anaerobic conditions. B) The growth curve of strain SQ-1 when the growth medium was supplemented with different amounts of ferric citrate. C) Measurement of reduced Fe2+. D) Analysis of Fe3+ reduction ratio. The concentration of Fe2+ was measured after 30 hours of incubation.