
Fig. 1.
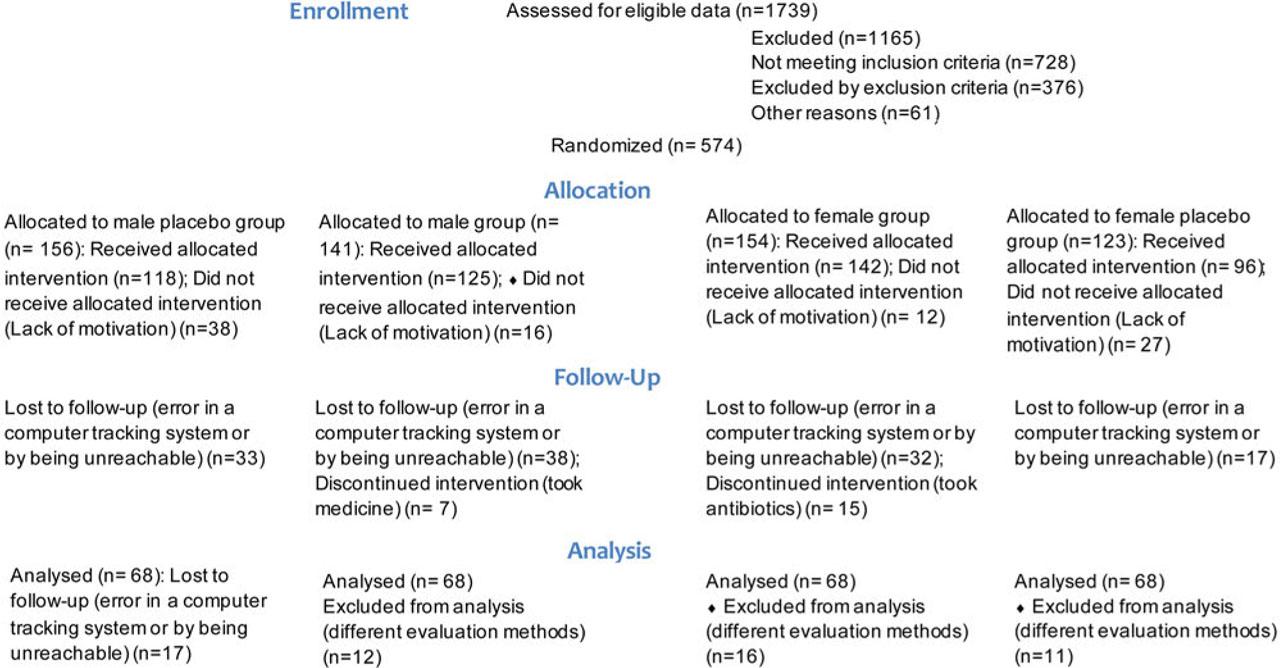
Fig. 2 A, B.
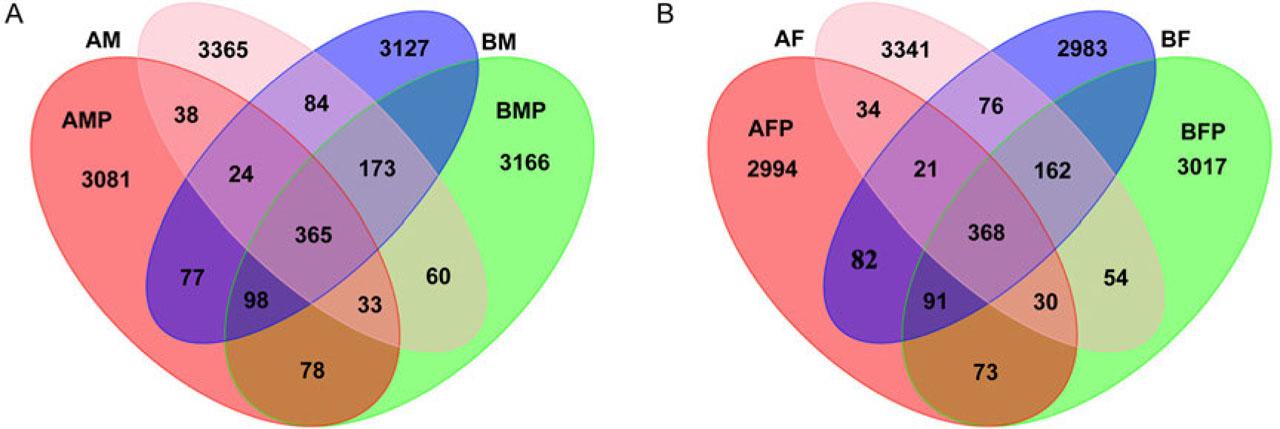
Fig. 2 C, D, E, F, G.
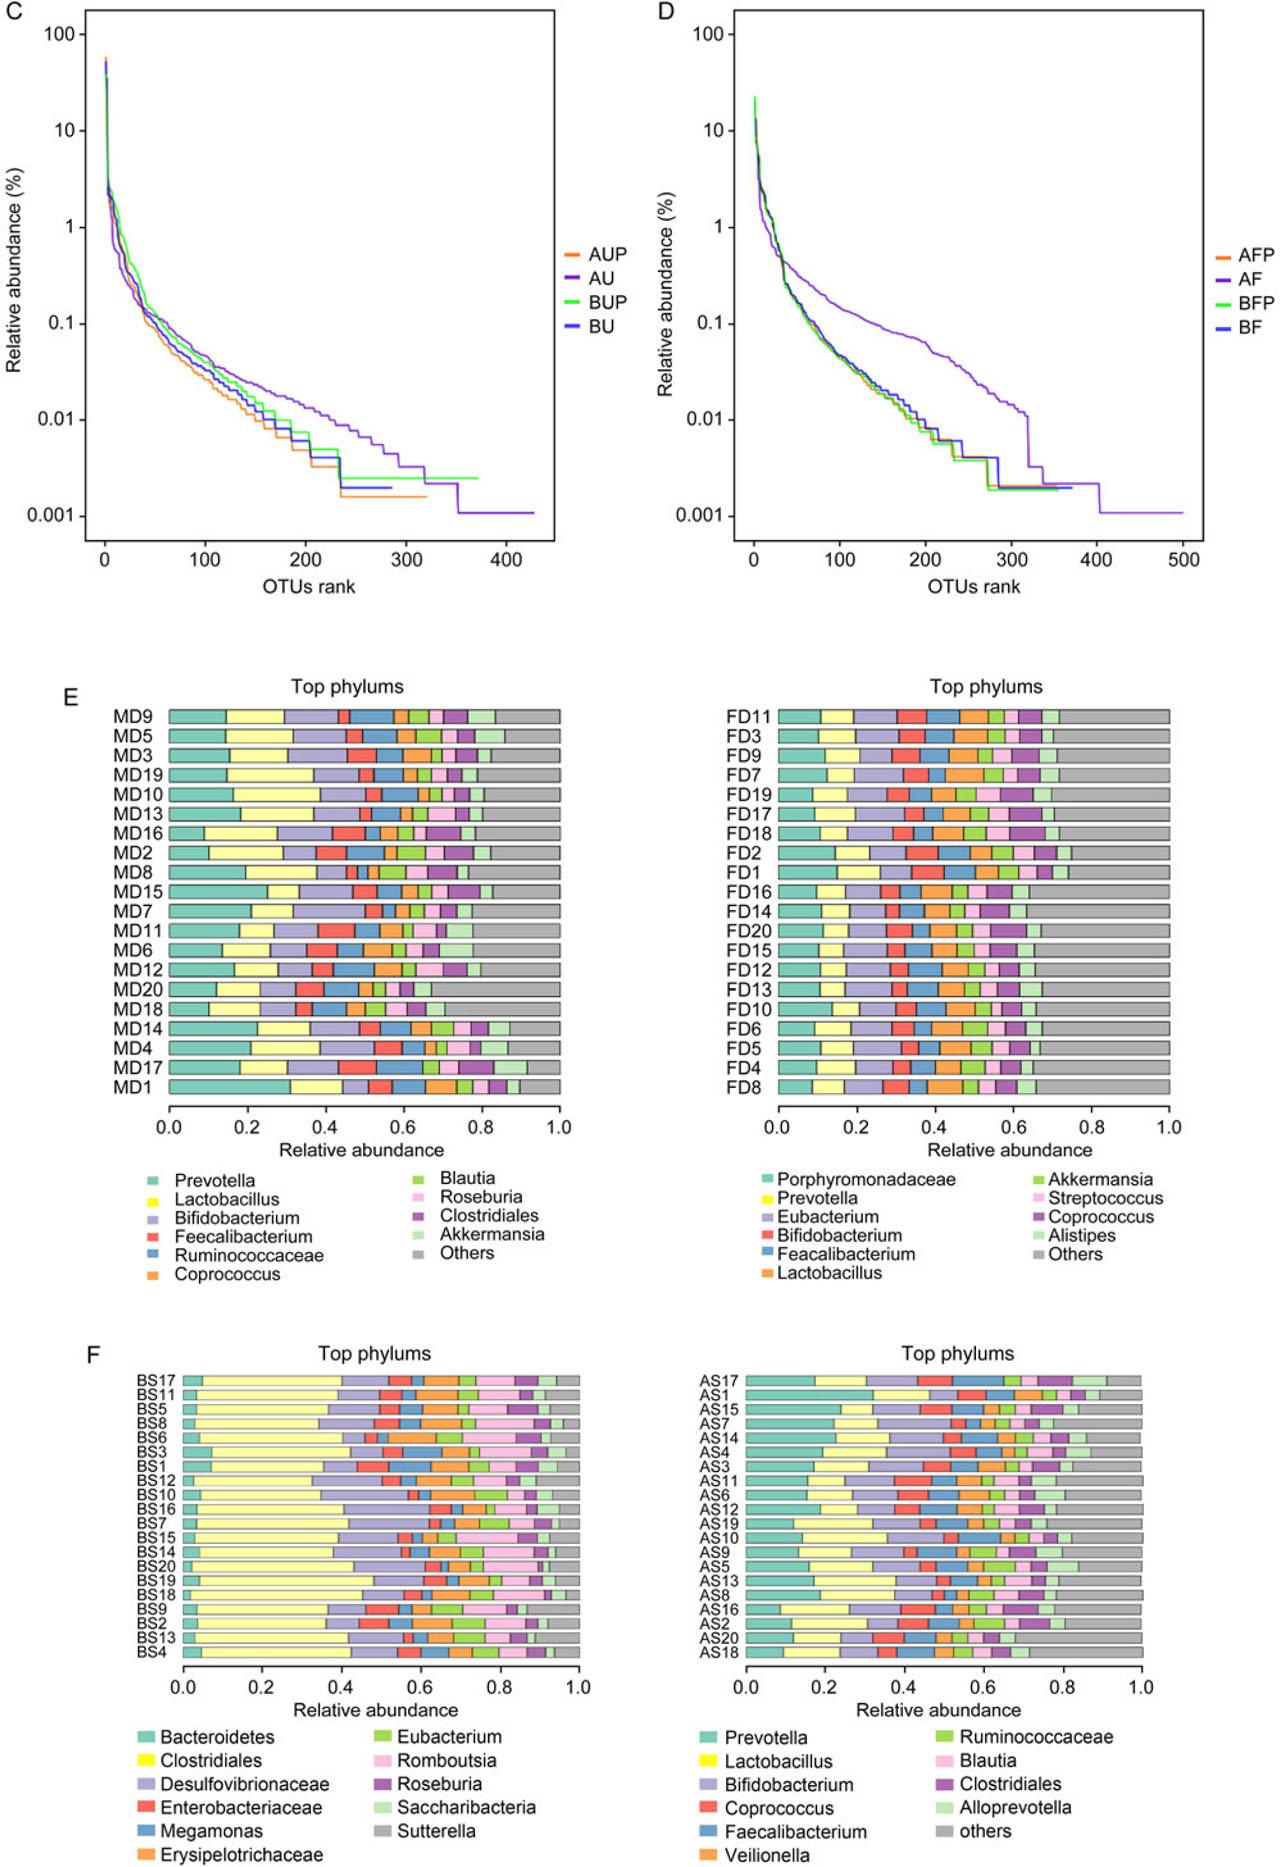
Fig. 3A, B.
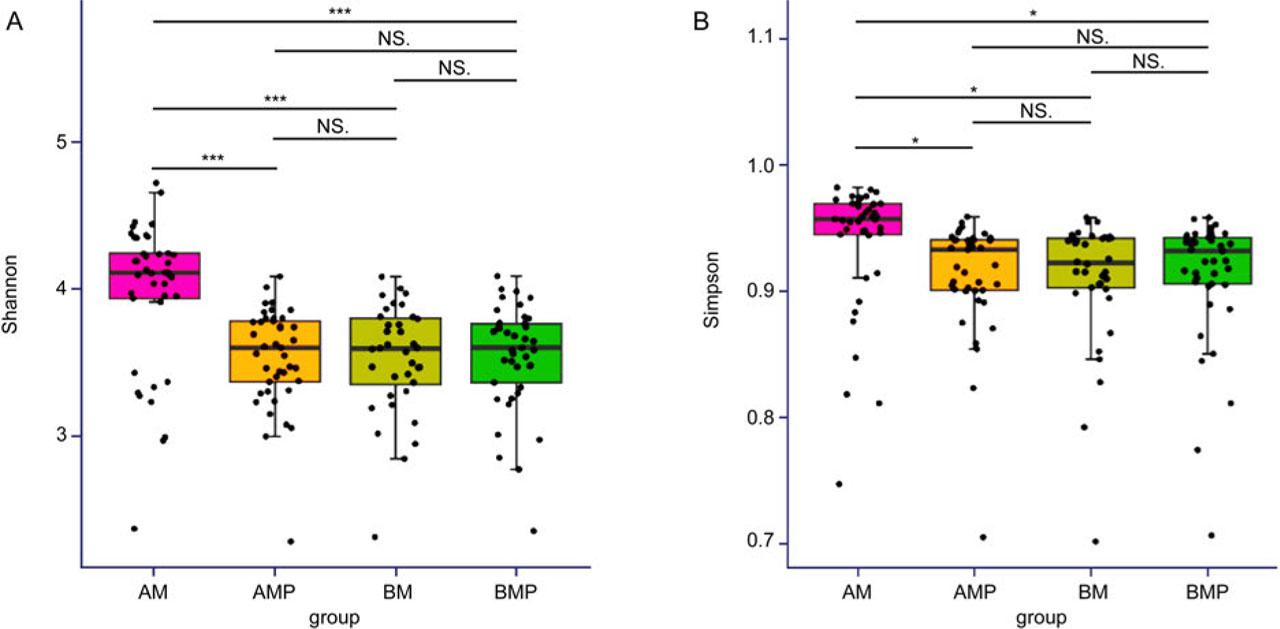
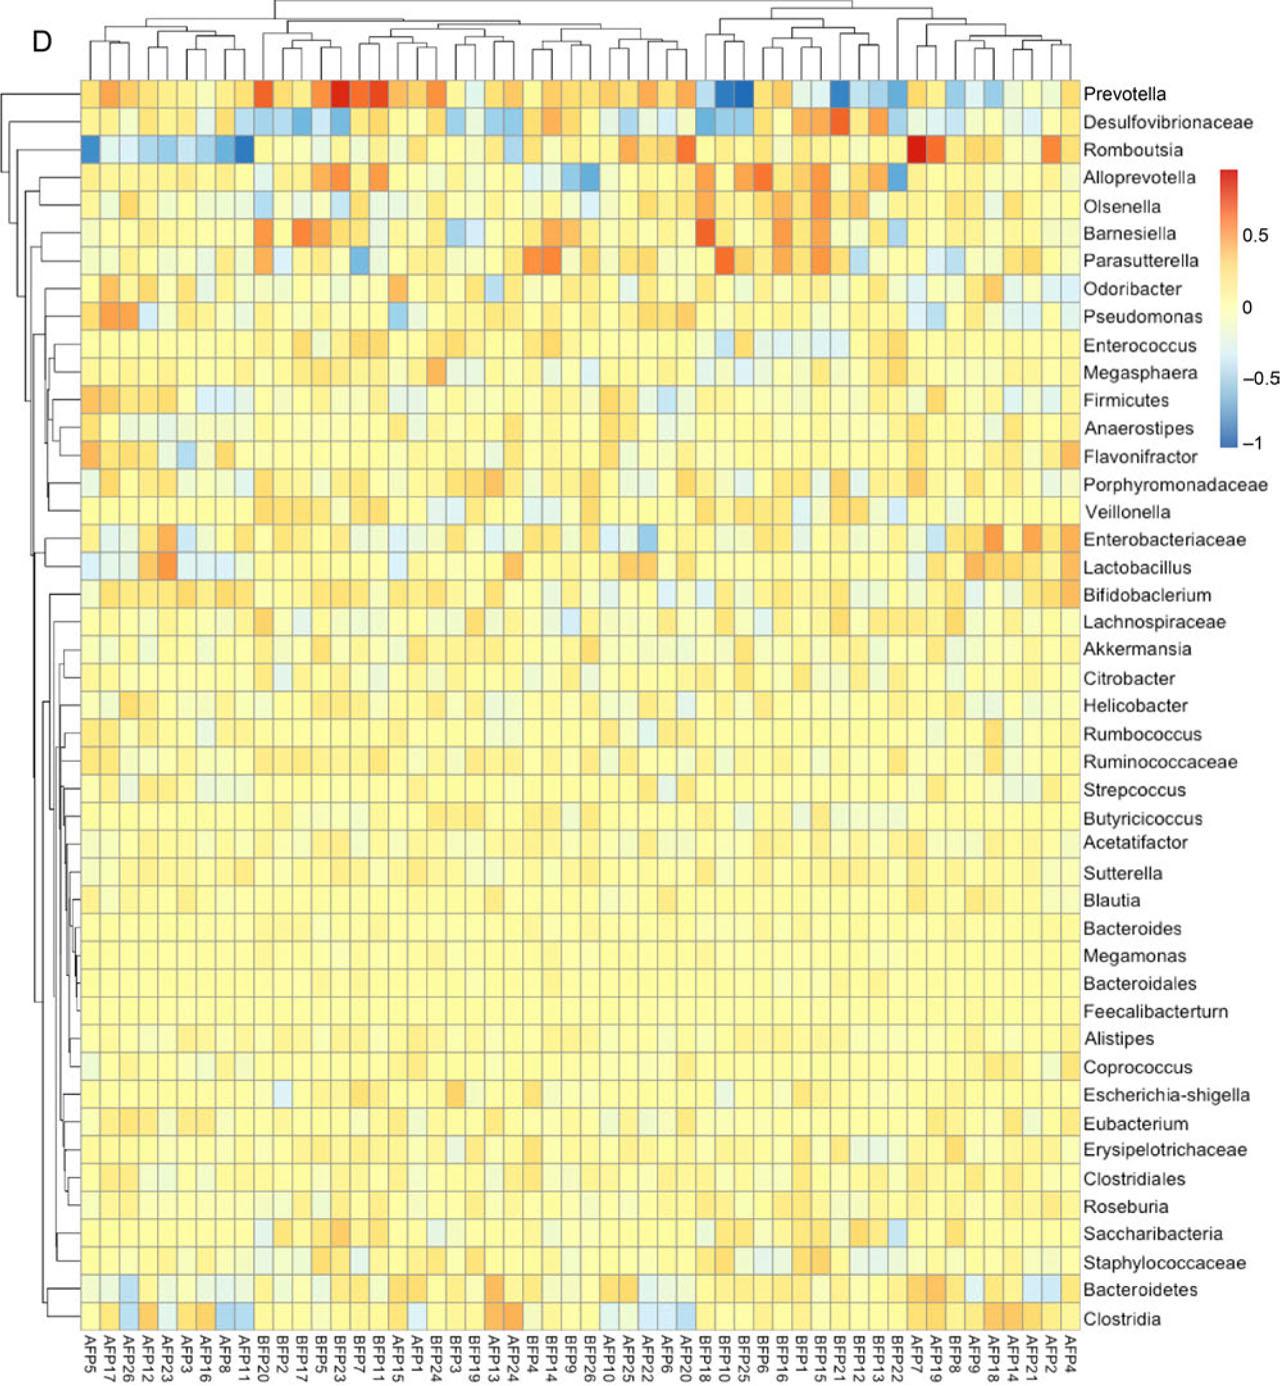
Fig. 3C, D, E, F, G, H.
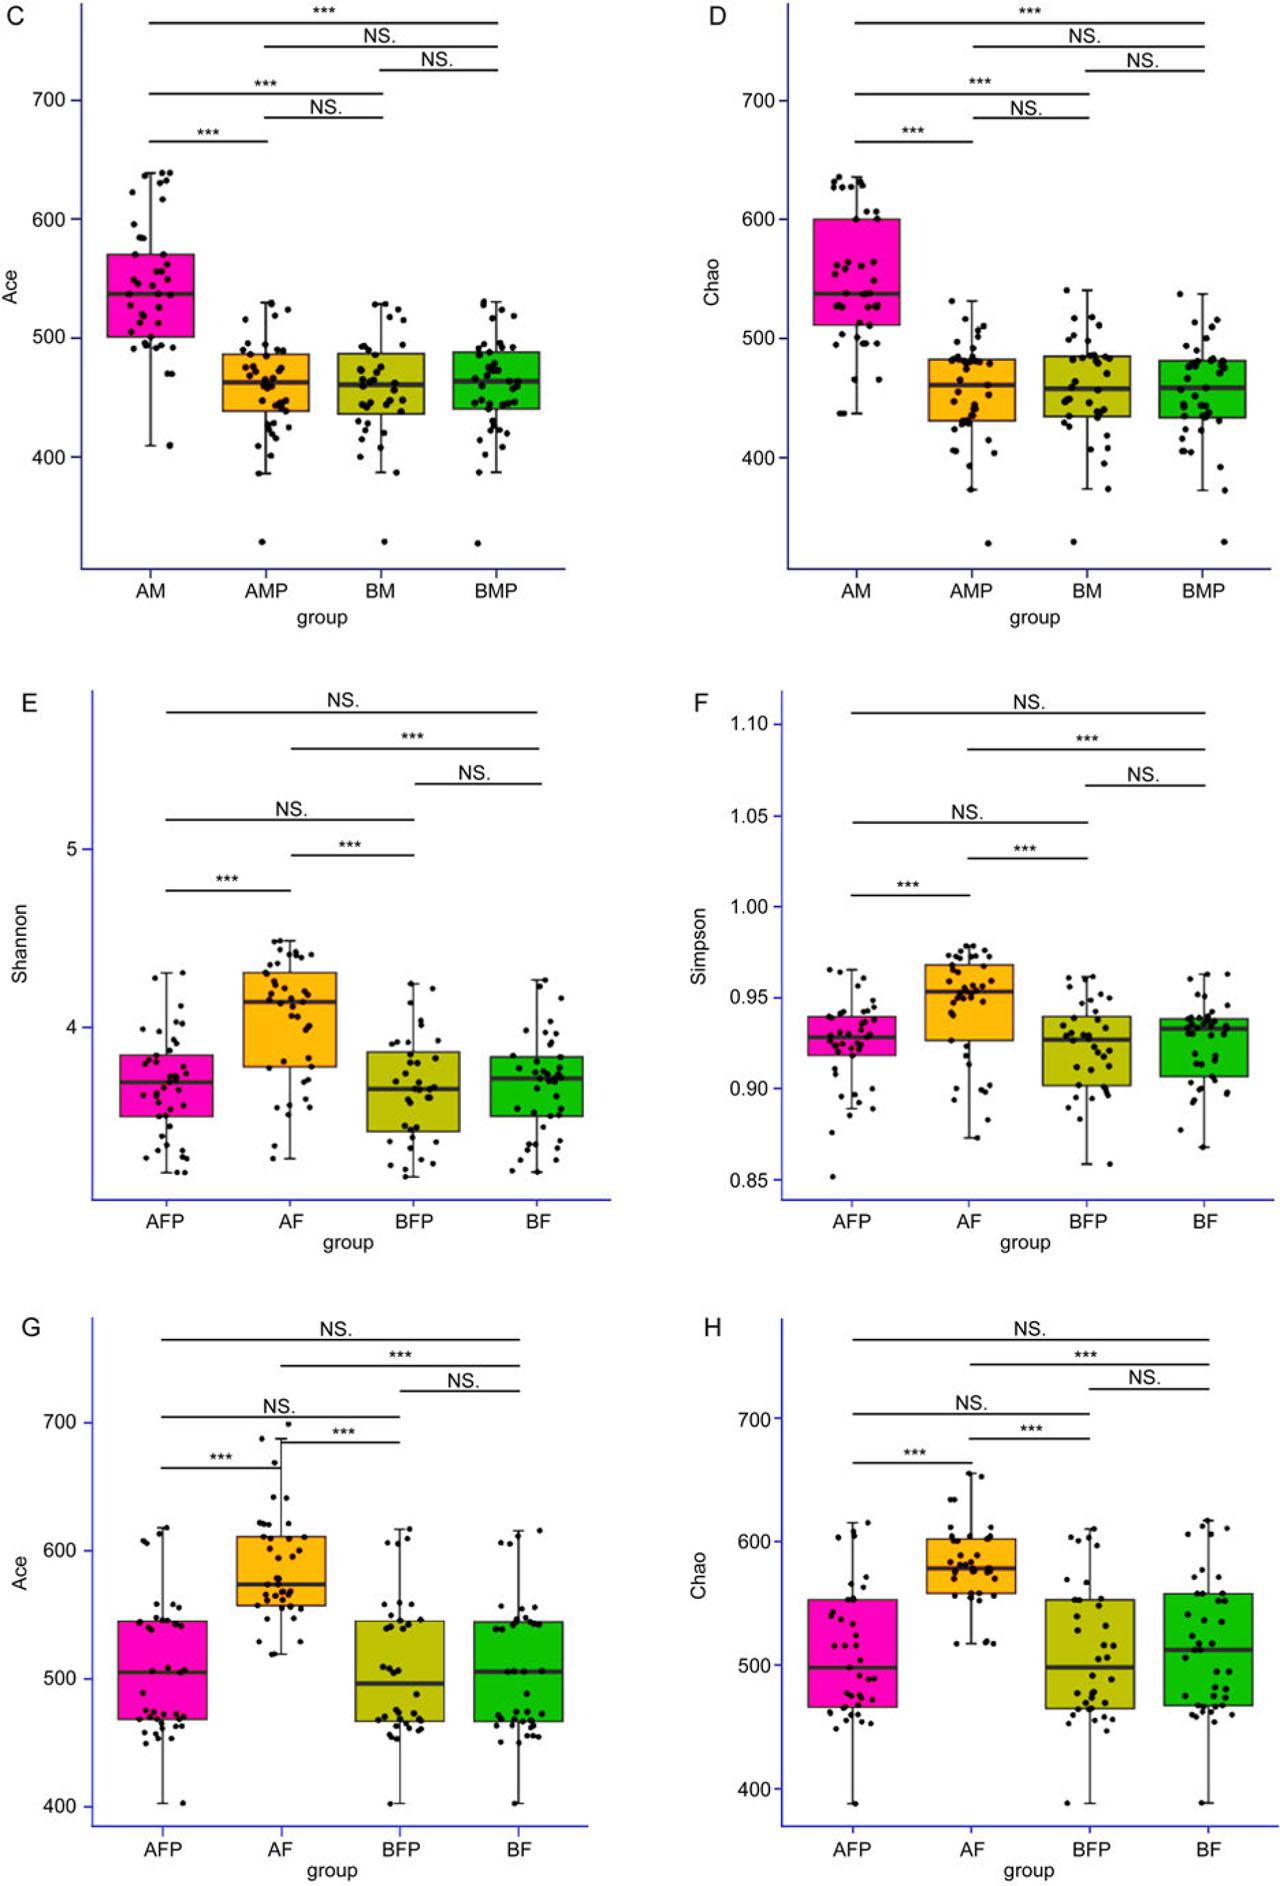
Fig. 3I, J, K, L.
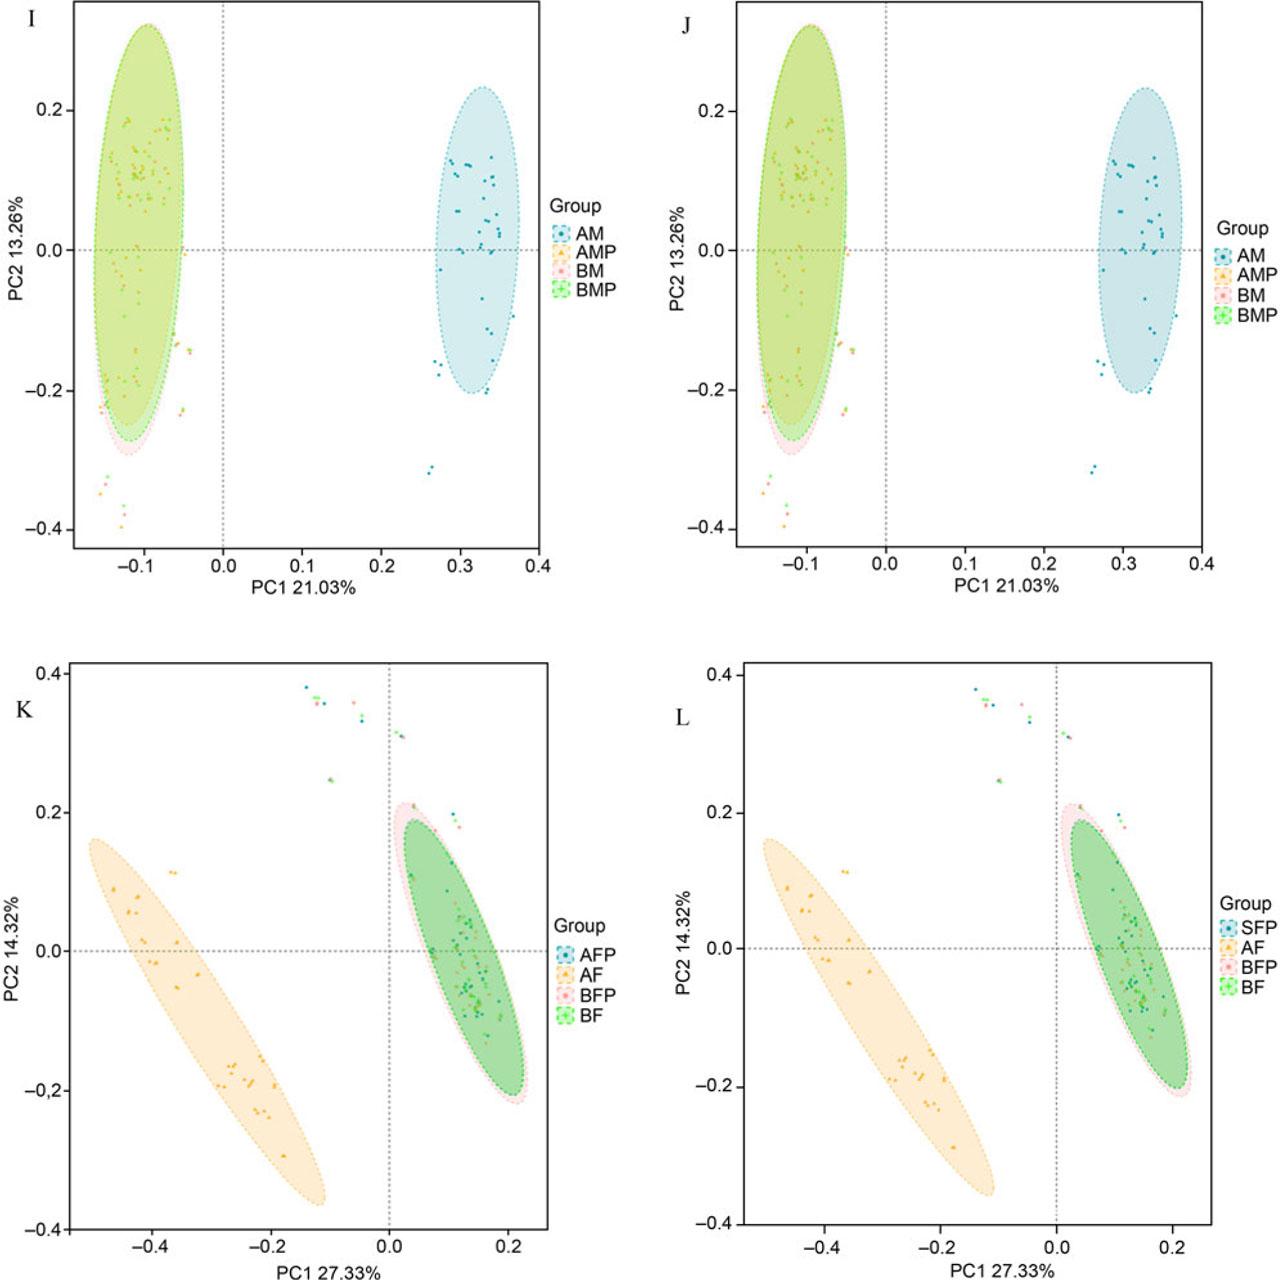
Fig. 4A.
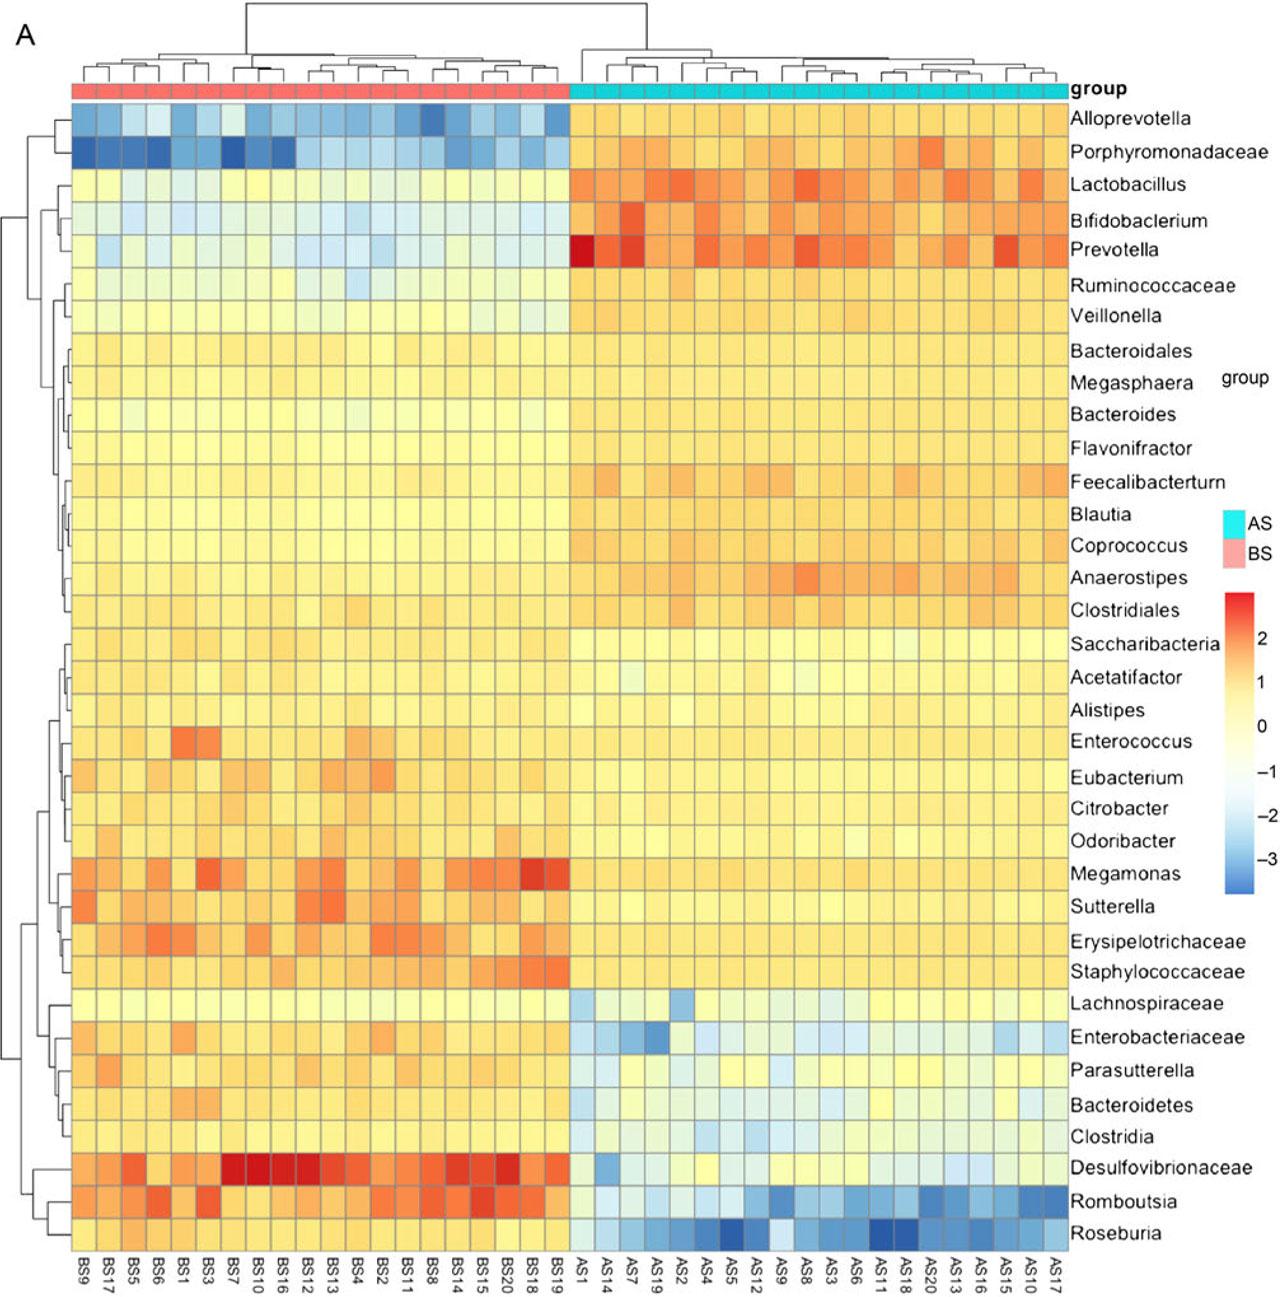
Fig. 4B, C.
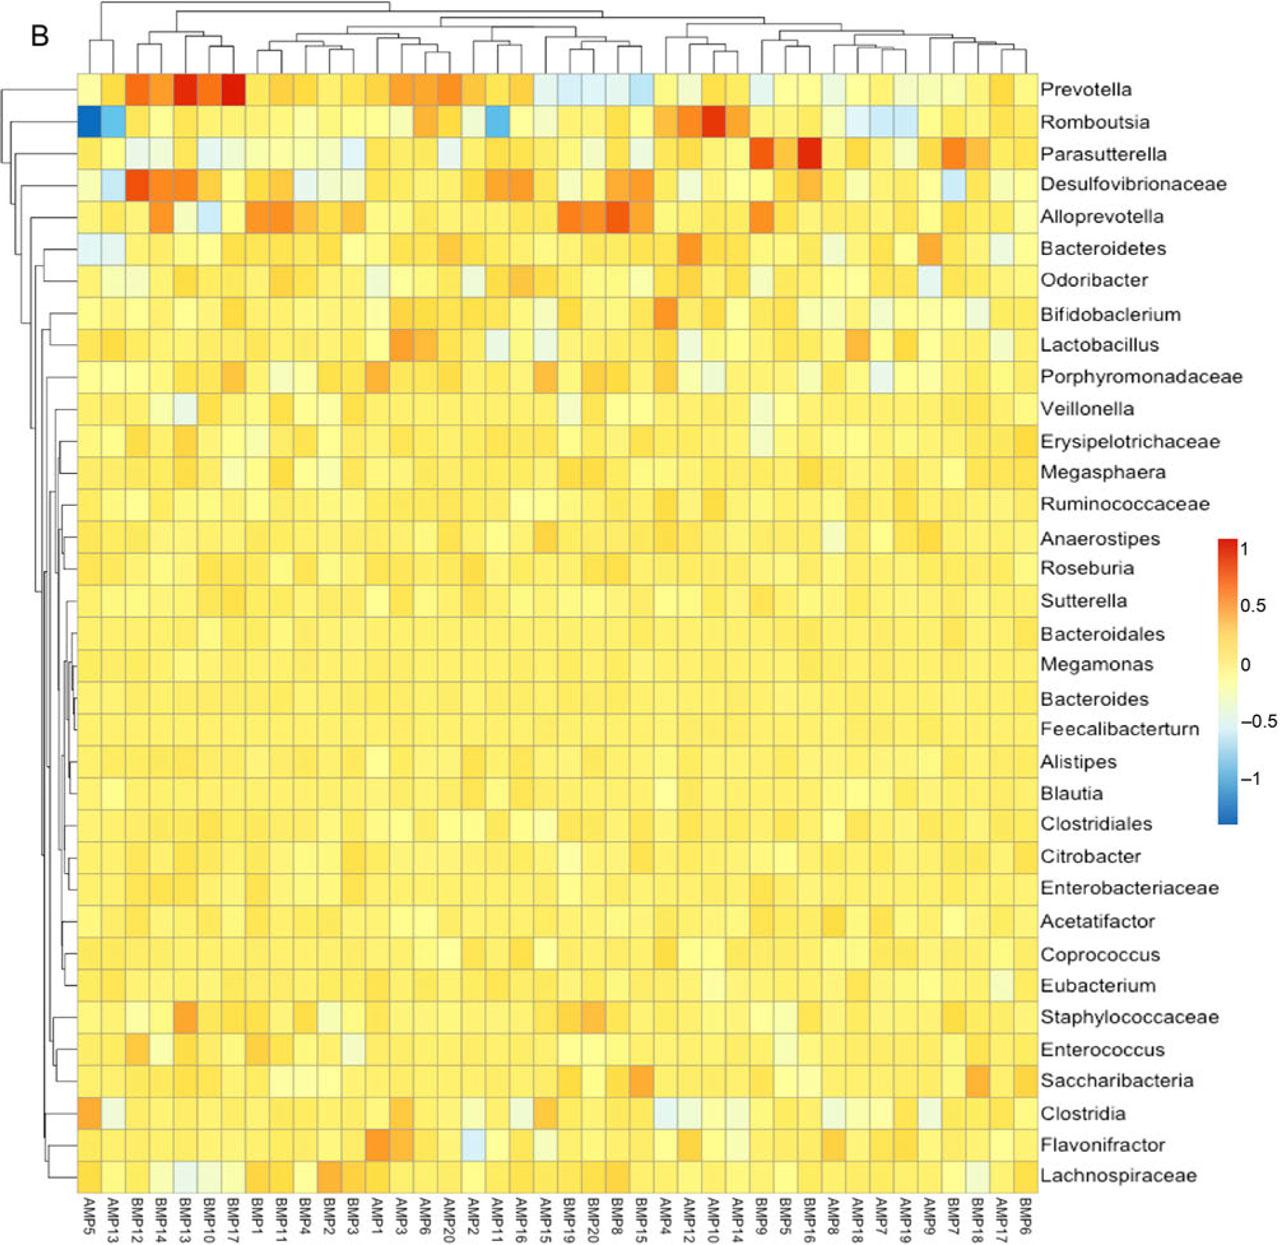
Fig. 4C.
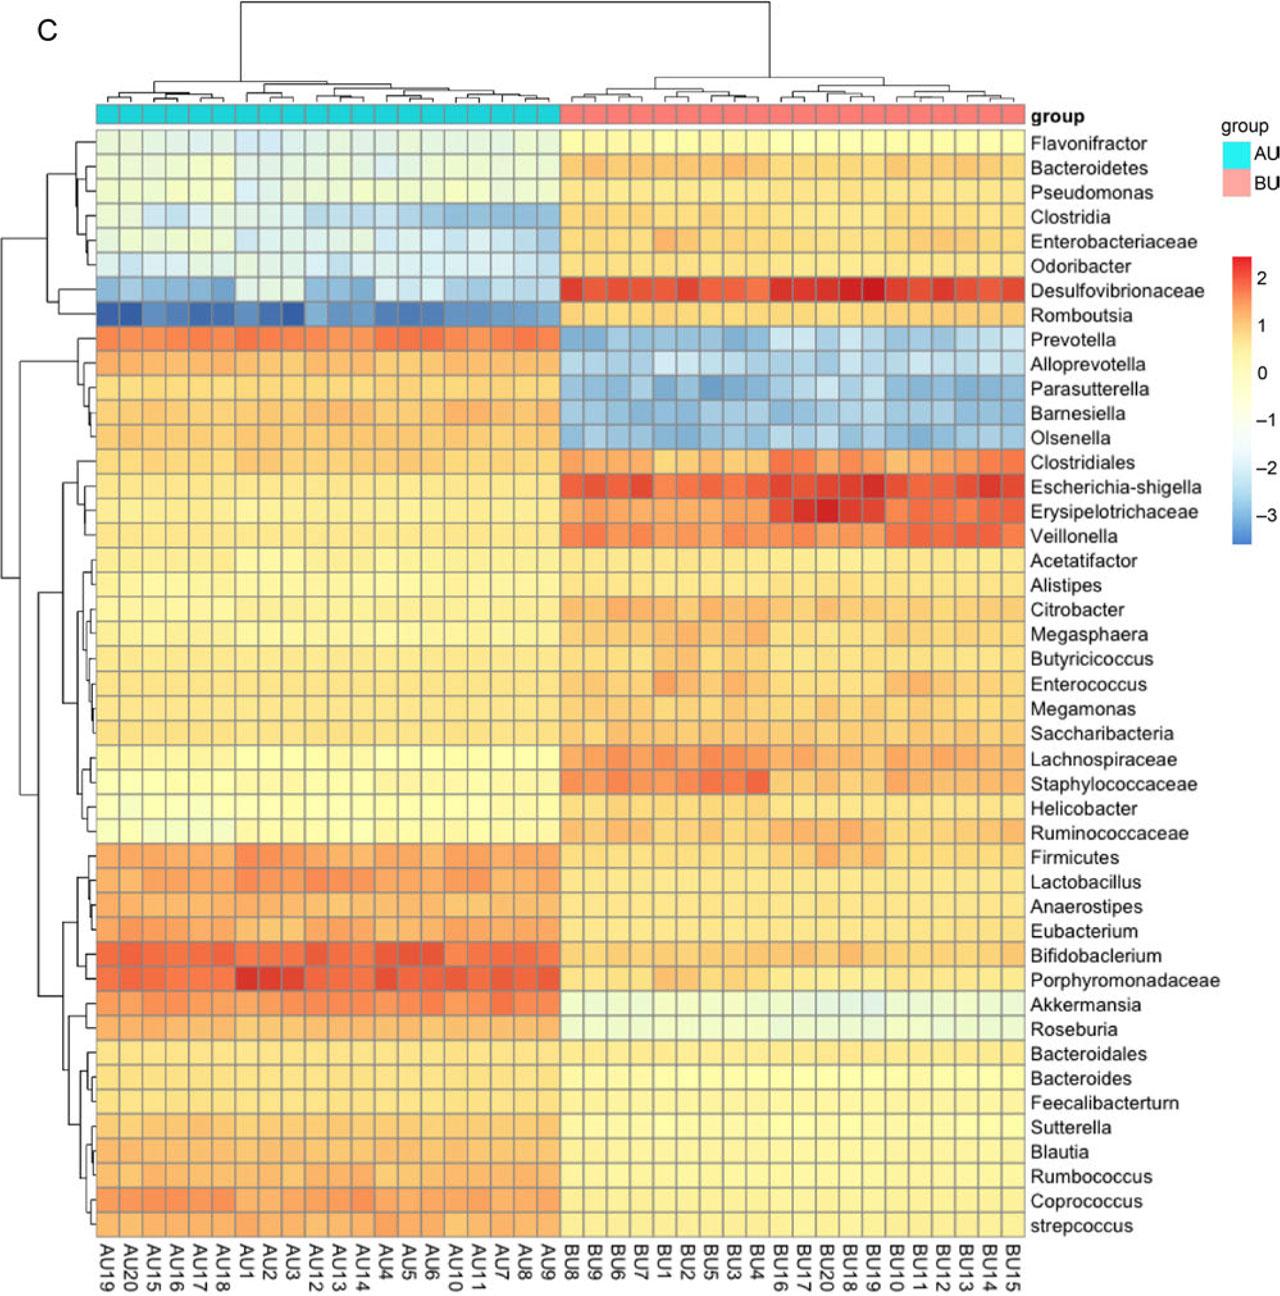
Fig. 4D.
Self-rating depression scale (SDS) and self-rating anxiety scale (SAS) before and after FMT (± SD)_
| Time | Experimental group | Placebo group | ||
|---|---|---|---|---|
| SDS | SAS | SDS | SAS | |
| Males | ||||
| Before FMT | 55.29 ± 7.393 | 44.16 ± 5.929 | 57.829 ± 9.209 | 43.377 ± 4.004 |
| 3 weeks | 49.55 ± 6.093 ***### | 41.01 ± 5.287 # | 55.113 ± 5.801 | 41.958 ± 7.969 |
| 6 weeks | 45.98 ± 5.4 ****#### | 37.5 ± 4.275 ***### | 58.437 ± 8.857 | 42.09 ± 7.982 |
| 9 weeks | 42.84 ± 4.051 ****#### | 33.99 ± 3.623 ****#### | 55.386 ± 11.322 | 45.402 ± 6.562 |
| Females | ||||
| Before FMT | 54.76 ± 7.411 | 45.09 ± 5.935 | 55.217 ± 9.891 | 44.784 ± 5.301 |
| 3 weeks | 46.79 ± 5.752 ****### | 39.08 ± 5.17 ***## | 54.6 ± 10.427 | 44.177 ± 8.28 |
| 6 weeks | 43.41 ± 5.362 ****### | 34.29 ± 3.909 ****## | 53.23 ± 6.527 | 46.833 ± 7.012 |
| 9 weeks | 37.66 ± 4.091 ****#### | 28.5 ± 3.781 ****#### | 56.04 ± 5.384 | 49.115 ± 4.044 |
UC scores before and after FMT (± SD)_
| Time | Diarrhea score | Abdominal pain score | Bloody stool | Mucosa score | Mayo score |
|---|---|---|---|---|---|
| Males (experimental group) | |||||
| Before FMT | 5.294 ± 1.658 | 5.091 ± 1.696 | 5.358 ± 1.579 | 1.772 ± 0.516 | 5.357 ± 1.724 |
| 3 weeks | 4.719 ± 1.612 *## | 4.598 ± 1.378 *## | 3.956 ± 1.428 *****#### | 1.533 ± 0.478 *# | 5.066 ± 1.651 |
| 6 weeks | 4.267 ± 1.457 ***### | 4.269 ± 1.428 ***### | 3.932 ± 1.195 *****#### | 1.416 ± 0.441 ***### | 4.317 ± 1.806 ***### |
| 9 weeks | 3.965 ± 1.163 ****#### | 4.116 ± 1.053 ****#### | 3.524 ± 0.895 *****#### | 1.259 ± 0.385 ****#### | 4.443 ± 1.242 **## |
| Males (placebo group) | |||||
| Before FMT | 5.511 ± 1.605 | 5.089 ± 2.126 | 5.464 ± 1.217 | 1.837 ± 0.772 | 5.360 ± 1.565 |
| 3 weeks | 5.430 ± 1.937 | 5.246 ± 1.725 | 5.815 ± 1.391 | 1.960 ± 0.681 | 5.405 ± 2.220 |
| 6 weeks | 5.504 ± 1.351 | 5.305 ± 1.892 | 5.194 ± 1.432 | 1.859 ± 0.546 | 5.483 ± 2.218 |
| 9 weeks | 5.566 ± 2.071 | 5.188 ± 1.762 | 5.073 ± 1.229 | 1.772 ± 0.508 | 4.957 ± 1.361 |
| Females (experimental group) | |||||
| Before FMT | 4.979 ± 1.741 | 4.812 ± 1.606 | 5.086 ± 1.696 | 1.721 ± 0.501 | 5.665 ± 1.808 |
| 3 weeks | 4.005 ± 1.282 ****### | 3.381 ± 1.327 ****#### | 3.520 ± 1.254 ****#### | 1.442 ± 0.457 **## | 4.730 ± 1.473 ***### |
| 6 weeks | 3.523 ± 1.087 ****### | 3.12 ± 1.009 ****#### | 3.034 ± 0.925 ****#### | 1.24 ± 0.349 ****#### | 4.503 ± 1.643 ****#### |
| 9 weeks | 2.933 ± 0.787 ****#### | 2.924 ± 0.835 ****#### | 2.396 ± 0.535 ****#### | 1.098 ± 0.309 ****#### | 3.978 ± 1.096 ****#### |
| Females (placebo group) | |||||
| Before FMT | 5.318 ± 2.286 | 5.060 ± 1.895 | 5.009 ± 1.574 | 1.653 ± 0.752 | 5.711 ± 1.858 |
| 3 weeks | 5.095 ± 1.952 | 4.512 ± 1.217 | 5.587 ± 2.193 | 1.958 ± 0.363 | 5.287 ± 2.241 |
| 6 weeks | 4.640 ± 1.970 | 5.282 ± 1.496 | 5.079 ± 1.563 | 1.867 ± 0.743 | 5.533 ± 2.010 |
| 9 weeks | 5.459 ± 1.997 | 5.062 ± 1.390 | 5.048 ± 2.109 | 1.713 ± 0.654 | 5.542 ± 1.831 |
Baseline characteristics of adolescent donors_
| Parameters | Males (n = 68) | Females (n = 68) | t-values | p-values |
|---|---|---|---|---|
| Age | 13.91 ± 2.22 | 13.91 ± 2.563 | 0.010 | 0.992 |
| BMI | 22.59 ± 1.468 | 22.38 ± 1.416 | 0.001 | 0.999 |
| hsCRP (mg/dl) | 0.487 ± 0.253 | 0.4856 ± 0.299 | 1.232 | 0.999 |
| Triglyceride (mg/dl) | 73.24 ± 14.41 | 75.41 ± 14.96 | 0.821 | 0.771 |
| Total cholesterol (mg/dl) | 169.6 ± 14.09 | 171.1 ± 13.43 | 0.268 | 0.958 |
| HDL-c (mg/dl) | 64.91 ± 3.155 | 65.38 ± 2.962 | 0.513 | 0.999 |
| LDL-c (mg/dl) | 94.8 ± 15.2 | 95.7 ± 13.67 | 0.002 | 0.996 |
hsCRP levels in ulcerative colitis (UC) patients before and after FMT (± SD)_
| Time | Experimental group | Placebo group | t-values | p-values |
|---|---|---|---|---|
| Males | ||||
| Before FMT | 3.707 ± 1.209 | 3.634 ± 1.262 | 0.288 | 0.294 |
| 3 weeks | 3.521 ± 1.312 | 4.127 ± 1.374 | 3.279 | 0.001 |
| 6 weeks | 3.511 ± 1.091 | 3.493 ± 0.966 | 0.134 | 0.894 |
| 9 weeks | 3.033 ± 1.184** | 3.577 ± 1.581 | 1.753 | 0.008 |
| Females | ||||
| Before FMT | 3.776 ± 1.379 | 3.426 ± 1.295 | 1.941 | 0.054 |
| 3 weeks | 3.219 ± 1.219* | 3.791 ± 1.275 | 2.035 | 0.044 |
| 6 weeks | 2.821 ± 1.023**** | 3.474 ± 1.091 | 3.911 | 0.000 |
| 9 weeks | 2.35 ± 0.8592**** | 3.526 ± 1.365 | 6.359 | 0.000 |
Baseline characteristics of ulcerative colitis (UC) patients_
| Parameters | Experimental group (n = 68) | Placebo group (n = 68) | χ2 or t-values | p-values |
|---|---|---|---|---|
| Males | ||||
| Age | 45.2 ± 13.6 | 47.1 ± 11.4 | 0.402 | 0.688 |
| BMI | 22.5 ± 2.16 | 21.5 ± 3.4 | 1.484 | 0.141 |
| Smoker, n (%) | 18 (43.9%) | 17 (25.0%) | 0.038 | 0.844 |
| Drinker, n (%) | 12 (17.6%) | 11 (16.2%) | 0.052 | 0.819 |
| Protein intake (g/day) | 79.252 ± 14.791 | 82.543 ± 27.594 | 0.456 | 0.377 |
| Fat intake (g/day) | 89.618 ± 33.173 | 92.609 ± 38.641 | 0.158 | 0.623 |
| Carbohydrate intake (g/day) | 258.167 ± 70.847 | 264.875 ± 74.136 | 0.568 | 0.326 |
| Vitamin A intake (μg/day) | 817.949 ± 190.225 | 839.24 ± 196.633 | 0.479 | 0.354 |
| Vitamin C intake (mg/day) | 99.564 ± 37.648 | 108.344 ± 11.862 | 0.984 | 0.102 |
| Vitamin D intake (μg/day) | 28.134 ± 14.025 | 30.848 ± 10.064 | 1.033 | 0.096 |
| Calcium intake (mg/day) | 997.56 ± 202.16 | 1018.256 ± 310.141 | 1.527 | 0.058 |
| Iron intake (mg/day) | 41.123 ± 25.249 | 38.897 ± 35.102 | 1.320 | 0.079 |
| hsCRP (mg/dl) | 3.707 ± 1.209 | 4.034 ± 1.25 | 0.135 | 0.893 |
| Triglyceride (mg/dl) | 98.2 ± 33.0 | 95.4 ± 33.9 | 1.375 | 0.172 |
| Total cholesterol (mg/dl) | 188 ± 21.4 | 191.6 ± 14.3 | 0.841 | 0.402 |
| HDL-c (mg/dl) | 49.7 ± 6.11 | 46.04 ± 7.44 | 1.951 | 0.064 |
| LDL-c (mg/dl) | 123 ± 18 | 129.9 ± 21.3 | 1.152 | 0.133 |
| Females | ||||
| Age | 40.6 ± 12.9 | 36.7 ± 14.0 | 1.220 | 0.225 |
| BMI | 21.6 ± 1.94 | 20.55 ± 1.62 | 1.861 | 0.056 |
| Smoker, n (%) | 20 (48.78%) | 18 (26.5%) | 0.146 | 0.702 |
| Drinker, n (%) | 11 (16.17%) | 13 (19.12%) | 0.202 | 0.653 |
| Menopausal status | ||||
| Premenopausal, n (%) | 41 (60.29) | 48 (70.59) | ||
| Perimenopausal, n (%) | 20 (29.41) | 17 (25) | 2.394 | 0.302 |
| Postmenopausal, n (%) | 7 (10.29) | 3 (4.41) | ||
| Protein intake (g/day) | 75.252 ± 28.791 | 70.543 ± 15.594 | 1.632 | 0.053 |
| Fat intake (g/day) | 73.618 ± 32.173 | 77.609 ± 16.641 | 0.105 | 0.647 |
| Carbohydrate intake (g/day) | 247.167 ± 74.847 | 259.875 ± 85.136 | 0.258 | 0.394 |
| Vitamin A intake (μg/day) | 830.949 ± 184.225 | 870.24 ± 220.633 | 0.752 | 0.214 |
| Vitamin C intake (mg/day) | 115.564 ± 35.648 | 112.344 ± 32.862 | 0.121 | 0.698 |
| Vitamin D intake (μg/day) | 12.134 ± 4.975 | 10.848 ± 5.064 | 0.097 | 0.876 |
| Calcium intake (mg/day) | 1000.56 ± 222.16 | 1096.256 ± 307.141 | 0.118 | 0.7063 |
| Iron intake (mg/day) | 12.123 ± 10.249 | 13.897 ± 6.102 | 0.237 | 0.425 |
| hsCRP (mg/dl) | 3.776 ± 1.379 | 3.694 ± 1.663 | 0.023 | 0.982 |
| Triglyceride (mg/dl) | 99.9 ± 31.2 | 99.4 ± 33.8 | 0.453 | 0.651 |
| Total cholesterol (mg/dl) | 193 ± 19.3 | 186.4 ± 26.8 | 0.781 | 0.436 |
| HDL-c (mg/dl) | 50.7 ± 5 | 49.7 ± 1.5 | 0.504 | 0.616 |
| LDL-c (mg/dl) | 119 ± 18.1 | 119.5 ± 19.8 | 0.753 | 0.453 |