
Fig. 1.
Fig. 2.
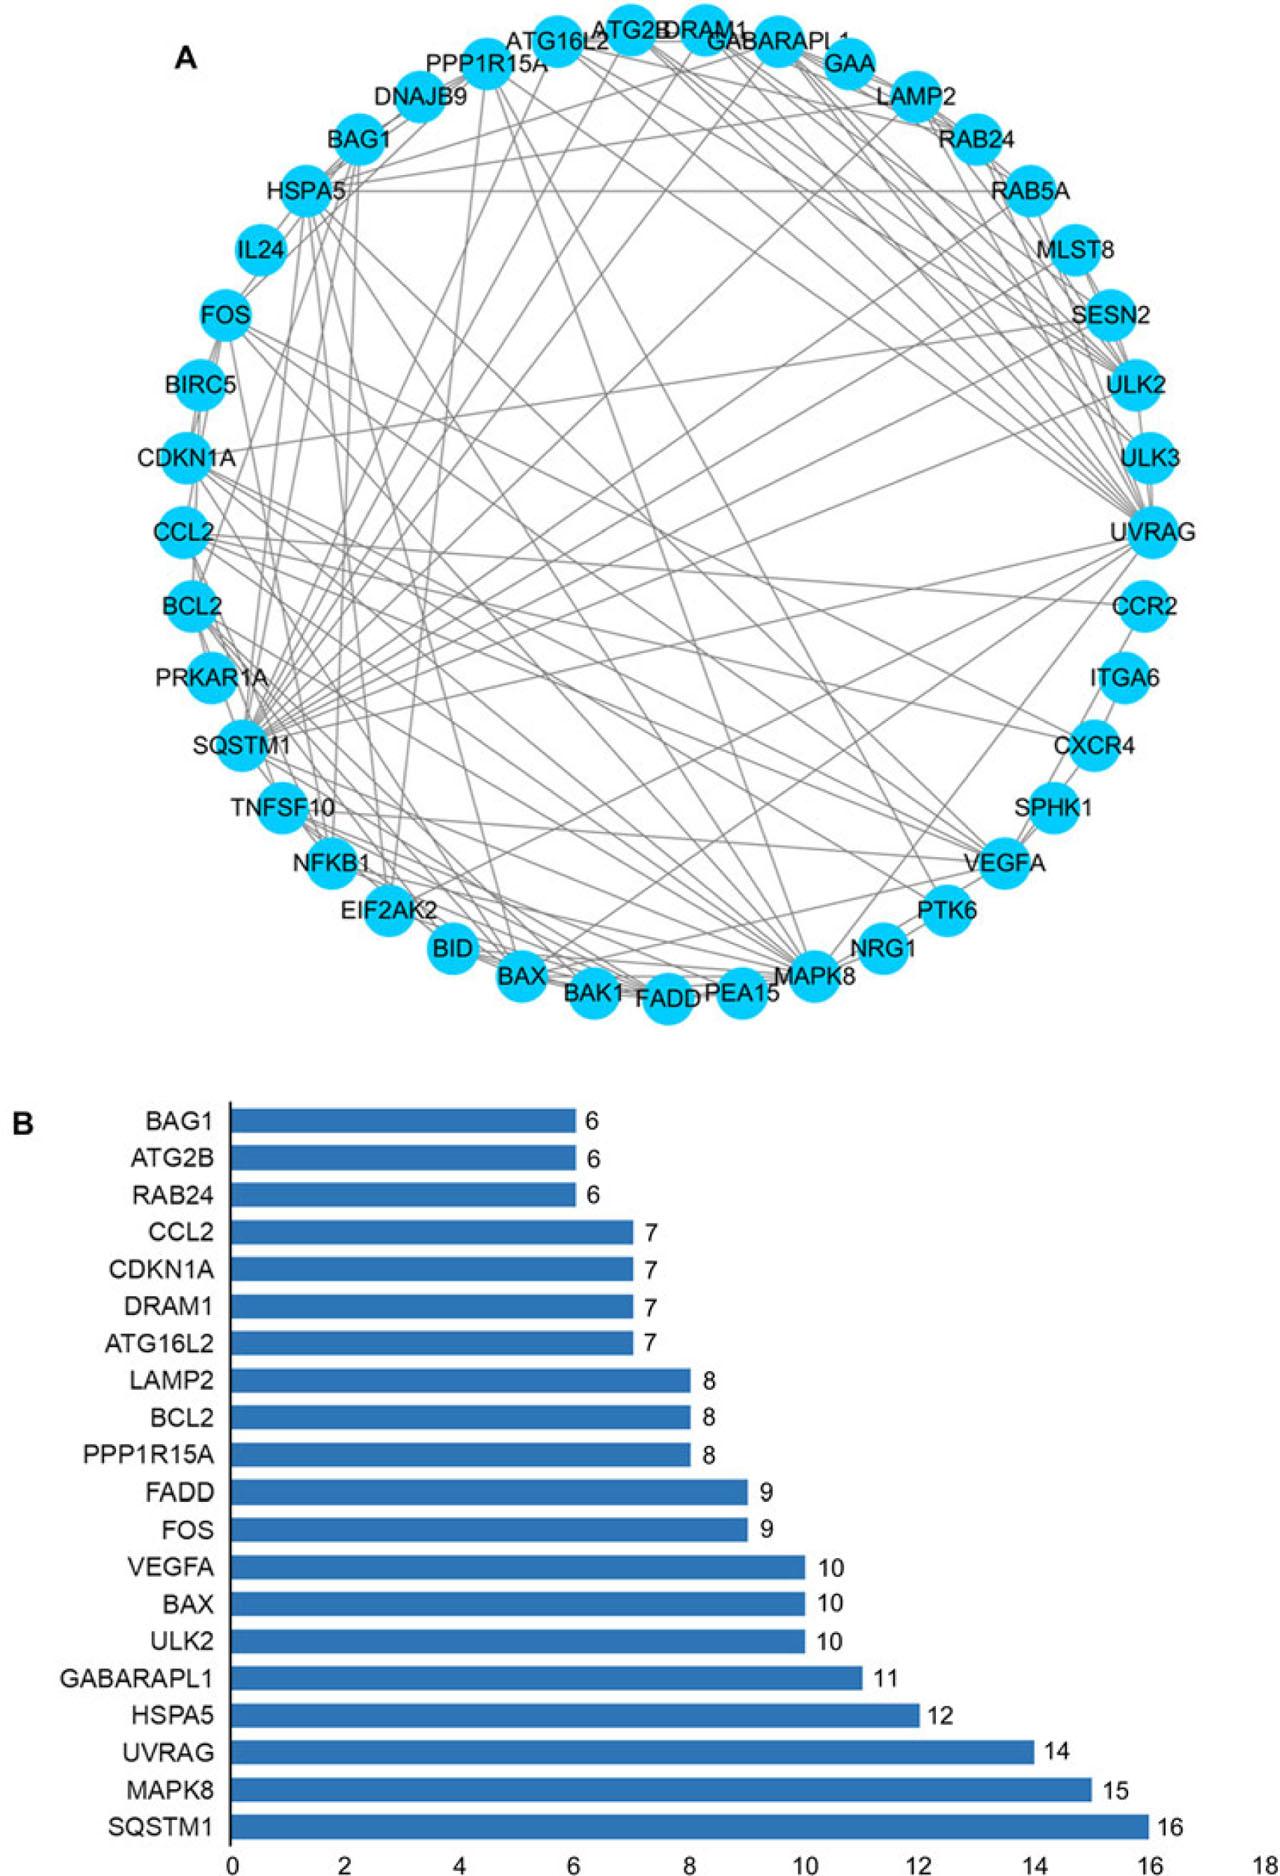
Fig. 3.
Fig. 4.
Fig. 5.
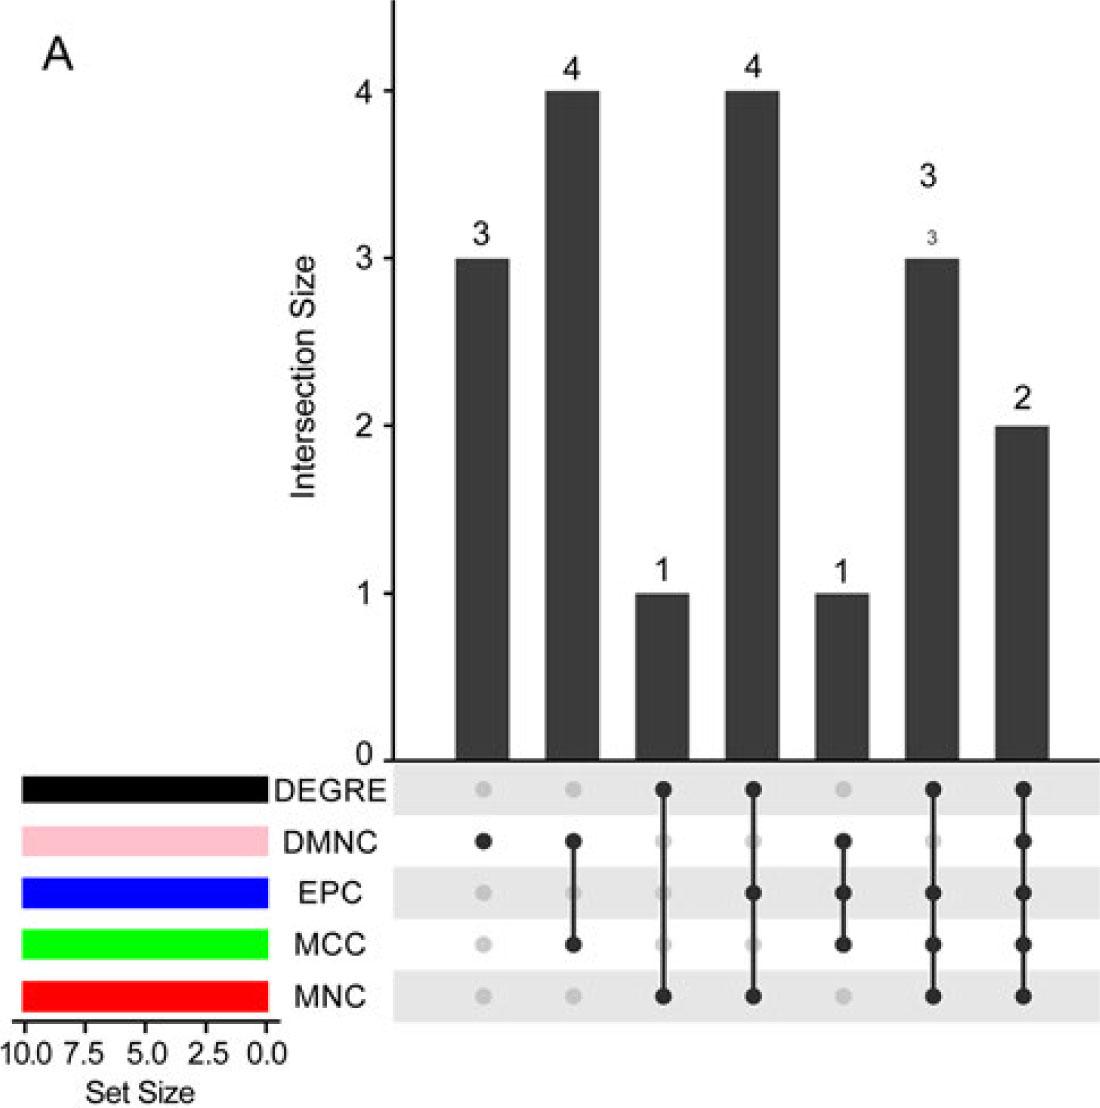
Fig. 6.
Fig. 7.
Top 10 hub genes obtained by five algorithms of the Cytohubba_ cytoHuba
| MNC | MCC | EPC | DMNC | Degree |
|---|---|---|---|---|
| SQSTM1 | GABARAPL1 | MAPK8 | ATG16L2 | SQSTM1 |
| UVRAG | UVRAG | SQSTM1 | RAB24 | MAPK8 |
| MAPK8 | ULK2 | UVRAG | DRAM1 | UVRAG |
| GABARAPL1 | ATG16L2 | GABARAPL1 | RAB5A | HSPA5 |
| HSPA5 | SQSTM1 | BAX | BAK1 | GABARAPL1 |
| ULK2 | DRAM1 | HSPA5 | ATG2B | ULK2 |
| BAX | RAB24 | ULK2 | LAMP2 | BAX |
| FOS | ATG2B | FADD | BID | VEGFA |
| VEGFA | MAPK8 | FOS | ULK2 | FOS |
| FADD | LAMP2 | LAMP2 | GABARAPL1 | FADD |