

Fig. 1.

Fig. 2.
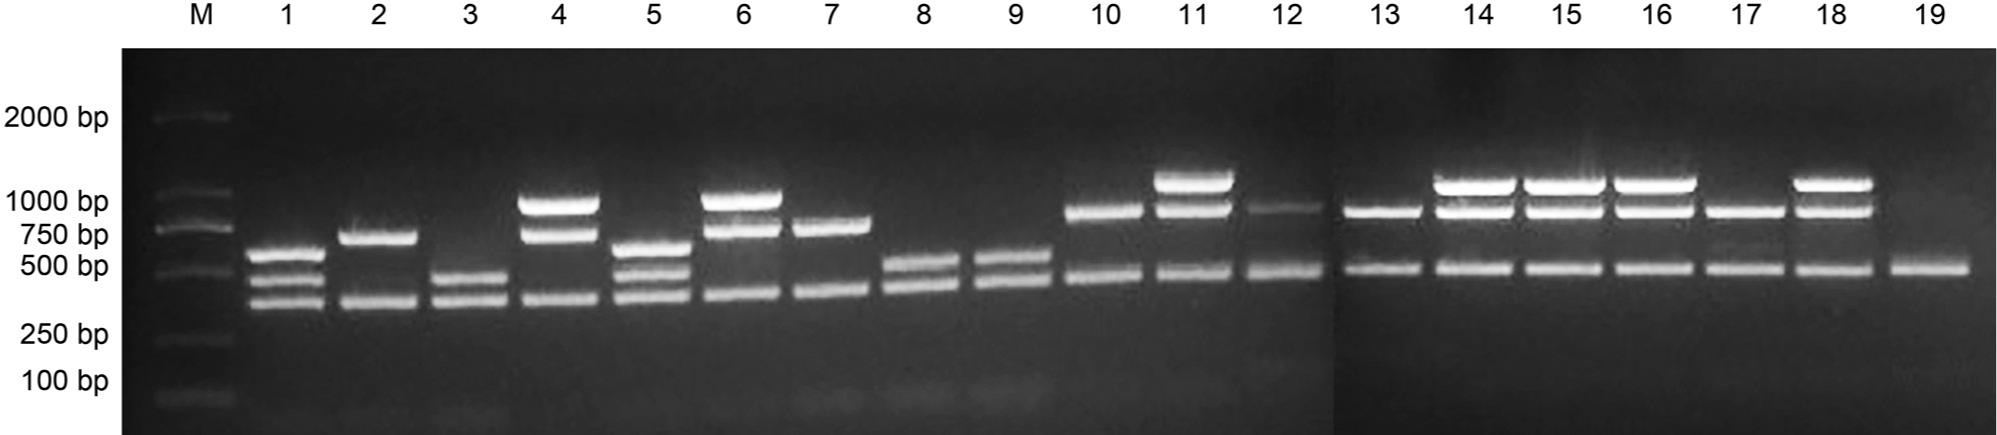
Fig. 3.

Fig. 4.
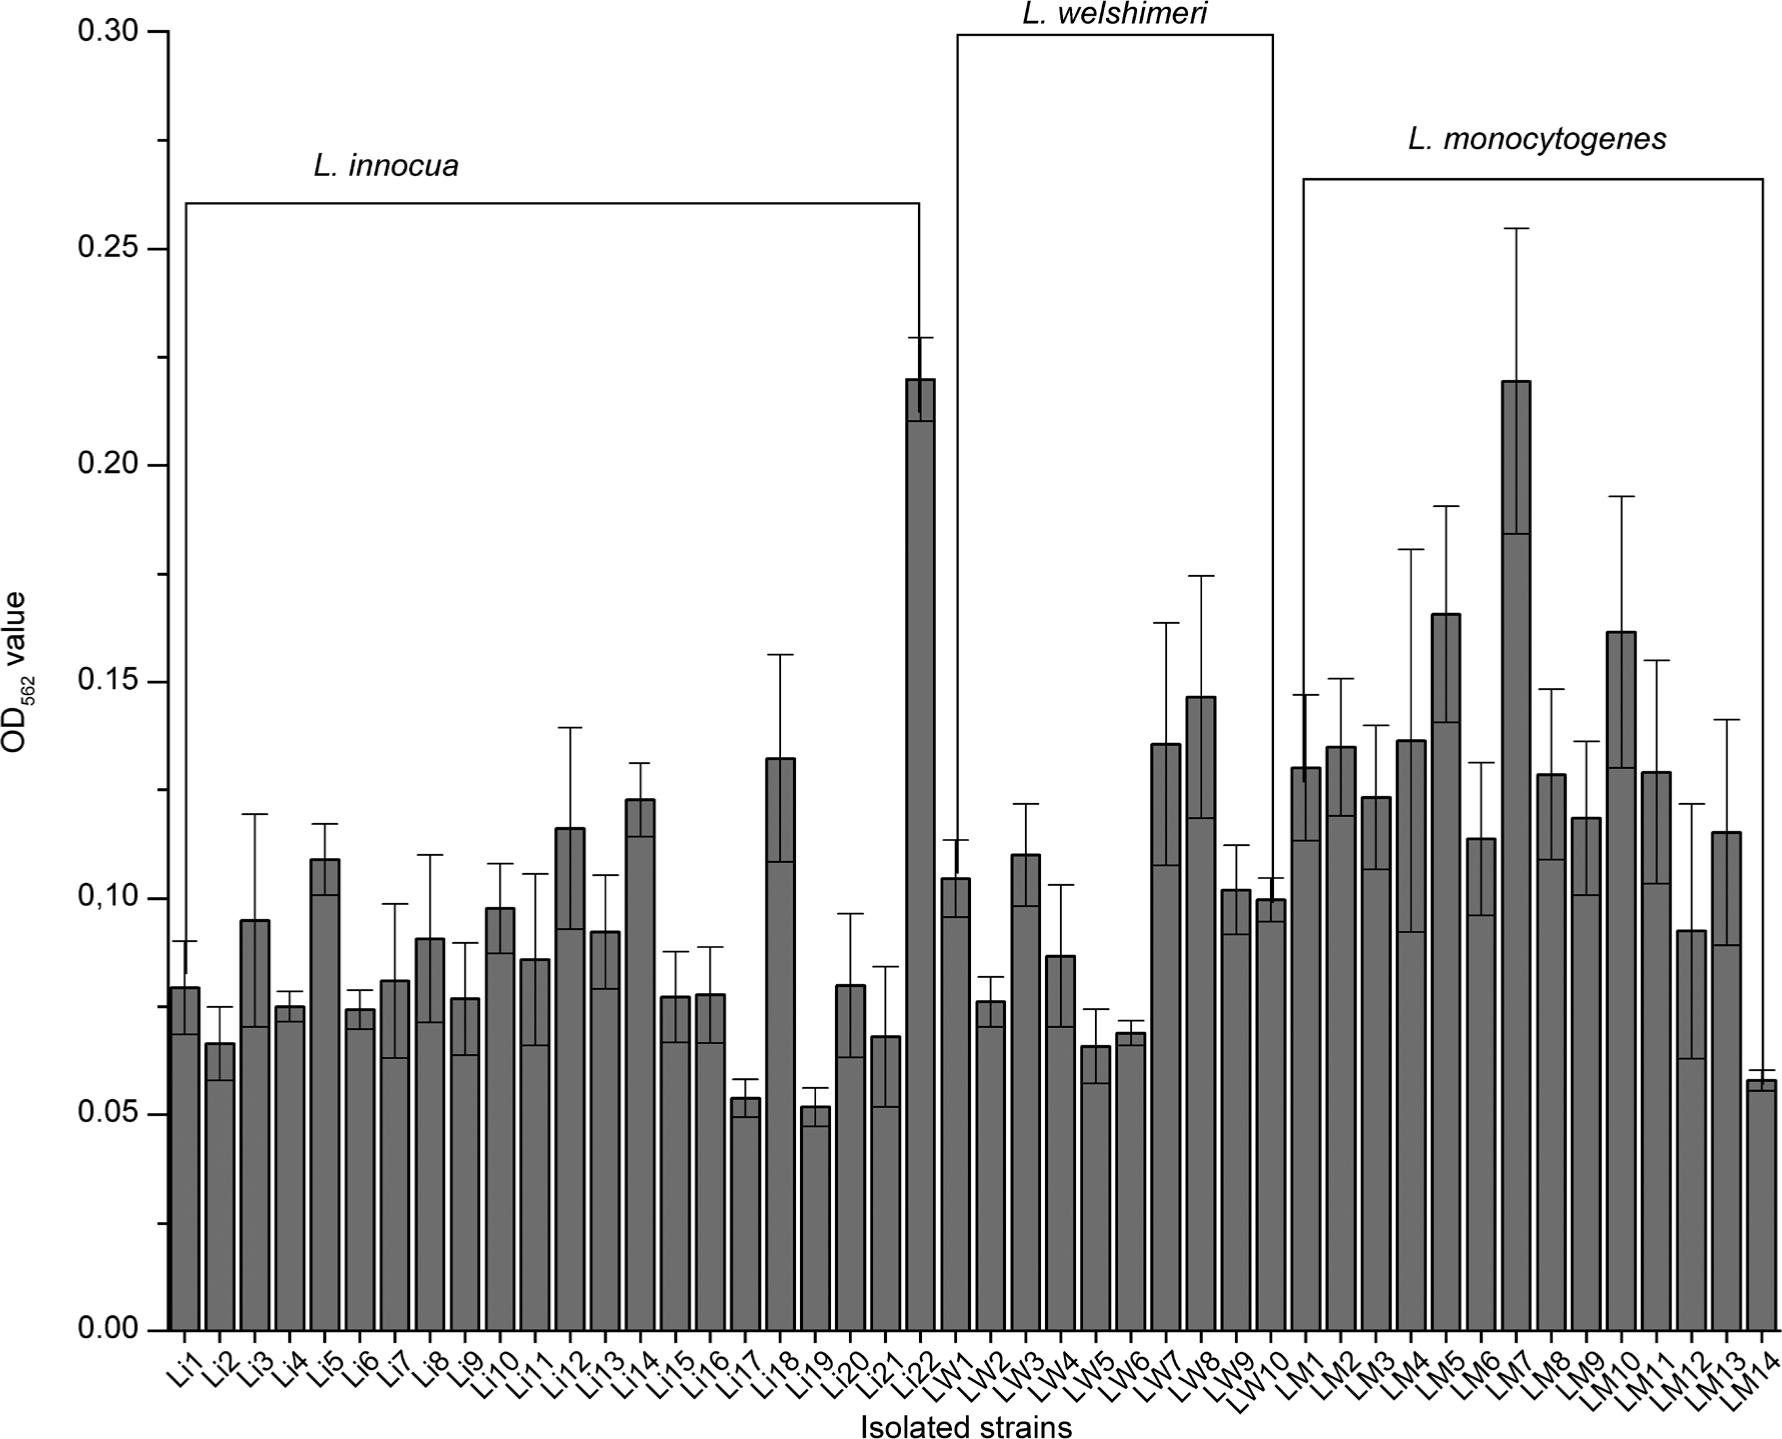
Fig. 5.

Primer information_
| Gene target | Primer sequence (5’-3’) | Product size | Application |
|---|---|---|---|
| prs-F | GCTGAAGAGATTGCGAAAGAAG | 370 | Listeria species-specific primers |
| prs-R | CAAAGAAACCTTGGATTTGCGG | ||
| Lmo2234-F | TGTCCAGTTCCATTTTTAACT | 420 | Listeria monocytogenes specific primers |
| Lmo2234-R | TTGTTGTTCTGCTGTACGA | ||
| Lin0464-F | CGCATTTATCGCCAAAACTC | 749 | Listeria innocua specific primers |
| Lin0464-R | TCGTGACATAGACGCGATTG | ||
| lmo0737-F | AGGGCTTCAAGGACTTACCC | 691 | For the identification of Listeria monocytogenes serogroup |
| lmo0737-R | ACGATTTCTGCTTGCCATTC | ||
| lmo1118-F | AGGGGTCTTAAATCCTGGAA | 909 | For the identification of Listeria monocytogenes serogroup |
| lmo1118-R | CGGCTTGTTCGGCATACTTA | ||
| ORF2819-F | AGCAAAATGCCAAAACTCGT | 471 | For the identification of Listeria monocytogenes serogroup |
| ORF2819-R | CATCACTAAAGCCTCCCATTG | ||
| ORF2110-F | AGTGGACAATTGATTGGTGAA | 597 | For the identification of Listeria monocytogenes serogroup |
| ORF2110-R | CATCCATCCCTTACTTTGGAC | ||
| 16S rRNA-27F | AGAGTTTGATCCTGGCTCAG | 1,500 | Used for cluster analysis |
| 16S rRNA-1492R | GGTTACCTTGTTACGACTT |
Statistic of data on the prevalence of Listeria spp_ according to regions and sample categories_
| Number of samples | Listeria monocytogenes positive samples (%) | Listeria innocua positive samples (%) | Listeria welshimeri positive samples (%) | Listeria spp. positive samples (%) | |
|---|---|---|---|---|---|
| Different regions | |||||
| Lanzhou City | 298 | 7 (2.4a) | 30 (10.1b) | 2 (0.7b) | 39 (13.1b) |
| Qingyang City | 275 | 6 (2.2b) | 95 (34.6a) | 4 (1.5a) | 105 (38.2a) |
| Jiuquan City | 129 | 1 (0.8c) | 2 (1.6d) | 0 (0c) | 3 (2.3d) |
| Dingxi City | 400 | 0 (0d) | 6 (1.5d) | 0 (0c) | 6 (1.5e) |
| Zhangye City | 285 | 0 (0d) | 17 (6.0c) | 4 (1.4a) | 21 (7.4c) |
| Total | 1,387 | 14 (1.0) | 150 (10.8) | 10 (0.7) | 174 (12.6) |
| Different categories of samples | |||||
| Pork | 784 | 8 (1.0b) | 81 (10.3d) | 7 (0.9a) | 96 (12.3c) |
| Beef and mutton | 298 | 3 (1.0b) | 35 (11.7b) | 2 (0.7b) | 40 (13.4a) |
| Chicken | 264 | 3 (1.14a) | 29 (11.0c) | 1 (0.4c) | 33 (12.5b) |
| Environment samples | 41 | 0 (0b) | 5 (12.2a) | 0 (0d) | 5 (12.2c) |
| Total | 1,387 | 14 (1.0) | 150 (10.8) | 10 (0.7) | 174 (12.6) |
Result of drug susceptibility of Listeria spp_ isolates_
| Antibiotics | Listeria monocytogenes | Listeria innocua | Listeria welshimeri | |||||||||
|---|---|---|---|---|---|---|---|---|---|---|---|---|
| Resistant isolates | Intermediate isolates | Sensitive isolates | Resistance rates (%) | Resistant isolates | Intermediate isolates | Sensitive isolates | Resistance rates (%) | Resistant isolates | Intermediate isolates | Sensitive isolates | Resistance rates (%) | |
| Penicillin | 13 | 0 | 1 | 92.9 | 2 | 0 | 20 | 9.1 | 3 | 0 | 7 | 30.0 |
| Ofloxacin | 1 | 2 | 11 | 7.1 | 1 | 13 | 8 | 4.6 | 2 | 0 | 8 | 20.0 |
| Cefoxitin | 14 | 0 | 0 | 100 | 0 | 0 | 22 | 0 | 2 | 0 | 8 | 20.0 |
| Sulfamethoxazole | 11 | 0 | 3 | 78.6 | 10 | 1 | 11 | 45.5 | 4 | 0 | 6 | 40.0 |
| Tetracycline | 14 | 0 | 0 | 100 | 14 | 0 | 8 | 63.6 | 4 | 0 | 6 | 40.0 |
| Gentamicin | 3 | 0 | 11 | 21.4 | 0 | 0 | 22 | 0 | 1 | 0 | 9 | 10.0 |
| Streptomycin | 2 | 1 | 11 | 14.3 | 5 | 0 | 17 | 23.7 | 1 | 0 | 9 | 10.0 |
| Erythromycin | 13 | 1 | 0 | 92.9 | 4 | 4 | 14 | 18.2 | 3 | 1 | 6 | 30.0 |
| Acetylspiramycin | 13 | 0 | 1 | 92.9 | 5 | 0 | 17 | 22.7 | 3 | 0 | 7 | 30.0 |
| Fosfomycin | 7 | 7 | 0 | 50.0 | 18 | 0 | 4 | 81.8 | 4 | 2 | 4 | 40.0 |