
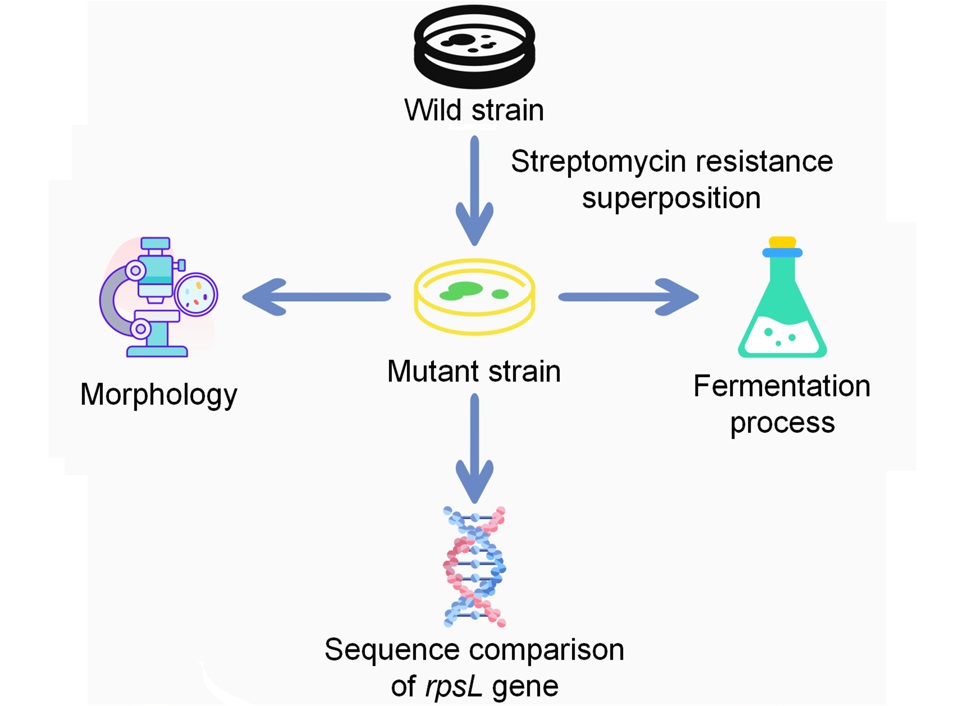
Fig. 1
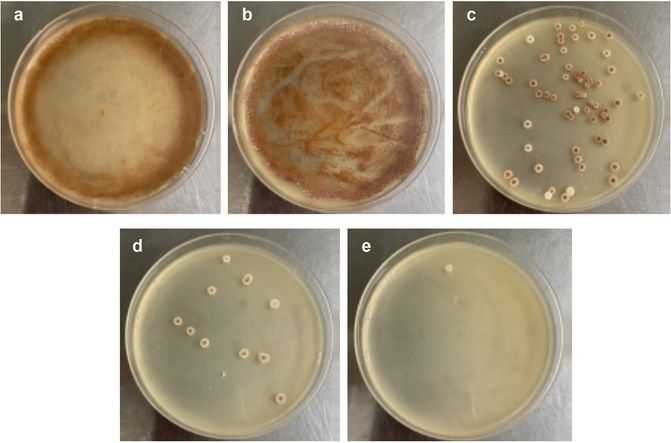
The growth of Streptomyces roseosporus original strain on DT plates with a) 0 μg/ml, b) 0.8 μg/ml, c) 1.0 μg/ml, d) 1.2 μg/ml, e) 1.4 μg/ml streptomycin, respectively.
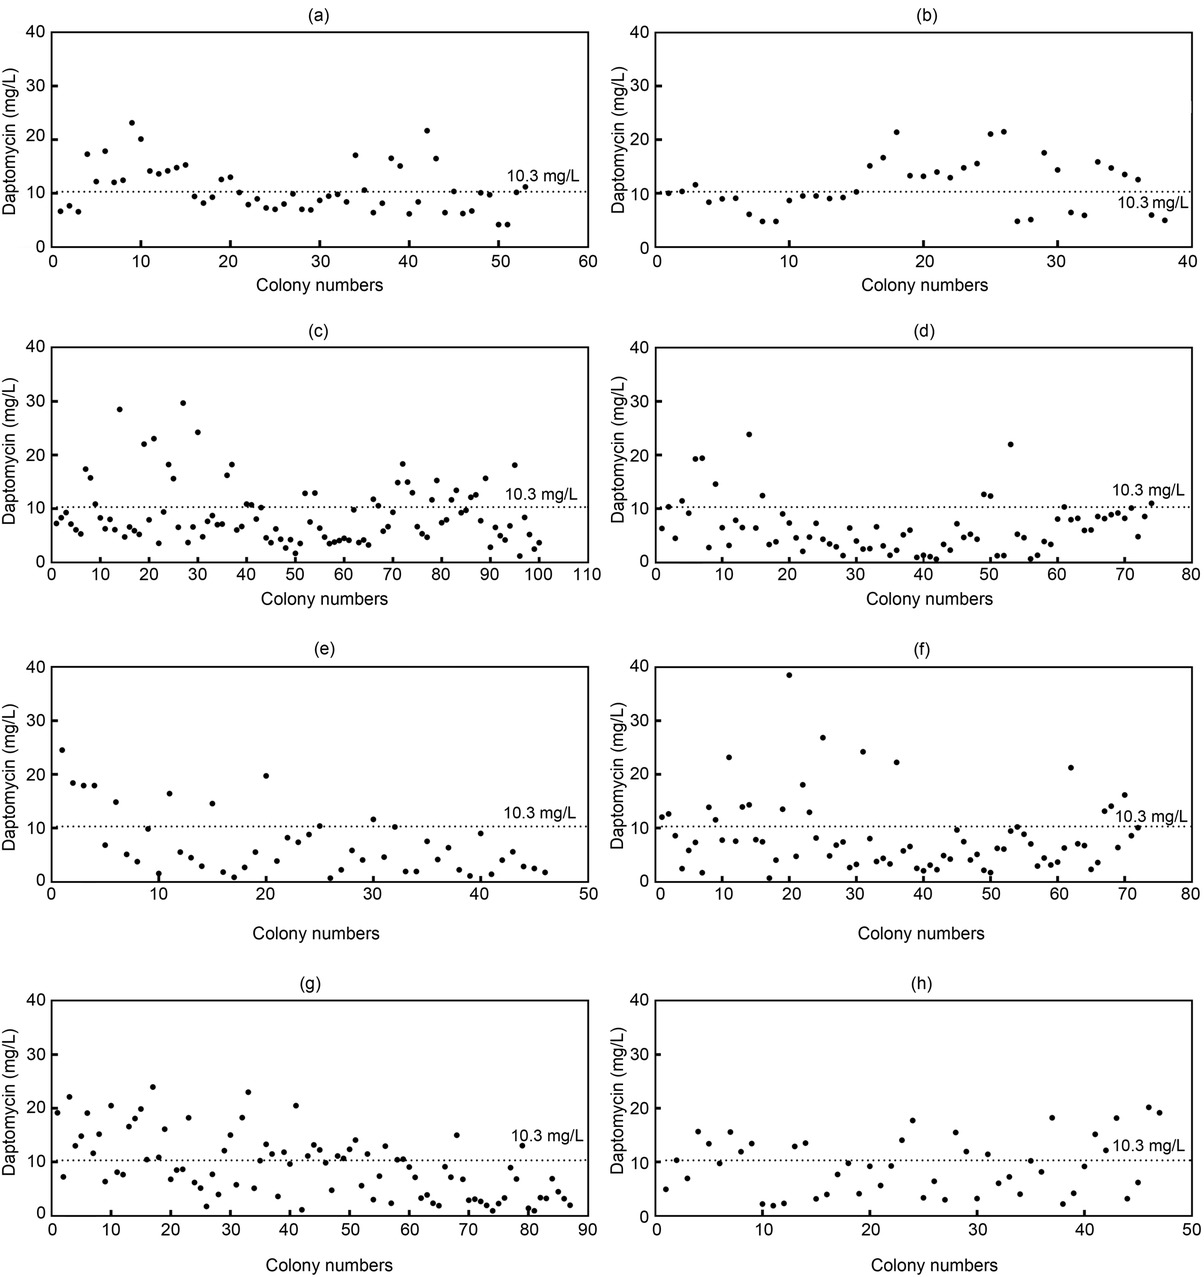
Fig. 2
Daptomycin production by Streptomyces roseosporus mutants screened by DT plates with streptomycin.at a concentration of a) 6 μg/ml, b) 1.8 μg/ml, c) 2.0 μg/ml, d) 2.2 μg/ml, e) 2.4 μg/ml, f) 2.6 μg/ml, g) 2.8 μg/ml, and h) 3.0 μg/ml. The dashed line represents daptomycin production of the parent strain.
Table I
Stability experiment on high-yield daptomycin strains.
| Strain | First generation of daptomycin production (mg/l) | Second generation of daptomycin production (mg/l) | Third generation of daptomycin production (mg/l) | Fourth generation of daptomycin production (mg/l) | Fifth generation of daptomycin production (mg/l) |
|---|---|---|---|---|---|
| BNCC 342432 | 10.5 ± 0.2 | 9.9 ± 0.2 | 10.3 ± 0.2 | 9.7 ± 0.2 | 10.4 ± 0.2 |
| SR-2009 | 28.5 ± 0.2 | 30.0 ± 0.2 | 24.3 ± 0.2 | 25.0 ± 0.2 | 22.8 ± 0.2 |
| SR-2017 | 23.1 ± 0.2 | 21.6 ± 0.2 | 22.8 ± 0.2 | 19.8 ± 0.2 | 14.6 ± 0.2 |
| SR-2023 | 29.7 ± 0.2 | 28.8 ± 0.2 | 30.6 ± 0.2 | 29.2 ± 0.2 | 27.2 ± 0.2 |
| SR-2026 | 24.2 ± 0.2 | 22.9 ± 0.2 | 21.8 ± 0.2 | 20.1 ± 0.2 | 20.6 ± 0.2 |
| SR-2401 | 24.5 ± 0.2 | 25.5 ± 0.2 | 23.4 ± 0.2 | 22.5 ± 0.2 | 24.2 ± 0.2 |
| SR-2620 | 38.5 ± 0.2 | 36.9 ± 0.2 | 41.3 ± 0.2 | 36.0 ± 0.2 | 38.5 ± 0.2 |
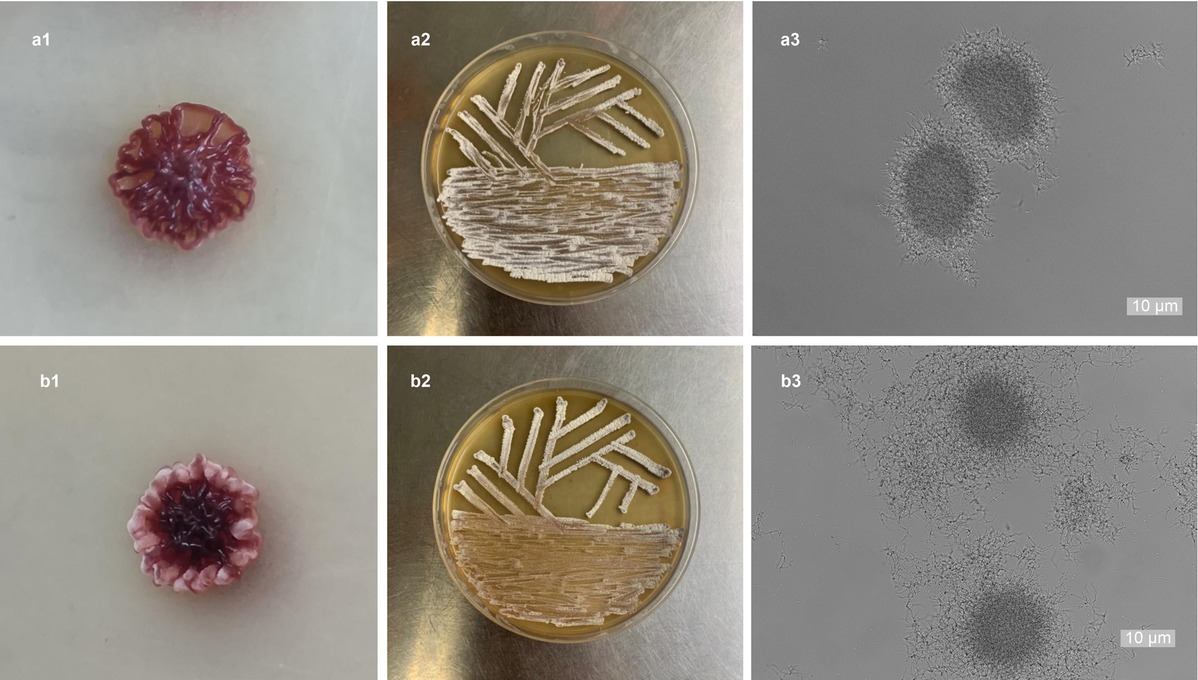
Fig. 3
a1) and b1) Colony and individual morphology of Streptomyces roseosporus strains BNCC 342432 and SR-2620; a2) and b2) spore growth capacity of BNCC 342432 and SR-2620; a3) and b3) mycelial pellet morphology of BNCC 342432 and SR-2620.
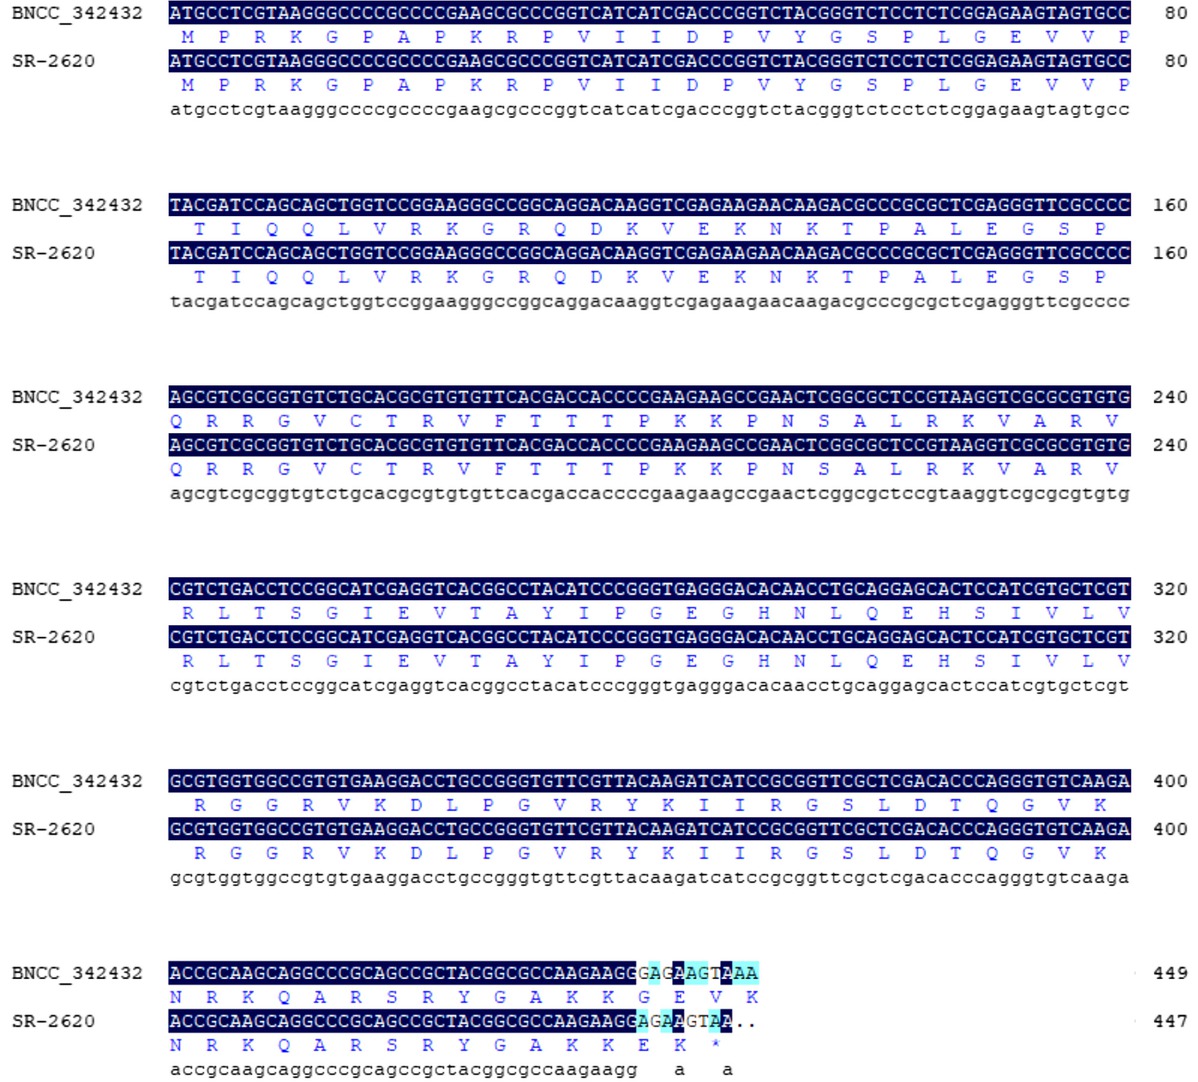
Fig. 4
Sequence comparison of the rpsL gene between Streptomyces roseosporus BNCC 342432 and SR-2620 strains.
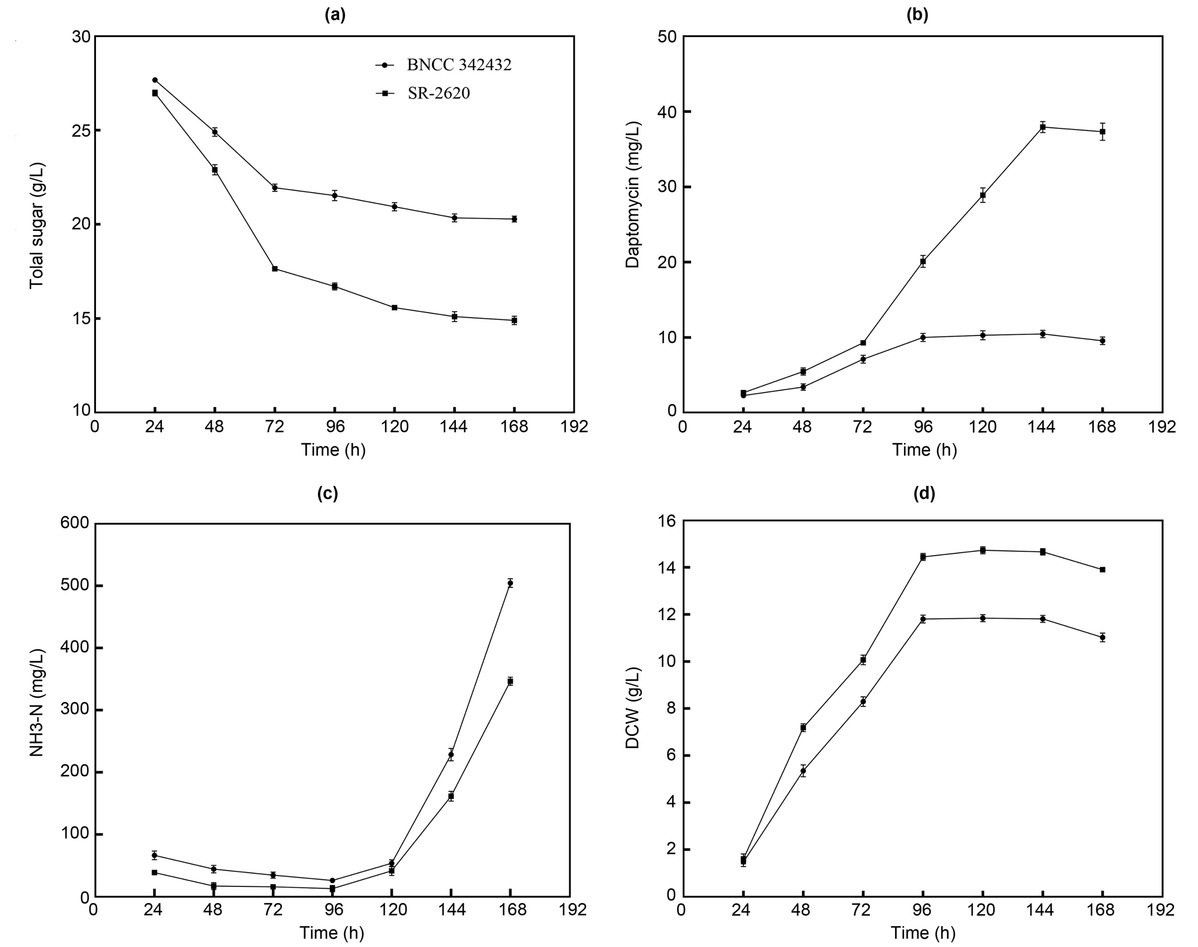
Fig. 5
Comparison of shake flask fermentation between Streptomyces roseosporus BNCC 342432 and SR-2620 strains.