
Fig. 1
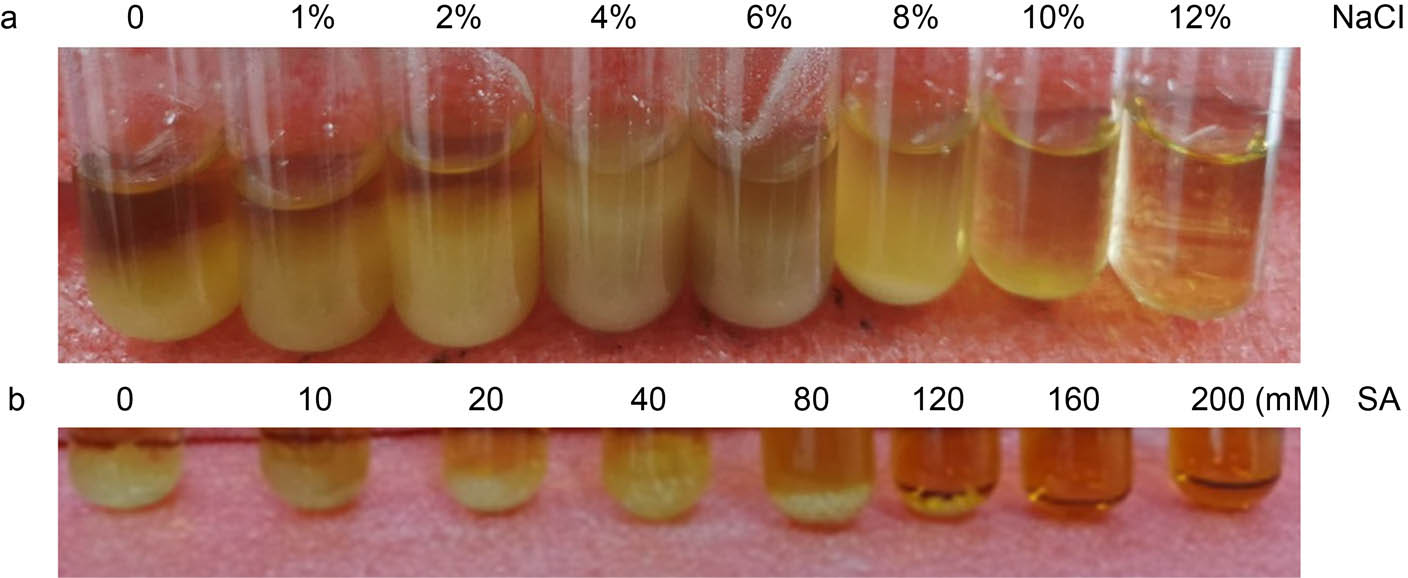
a) Stress tolerance of strain D2-8 in different concentration of salt and b) saline-alkali solutions. SA represents saline and alkaline solution, which contains NaCl, Na2CO3, NaHCO3, and Na2SO4 (molar ratio 1:1:9:9).
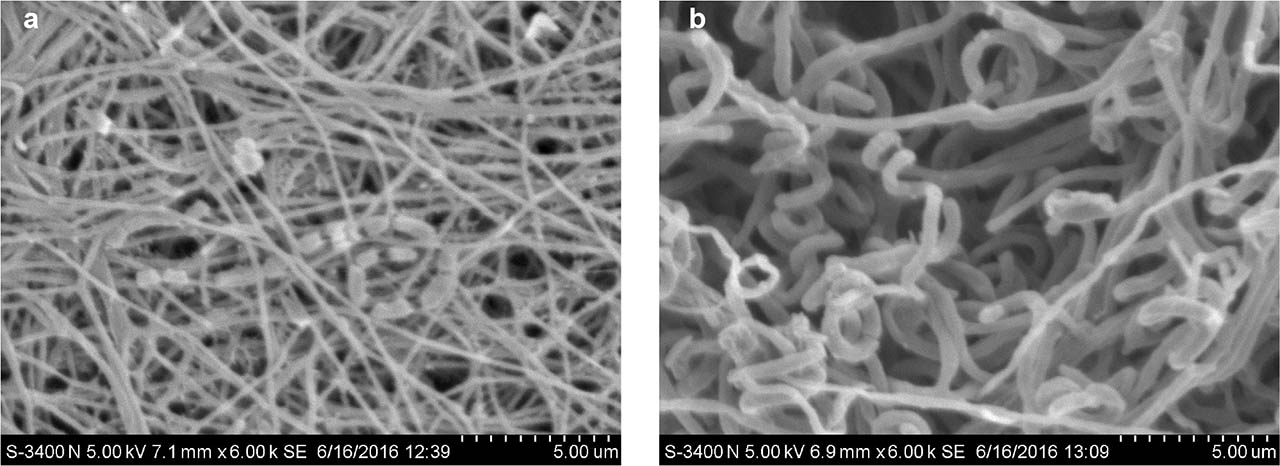
Fig. 2
Morphological characteristics of strain D2-8 observed by scanning electron microscopy.
Table I
Physiological characteristics of strain D2-8.
| Characteristic | D2-8 | Characteristic | D2-8 | Characteristic | D2-8 |
|---|---|---|---|---|---|
| Carbon source utilization | Nitrogen source utilization | Melanin formation on peptone-iron agar | |||
| Lucose | + | L-threonine | + | Cellulose decomposition | – |
| Arabinose | + | L-tyrosine | + | Enzymatic activity | |
| Sucrose | − | L-asparagine | + | Protease | + |
| Xylose | + | Alanine | + | Liquefaction of gelatin | + |
| Inositol | + | Glycine | + | Production of H2S | + |
| Mannitol | + | L-glutaminealanine | + | ||
| Fructose | − | L-arginine | − | ||
| Rhamnose | − | L-proline | + | ||
| Raffinose | + | ||||
| Lactose | + | ||||
| D-ribose | + | + − positive, | |||
| D-galactose | + | − − negative | |||
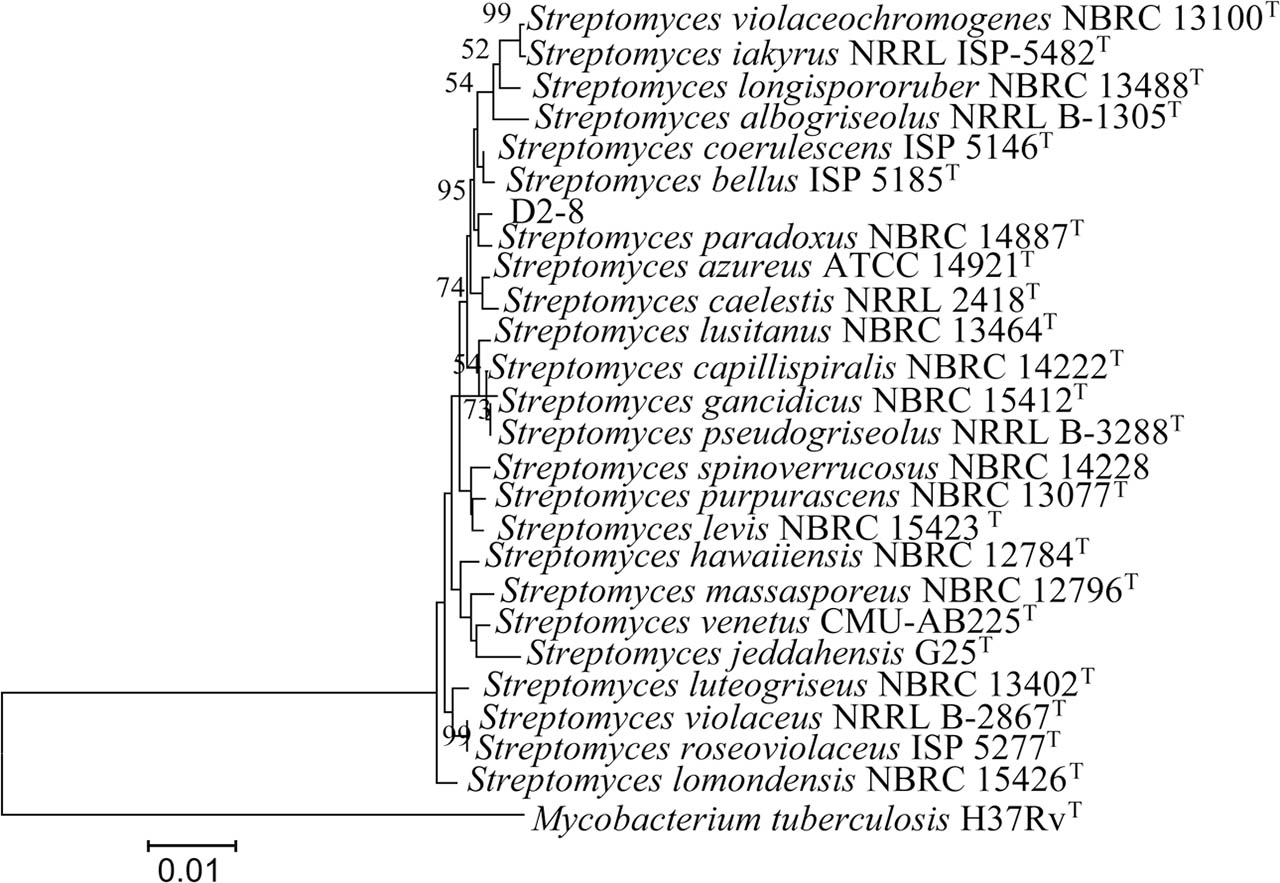
Fig. 3
Neighbor-joining tree of strain D2-8 and the related species of the genus Streptomyces based on the 16S rRNA gene sequences. The out-group used was Mycobacterium tuberculosis H37RvT. The stability of the topology of the phylogenetic tree was assessed by the bootstrap method with 1000 repetitions. Only bootstrap values above 50% (percentages of 1000 replications) are indicated. Scale bar represents 0.01 nucleotide substitutions per site.
Table II
Plant growth promotion properties of strain D2-8.
| Characteristic of D2-8 | Value or properties |
|---|---|
| IAA production | 29.1 μg/ml |
| siderophore production | + |
| organic acids production | + |
| 1-aminocyclopropane-1-carboxylate deaminase (ACCD) production | + |
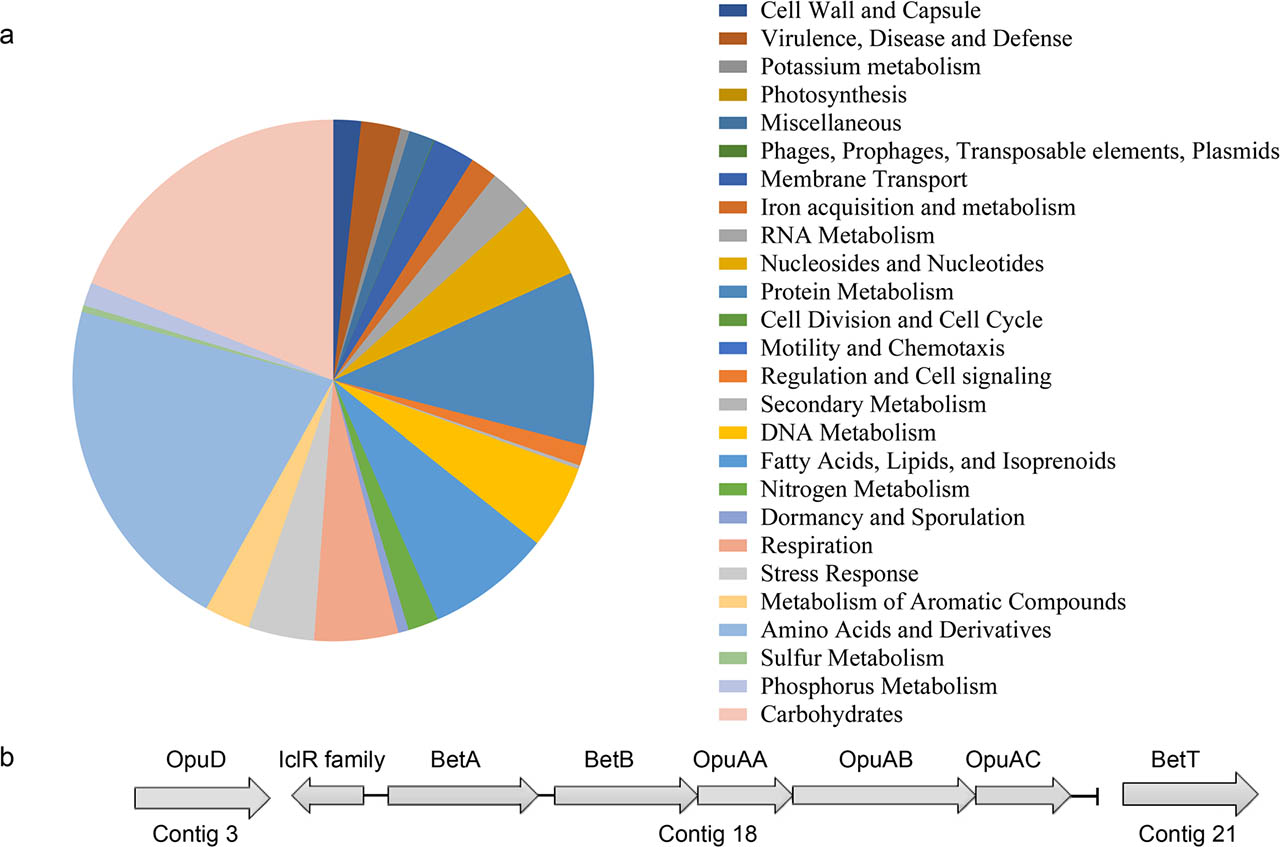
Fig. 4
a) The distribution of subsystems of the D2-8 genome annotated through the RAST webserver and b) stress response genes of D2-8 involved in the production and uptake of choline and glycine betaine.
Table III
The secondary metabolism substances prediction results of antiSMASH.
| Region | Type | From | To | Most similar known cluster | Similarity | |
|---|---|---|---|---|---|---|
| Region 1.1 | siderophore | 27,766 | 39,535 | desferrioxamin B / desferrioxamine E | other | 83% |
| Region 1.2 | melanin, lanthipeptide | 125,173 | 149,340 | melanin | other | 80% |
| Region 23.1 | melanin | 99,231 | 109,596 | melanin | other | 57% |
| Region 1.3 | terpene, NRPS | 542,592 | 599,827 | SCO-2138 | RiPP | 85% |
| Region 8.1 | terpene | 65,776 | 90,277 | isorenieratene | terpene | 100% |
| Region 8.2 | terpene | 227,330 | 248,343 | albaflavenone | terpene | 100% |
| Region 3.1 | terpene | 232,223 | 258,904 | hopene | terpene | 92% |
| Region 9.2 | terpene | 221,324 | 243,489 | geosmin | terpene | 100% |
| Region 17.2 | terpene | 157,127 | 178,023 | CC-1065 | other | 24% |
| Region 28.1 | terpene | 3,613 | 24,626 | A23187 calcimycin | polyketide | 10% |
| Region 31.1 | terpene | 11,837 | 32,925 | rustmicin | polyketide: iterative type I | 10% |
| Region 2.1 | ectoine | 76,359 | 86,757 | ectoine | other | 100% |
| Region 3.2 | NRPS | 364,532 | 415,460 | coelichelin | NRP | 100% |
| Region 36.1 | NRPS | 1 | 35,822 | (2S,6R)-diamino-(5R,7)-dihydroxy-heptanoic acid | NRP | 24% |
| Region 3.4 | bacteriocin, lanthipeptide | 786,397 | 813,467 | informatipeptin | RiPP: lanthipeptide | 100% |
| Region 5.1 | PKS-like, butyrolactone | 18,668 | 71,723 | ulleungmycin | NRP | 8% |
| Region 7.2 | LAP, thiopeptide | 331,828 | 365,008 | diazepinomicin | terpene | 7% |
| Region 3.5 | T1PKS, T3PKS | 874,824 | 939,794 | alkylresorcinol | polyketide | 100% |
| Region 9.4 | T1PKS | 400,230 | 434,396 | mediomiycin A | polyketide | 36% |
| Region 12.1 | T1PKS | 1 | 24,057 | argimycin PI / argimycin PII / nigrifactin / argimycin PIV / argimycin PV / argimycin PVI / argimycin PIX | polyketide: modular type I | 21% |
| Region 17.1 | T2PKS | 79,071 | 151,586 | spore pigment | polyketide | 83% |
| Region 39.1 | T2PKS | 1 | 25,935 | collinomycin | polyketide | 72% |
| Region 33.1 | T3PKS | 8,168 | 49,481 | germicidin | other | 100% |
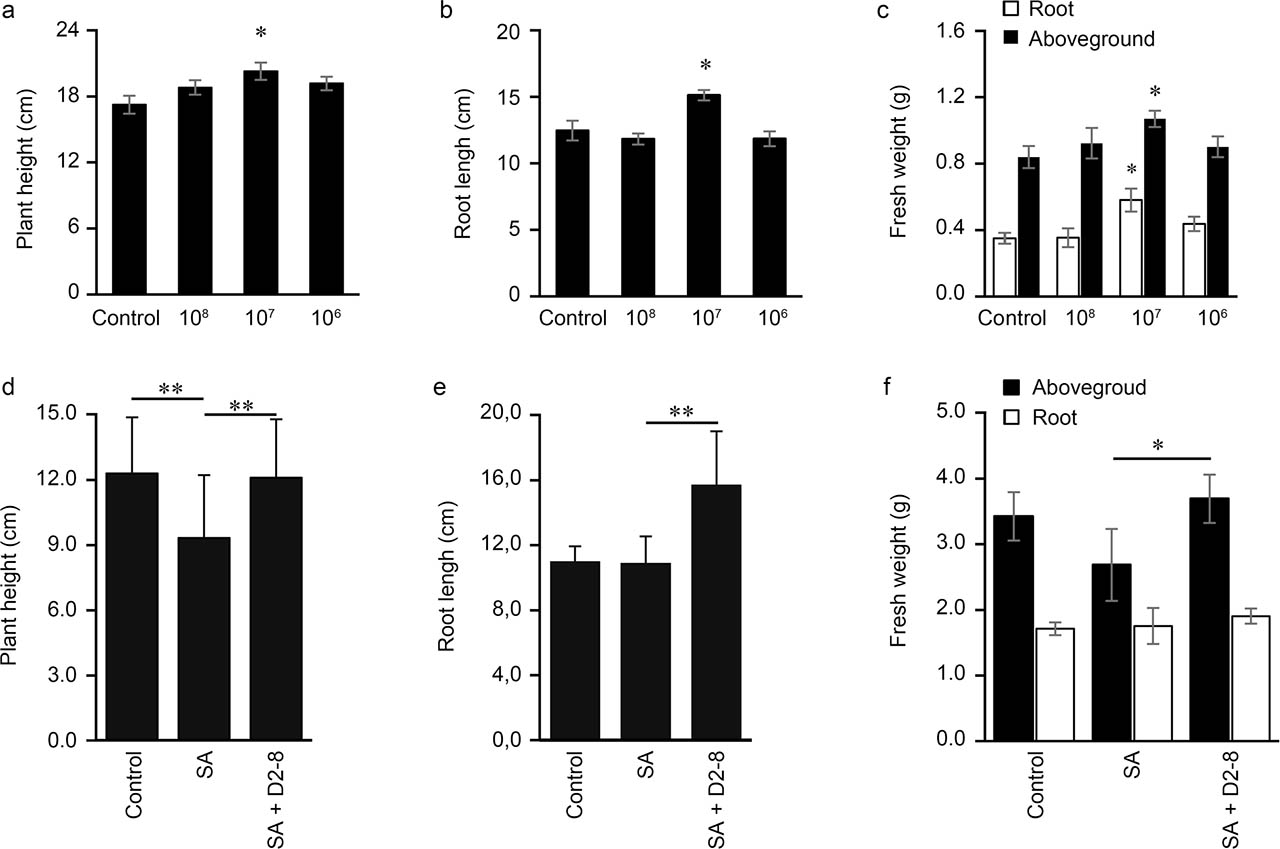
Fig. 5
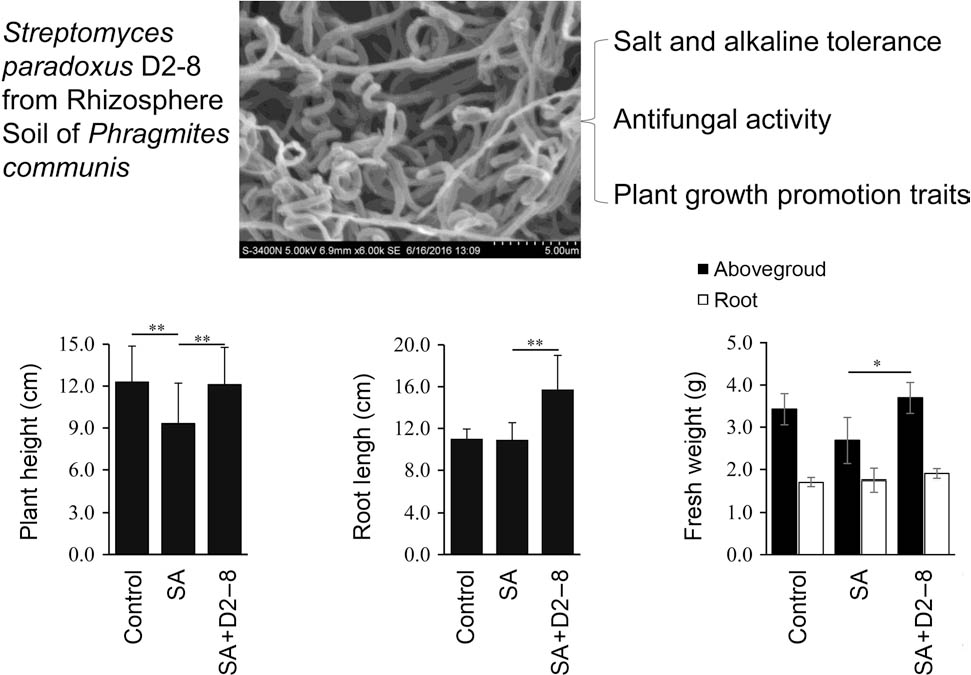
The growth promotion effect of D2-8 under normal conditions (a, b, c) and saline-alkali stress (d, e, f) on soybean. For a), b), c), control group: water treatment, 108 D2-8: the D2-8 spore concentration of 108 CFU/ml; 107 D2-8: the D2-8 spore concentration of 107 CFU/ml; 106 D2-8: the D2-8 spore concentration of 106 CFU/ml. For d), e), f), control group: normal condition, SA group: saline-alkali stress treatment, SA+D2-8: D2-8 treatment under saline-alkali stress condition; Plants height, roots length, and fresh weight of roots and aboveground were analyzed using unpaired t-tests (n = 15 plants). The symbols * and ** indicate p values 0.05 and 0.01.
Table IV
Effect of Streptomyces D2-8 on the soybean production in the field experiment.
| Treatment | Density (Ten thousand/ha) | Plant height (cm) | Number of effective sections | Pod number per plant | Grain number per plant | 100 grains weight (g) | Yield (kg/ha) |
|---|---|---|---|---|---|---|---|
| D2-8 | 33.85 ± 0.76* | 92.30 ± 4.02 | 12.40 ± 0.37 | 25.45 ± 1.75 | 55.95 ± 1.68 | 19.51 ± 0.49* | 2463.85 ± 56.36** |
| Control | 31.54 ± 1.28 | 93.95 ± 2.42 | 11.90 ± 0.35 | 24.45 ± 0.54 | 57.60 ± 2.76 | 18.73 ± 0.29 | 2327.85 ± 42.46 |