
Table I
Clinical characteristics of the patients.
| Patient age | HIV viral load (copies/ml) | CD4+ (cell/ml) | Pap cytology1 | HPV type2 |
|---|---|---|---|---|
| Group I3 | ||||
| 45 | < 50 | 744 | I and II | 90 (LR) |
| 30 | < 50 | 726 | I and II | ND |
| 23 | 5,840 | 655 | I | 11 (LR) |
| 30 | < 50 | 602 | I and II | 97 (LR) |
| 17 | 90,800 | 580 | I and II | 51 (HR) |
| 42 | < 50 | 521 | I | ND |
| 44 | < 50 | 506 | I | 66 (HR) |
| 50 | 400 | 503 | I and II | 16 (HR) |
| 35 | < 50 | 485 | I | 16 (HR) |
| 27 | < 50 | 481 | I and II | 51 (HR) |
| 37 | < 50 | 410 | IV | 51 (HR) |
| 42 | < 50 | 405 | I | 11 (LR) |
| 60 | 57 | 388 | I | 58 (HR) |
| 29 | < 50 | 380 | I and II | 70 (LR) |
| 31 | 4,940 | 364 | I and II | ND |
| Group II3 | ||||
| 35 | < 50 | 317 | I and II | ND |
| 35 | < 50 | 294 | IV | ND |
| 24 | 1,170 | 282 | I and II | ND |
| 30 | < 50 | 280 | III | 54 (LR) |
| 42 | < 50 | 258 | I and II | 102 (LR) |
| 49 | < 50 | 255 | I and II | 6 (LR) |
| 35 | < 50 | 208 | I | 84 (LR) |
| 32 | 369 | 180 | I | 51(HR) |
| 36 | 13,900 | 175 | I and II | 51 (HR) |
| 37 | < 50 | 161 | III | 81 (LR) |
| 28 | 67 | 160 | I and II | ND |
| 24 | 74,620 | 146 | I and II | ND |
| 51 | < 50 | 132 | III | 51 (HR) |
| 37 | 73 | 127 | IV | 81 (LR) |
| 48 | 5560 | 104 | I and II | 6 (LR) |
| 43 | < 50 | 103 | I and II | 86 (LR) |
| 37 | ND | 102 | I | 56 (HR) |
| 31 | < 50 | 76 | III | 52 (HR) |
| 23 | > 100,000 | 70 | I and II | 6 (LR) |
| 34 | 822 | 65 | III | 58 (HR) |
| 63 | 451 | 63 | I and II | ND |
| 44 | 5,140 | 60 | I and II | 51 (HR) |
| 25 | 95200 | 30 | I and II | 81 (LR) |
| 41 | ND | 22 | III | 33(HR) |
| 31 | > 100,000 | 16 | I and II | 70 (LR) |
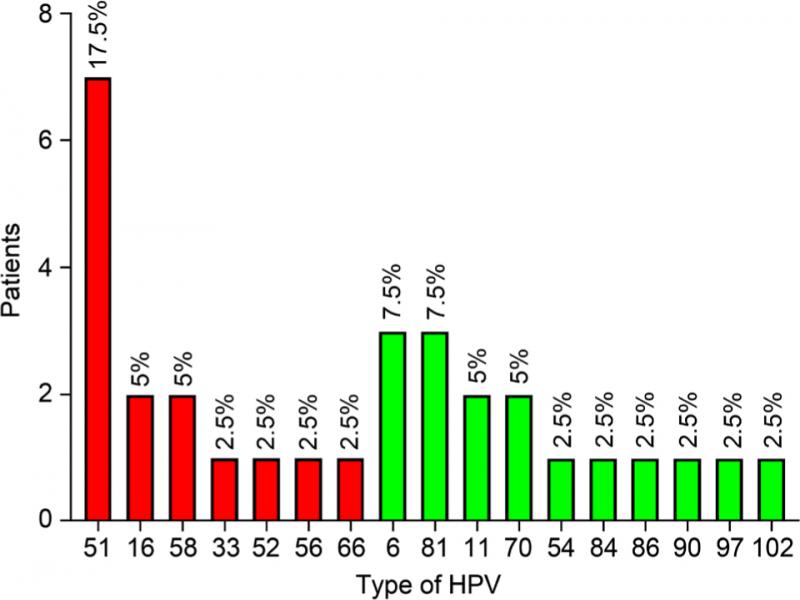
Fig. 1.
HPV genotype frequency detected by PCR. Red bars – HR-HPV types, green bars – LR-HPV.
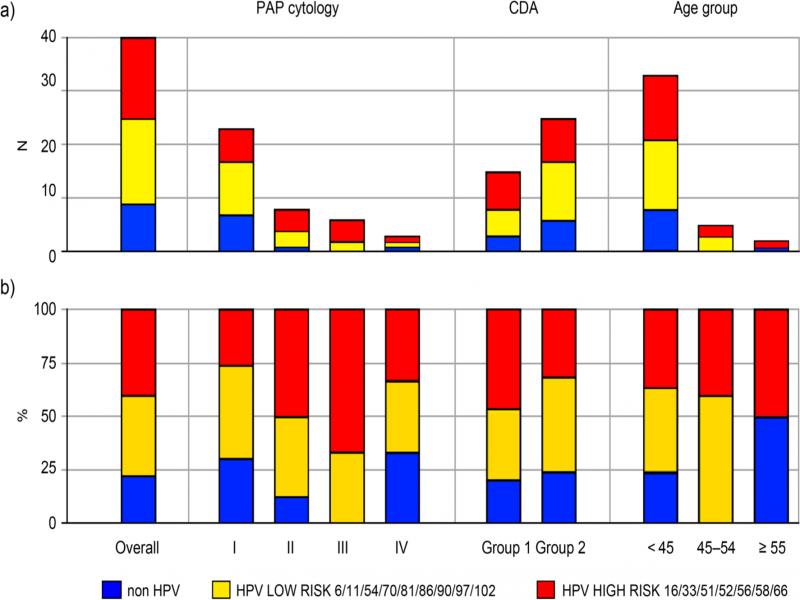
Fig. 2.
Frequency of HPV types. a) Raw data, b) calculated percentage. Age was classified into three groups: < 45, 45–54, ≥ 55 years.
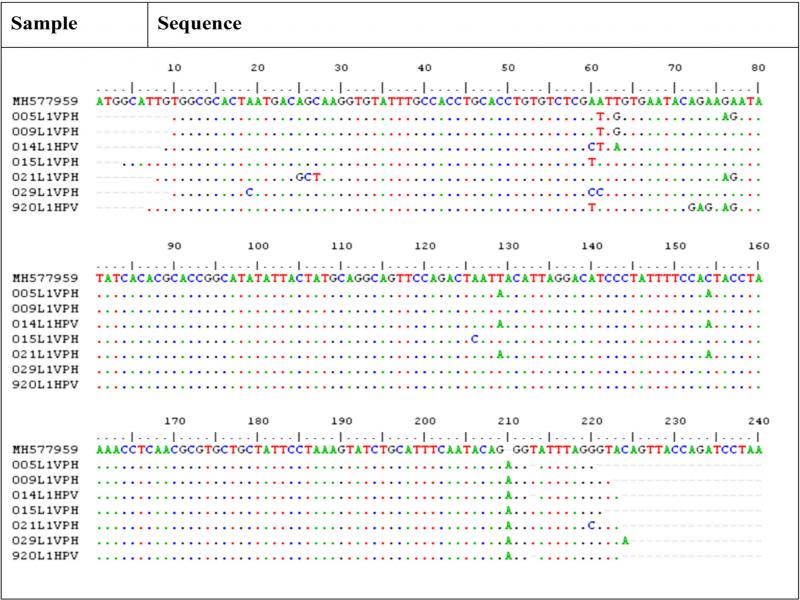
Fig. 3.
Comparison of nucleotide sequences of the L1 gene of HPV51 from clinical samples. The figure shows nucleotide sequences of seven HPV51-positive clinical isolates. The reference sequence is at the top. The nucleotides from the clinical samples that were homologous to the reference sequence are shown as points. Capital letters indicate differences concerning the reference sequence. Sequence alignment was performed using ClustalW multiple alignment software v1.4.
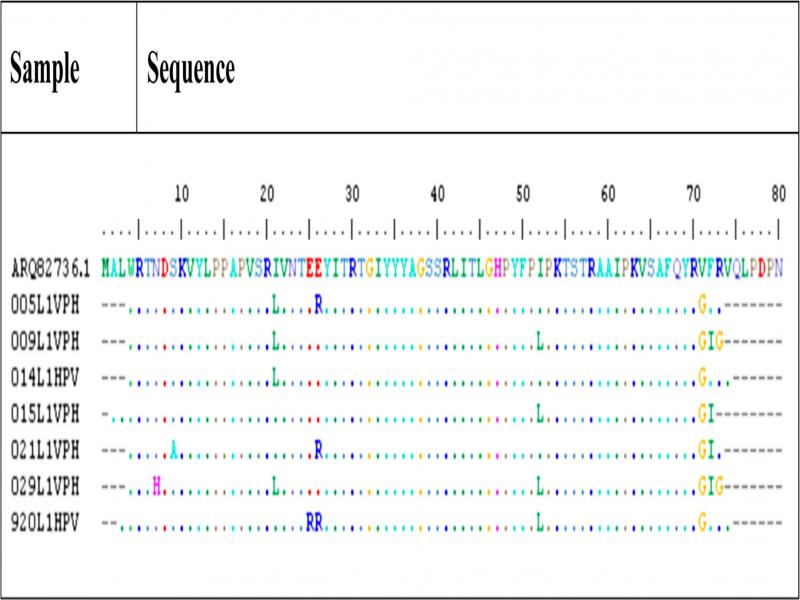
Fig. 4.
Comparison of amino acid sequences of the L1 gene of HPV51 from clinical samples. The figure shows amino acids sequences of seven HPV51-positive clinical isolates. The reference sequence is at the top. The amino acids from the clinical samples that were homologous to the reference sequence are shown as points. Capital letters indicate differences with respect to the reference sequence. Sequence alignment was performed using ClustalW multiple alignment software v1.4.
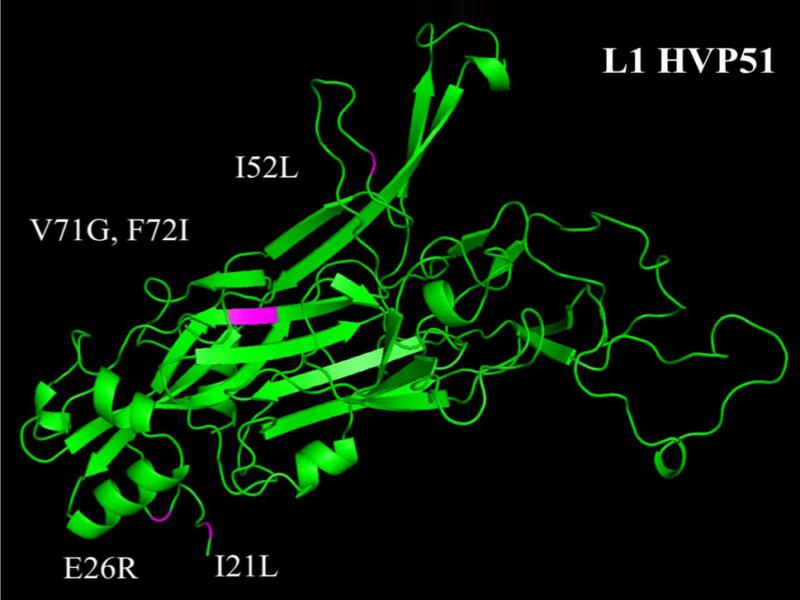
Fig. 5.
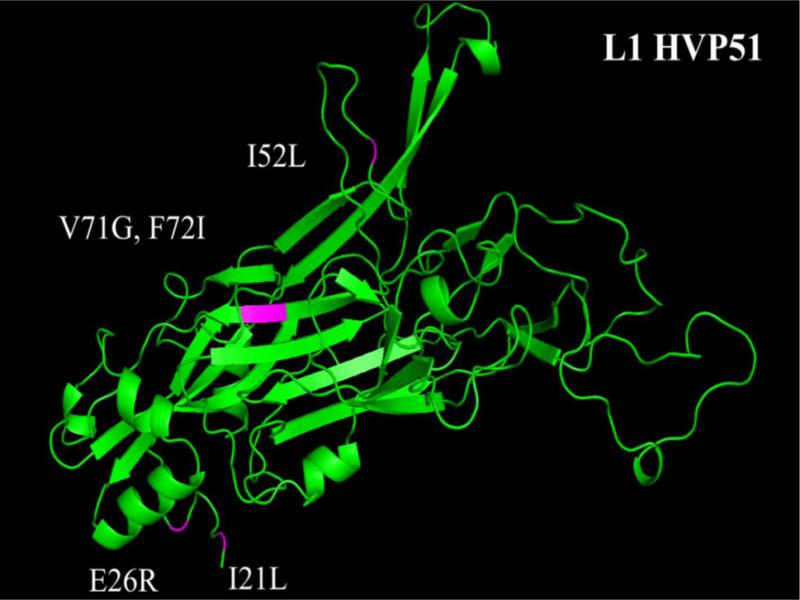
The L1 monomer of HPV51. The I21L, E26R, I52L, V71G, and F72I mutations are highlighted in magenta.