
Table I
The primers used in the study.
| Primer name | Primer sequence (5’->3’) | Target gene/DNA fragment | Product size (bp) |
|---|---|---|---|
| R1 | TCTATGACAAGGATGAAGCC | pKD46 | 1,046 |
| R2 | GTATTTCCCGGCCTTTCTGT | ||
| R3 | ACTACGCCTGAAGGTGGCAACGGACCAAATATACAGGGATGTAACGCTATTAGAGCCTCTCAAAGCAAT | pKD3 | 1,198 |
| R4 | TCTATAAAAAAGCAGCACACTGTATTATACGTTAATTATGAGCCACAACGGTCTTGAGCGATTGTGTAGG | ||
| R5 | ACAACTCAAAGGAAAAGGAC | pCP20 | 1,202 |
| R6 | CACCAAAAACTCGTAAAAGC | ||
| R7 | GACCAAATTATACAGGGATGT | ST-ΔSTM0859cat/ST-SL1344 | 220/1,146 |
| R8 | ATACGTTAATTATGAGCCACA | ||
| R9 | GGAATTCATGCACTTTGATATAAAAGATTTA | STM0859 | 905 |
| R10 | CCTCGAGTCACTCAGTCTGAGCTGTGAG | ||
| rcsB F | AAAATGCCGGATGGCGG | rcsB promoter | 102 |
| rcsB R | TCGCTTTTATGTTACCCAGCC | ||
| 16s RNA F | GCGGTAATACGGAGGGTG | 16s RNA | 167 |
| 16s RNA R | CACCGCTACACCTGGAAT | ||
| rcsB F | AGCGTCATTTTCCGAGC | rcs B | 193 |
| rcsB R | TCCAGCAGACGAGAAACG | ||
| rpoS F | GGTGGATTCGCCAGACAA | rpoS | 132 |
| rpoS R | CGTGGTCCAGTTTATGCG | ||
| Fur F | TTTTCCGCAATCAAGGC | Fur | 158 |
| Fur R | TGGGTGAAGAAATCGGTC |
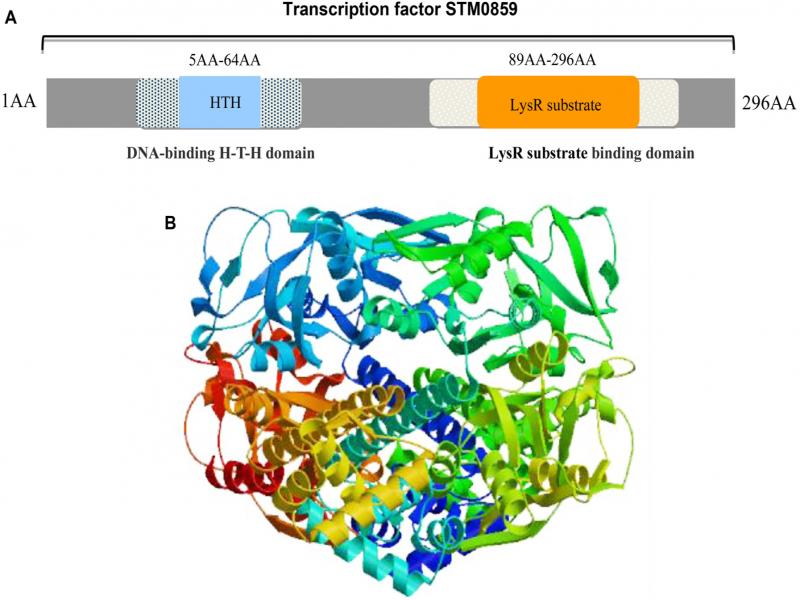
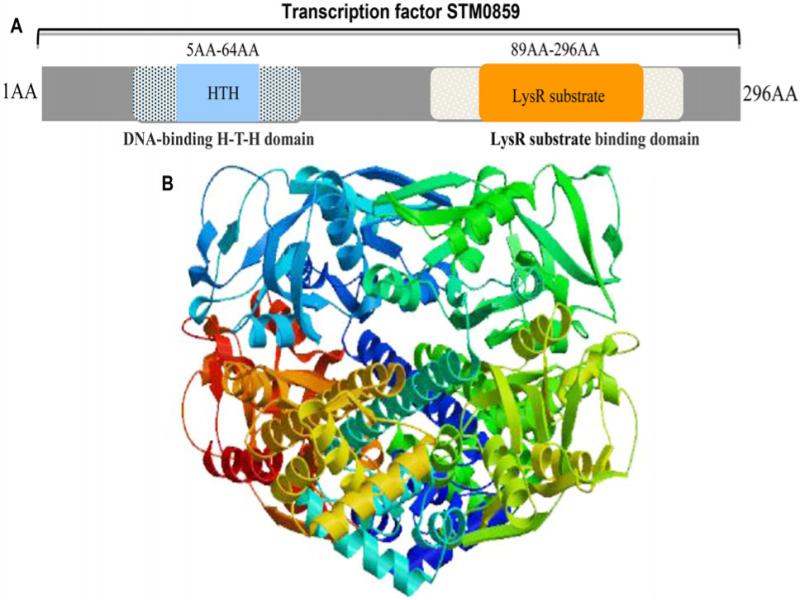
Fig. 1.
Molecular characteristics of STM0859 of Salmonella Typhimurium; A) the H-T-H DNA binding and LysR substrate binding domains in STM0859 protein, B) prediction of 3D structure model of STM0859 protein.
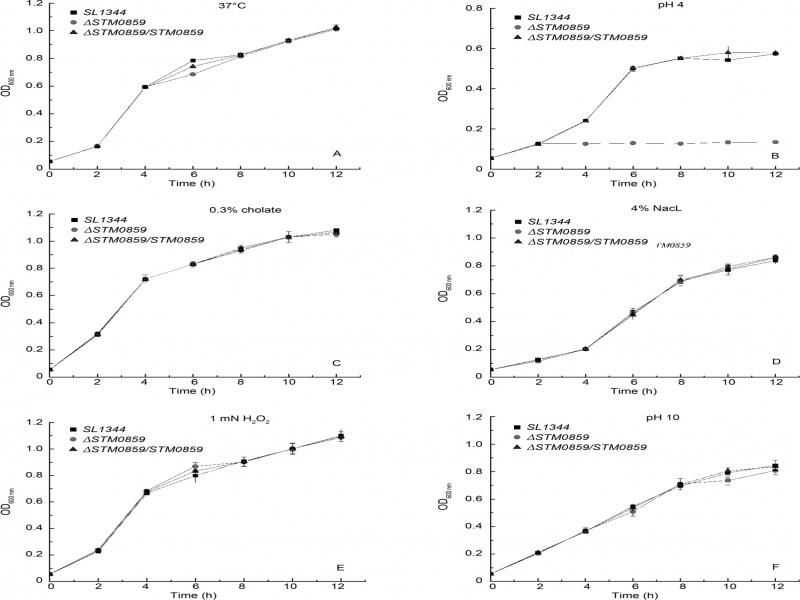
Fig. 2.
Growth curves of SL1344, ΔSTM0859 and ΔSTM0859/STM0859 under different conditions; A-F) growth curves of SL1344, ΔSTM0859 and ΔSTM0859/STM0859 at 37°C, pH 4, 0.3% cholate, 4% NaCl, 1 mM H2O2 and pH 10, respectively.
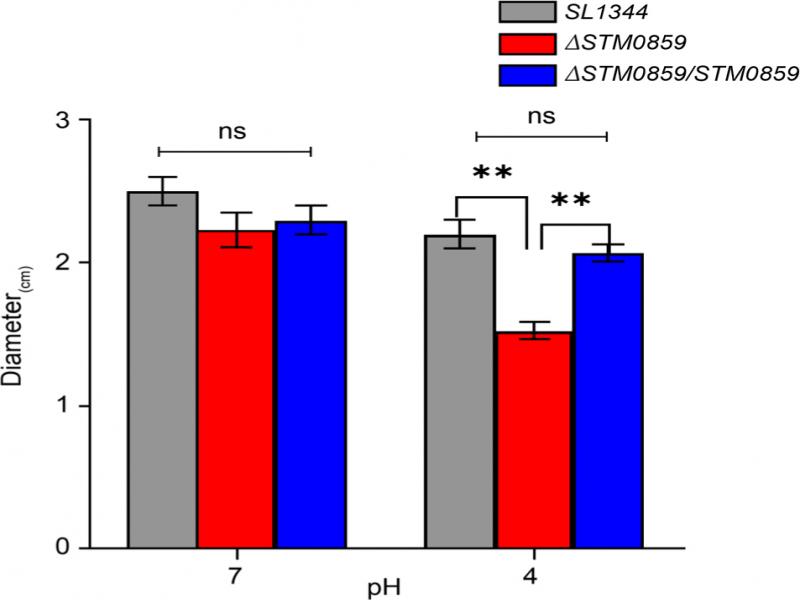
Fig. 3.
Assay of motility of SL1344, ΔSTM0859 and ΔSTM0859/STM0859 in semi-solid medium with different pH; ns – not significant, while ** – p < 0.01.
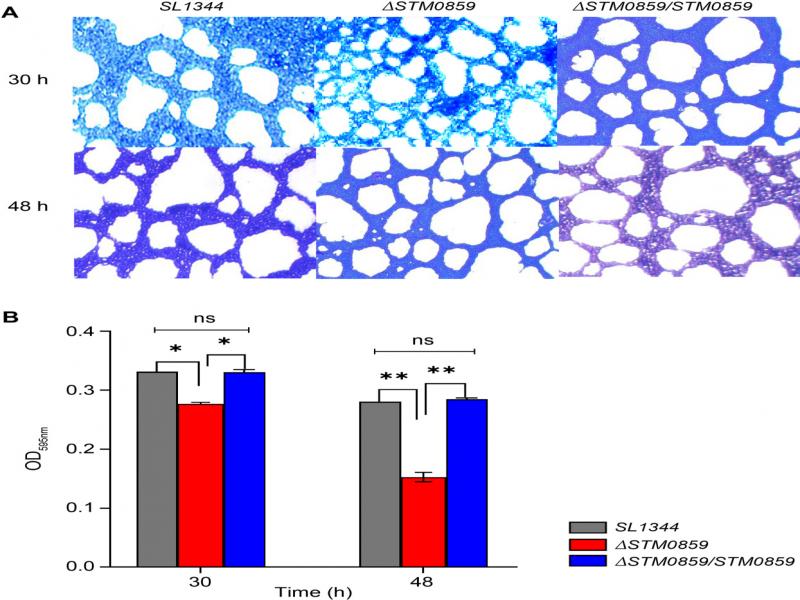
Fig. 4.
Determination of formatting capability of biofilm of SL1344, ΔSTM0859 and ΔSTM0859/STM0859; A) formation of biofilm by SL1344, ΔSTM0859 and ΔSTM0859/STM0859 at 30 h, and 48 h, respectively; B) biofilm of SL1344, ΔSTM0859 and ΔSTM0859/STM0859 biofilm determined by OD595 nm at 30 h, and 48 h, respectively; ns – not significant, * – p < 0.05, while ** – p < 0.01.
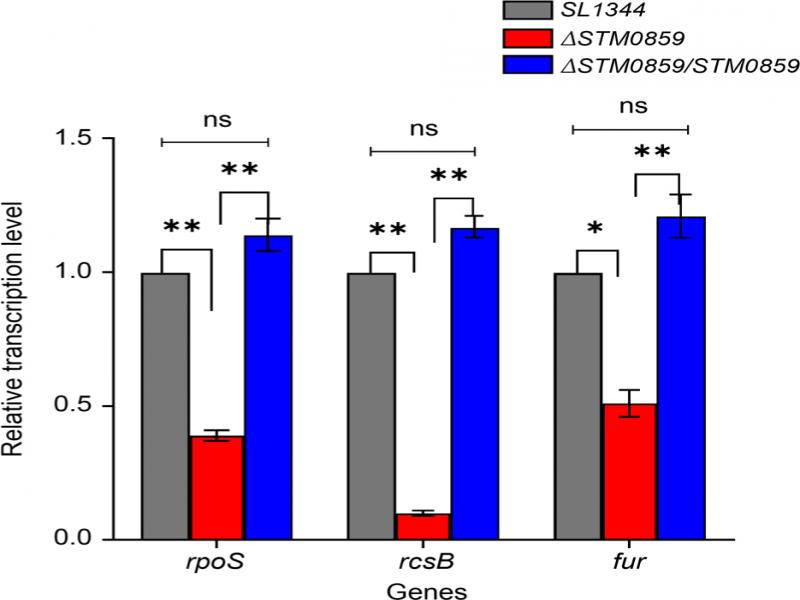
Fig. 5.
Determination of the relative transcriptional levels of rpoS, rcsB and fur gene; ns – indicates not significant, * – p < 0.05, while ** – p < 0.01.
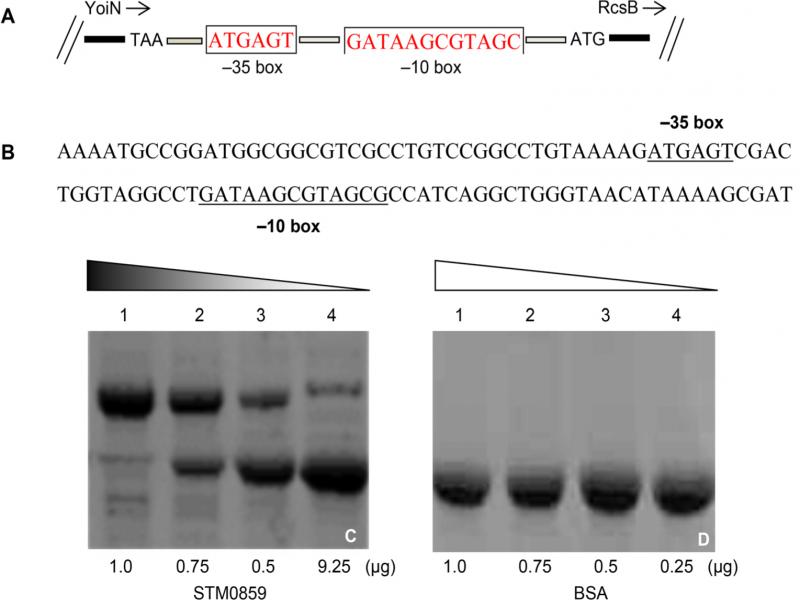
Fig. 6.
Analysis of the interaction between STM0859 and the promoter sequence of rcsB gene using EMSA; A) the relevant features and localization in genomic DNA of ST, B) the promoter sequence of rcsB gene used in this study, C) interaction between STM0859 and the promoter of rcsB gene, D) interaction between BSA and the promoter of rcsB gene (negative control).