
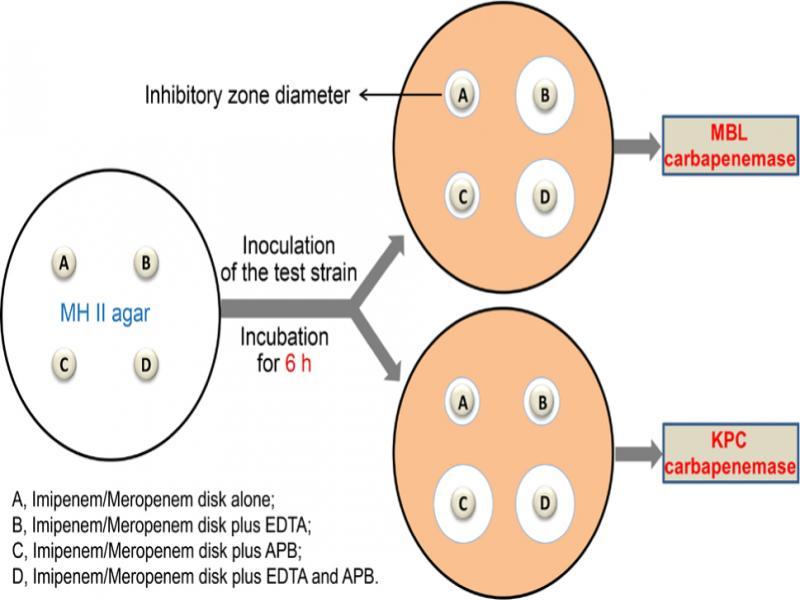
Fig. 1.
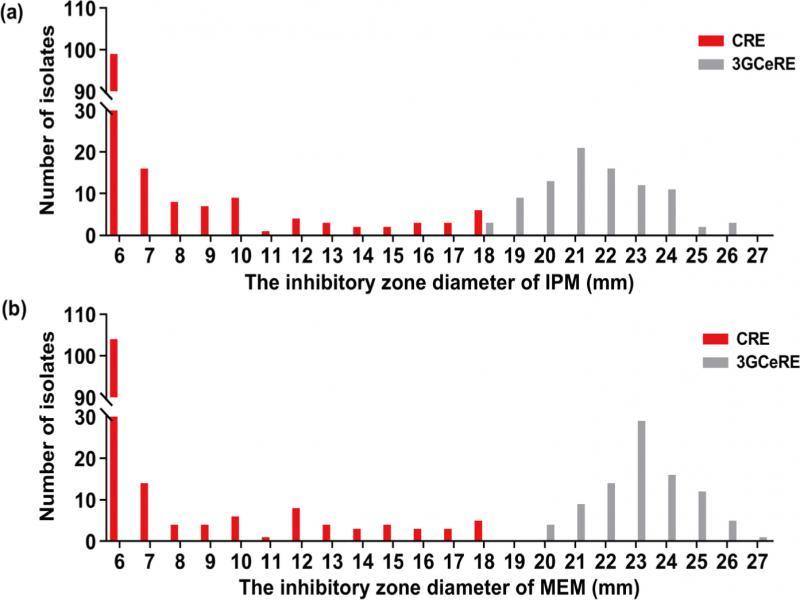
Fig. 2.
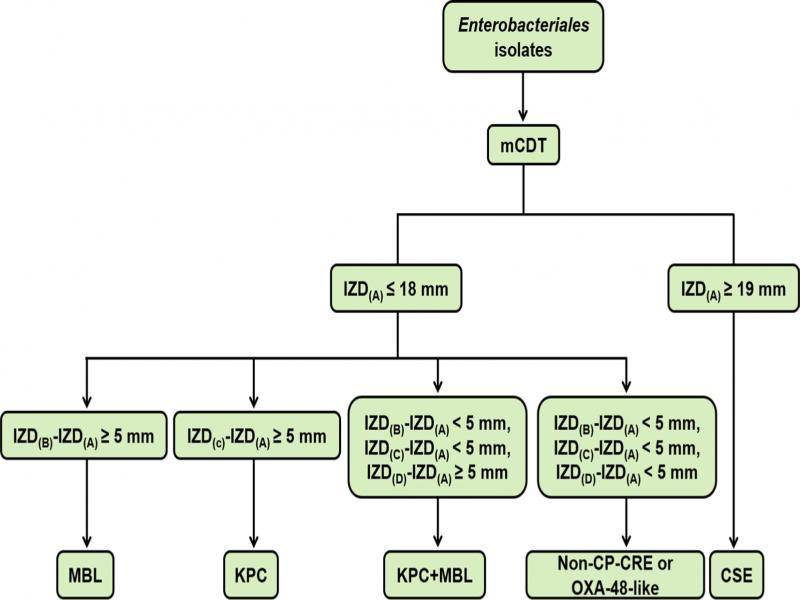
Fig. 3.
Species distribution of different carbapenemase types among non-CP-CRE and 3GCeRE isolates_
| Category (n) | Species | |||||||
|---|---|---|---|---|---|---|---|---|
| Kpn | Eco | Ecl | Kae | Cfr | Pre | Pmi | Sma | |
| KPC (107) | 104 | 1 | 0 | 1 | 1 | 0 | 0 | 0 |
| MBL (36) | ||||||||
| NDM (30) | 7 | 15 | 1 | 0 | 1 | 4 | 1 | 1 |
| IMP (6) | 3 | 0 | 3 | 0 | 0 | 0 | 0 | 0 |
| OXA-48-like (1) | 1 | 0 | 0 | 0 | 0 | 0 | 0 | 0 |
| KPC+NDM (1) | 1 | 0 | 0 | 0 | 0 | 0 | 0 | 0 |
| Non-CP-CRE (18) | 8 | 5 | 2 | 3 | 0 | 0 | 0 | 0 |
| 3GCeRE (90) | 17 | 47 | 7 | 10 | 2 | 1 | 4 | 2 |
| Total (253) | 141 | 68 | 13 | 14 | 4 | 5 | 5 | 3 |
Accuracy of detecting KPC or MBL carbapenemases among 163 CRE isolates under different conditions_
| Category | Carbapenemase | Accuracy | |
|---|---|---|---|
| Sensitivity (%), (95% CI) | Specificity (%), (95% CI) | ||
| IPM-5 μ APB | KPC | 88.8 (80.9-93.8) | 100 (92.0-100) |
| IPM-5 μ EDTA | MBL | 100 (88.0-100) | 100 (96.3-100) |
| IPM-10 μ APB | KPC | 97.2 (91.4-99.3) | 100 (92.0-100) |
| IPM-10 μ EDTA | MBL | 100 (88.0-100) | 100 (96.3-100) |
| MEM-5 μ APB | KPC | 48.6 (38.9-58.4) | 100 (92.0-100) |
| MEM-5 μ EDTA | MBL | 100 (88.0-100) | 100 (96.3-100) |
| MEM-10 μ APB | KPC | 59.8 (49.9-69.0) | 100 (92.0-100) |
| MEM-10 μ EDTA | MBL | 100 (88.0-100) | 100 (96.3-100) |