
Table I
Characteristics of eleven Actinomycetes strains.
| Symbol of isolate | Pigmentation | Opacity of colony | Colony consistency | Growth under the surface of liquid media |
|---|---|---|---|---|
| Streptomyces griseorubens strain HM1 (Actino1) | Brown | Opaque | Rough | Sediment of balls |
| Streptomyces sp. strain HM2 (Actino2) | White | Opaque | Rough | Sediment of balls |
| Streptomyces thinghirensis strain HM3 (Actino4) | Yellow* | Opaque | Rough | Sediment of balls |
| Streptomyces sp. strain HM4 (Actino5) | Yellow | Opaque | Rough | Sediment of balls |
| Actino7 | Red | Opaque | Rough | Sediment of balls |
| Streptomyces sp. strain HM6 (Actino8) | Cream | Opaque | Rough | Sediment of balls |
| Streptomyces panayensis strain HM7 (Actino9) | Cream | Opaque | Rough | Sediment of balls |
| Streptomyces sp. strain HM8 (Actino MS9) | Dark brown | Opaque | Rough | Sediment of balls |
| Actino10 | Cream light pink | Opaque | Rough | Sediment of balls |
| Actino11 | Cream | Opaque | Rough | Sediment of balls |
| Streptomyces tricolor strain HM10 (Actino12) | Yellow** | Opaque | Rough | Sediment of balls |
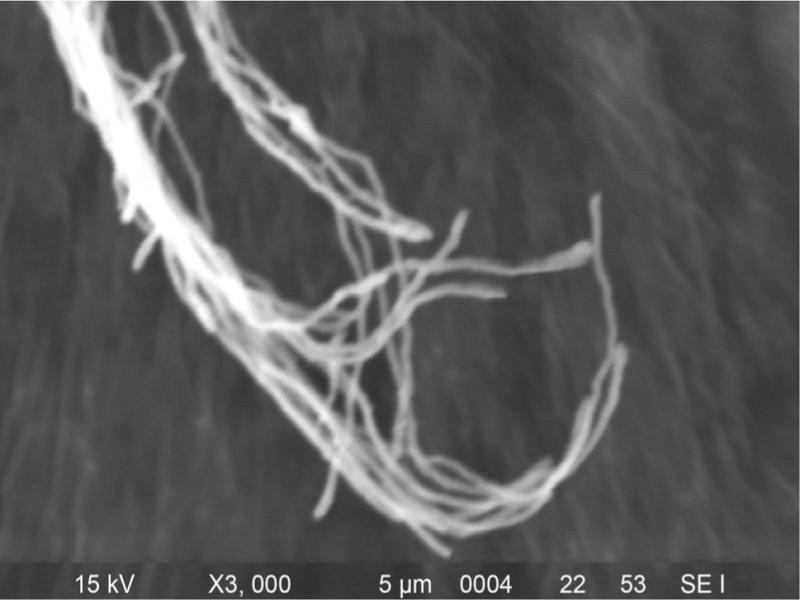
Fig. 1.
Scanning electron microscopy of Streptomyces tricolor strain HM10 hyphae grown on GSA medium.
Table II
Identified Streptomyces strains via 16S rRNA amplicon sequencing and their similarity with identified strains at the NCBI website.
| No. | The isolated strain | Streptomyces similar strain | Similarity (%) |
|---|---|---|---|
| 1 | Streptomyces griseorubens strain HM1 (Actino1) | Streptomyces griseorubens strain SELJFHG3 | 99.46 |
| 2 | Streptomyces sp. strain HM2 (Actino2) | Streptomyces sp. SYP-A7193 | 99.85 |
| 3 | Streptomyces thinghirensis strain HM3 (Actino4) | Streptomyces thinghirensis strain TG26 | 99.62 |
| 4 | Streptomyces sp. strain HM4 (Actino5) | Streptomyces sp. E4N275g | 99.46 |
| 5 | Streptomyces sp. strain HM6 (Actino8) | Streptomyces sp. SYP-A7193 | 99.23 |
| 6 | Streptomyces panayensis strain HM7 (Actino9) | Streptomyces panayensis | 99.54 |
| 7 | Streptomyces sp. strain HM8 (ActinoMS9) | Streptomyces sp. strain 16K303 | 99.46 |
| 8 | Streptomyces tricolor strain HM10 (Actino12) | Streptomyces tricolor strain AS 4.1867 | 99.77 |
Table III
Antagonism of eight identified Streptomyces strains against ten different plant pathogenic fungi.
| Isolates | Tested Fungi* | ||||||||||
|---|---|---|---|---|---|---|---|---|---|---|---|
| F. mon | F. so | F. ox | F. gra | Collet | Bot | Alt | Rhiz | Myro | Thiel | Total | |
| Streptomyces griseorubens strain HM1 | – | – | +++ 3 mm | – | – | – | – | – | – | – | 1 |
| Streptomyces sp. strain HM2 | – | – | – | – | – | – | – | – | – | – | 0 |
| Streptomyces thinghirensis strain HM3 | +++ 5 mm | +++ 9 mm | +++ 8 mm | +++ 8 mm | +++ 8 mm | +++ 15 mm | +++ 12 mm | +++ 11 mm | +++ 3 mm | +++ 7.5 mm | 10 |
| Streptomyces sp. strain HM4 | – | – | – | – | +++ 7 mm | +++ 5 mm | +++ 4 mm | +++ 2 mm | – | – | 4 |
| Actino7 | + | +++ 3 mm | + | +++ 5 mm | – | +++ 9 mm | +++ 1 mm | +++ 2 mm | +++ 10 mm | +++ 3 mm | 5 |
| Streptomyces sp. strain HM6 | – | – | – | – | – | – | – | – | – | – | 0 |
| Streptomyces panayensis strain HM7 | – | – | – | – | – | – | – | – | – | – | 0 |
| Streptomyces sp. strain HM8 | – | – | – | – | – | – | – | – | – | – | 0 |
| Actino10 | – | – | – | +++ 11 mm | +++ 1 mm | – | +++ 3 mm | – | – | – | 3 |
| Actino11 | – | – | – | – | – | – | – | – | – | – | 0 |
| Streptomyces tricolor strain HM10 | +++ 11 mm | +++ 12 mm | +++ 13 mm | +++ 11 mm | +++ 18 mm | +++ 16 mm | +++ 8 mm | +++ 1 mm | +++ 13 mm | +++ 16 m | 10 |
| Total | 3 | 3 | 4 | 3 | 4 | 3 | 5 | 3 | 2 | 3 | |
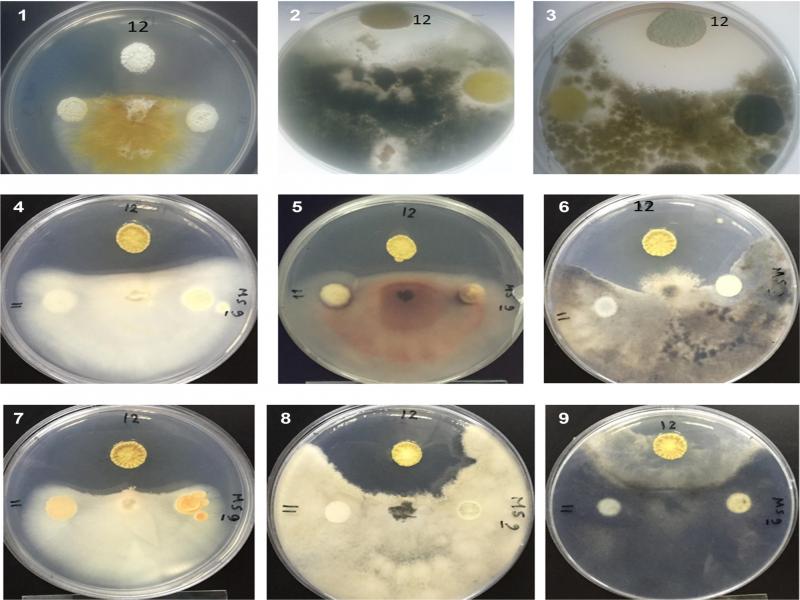
Fig. 2.
Antagonistic activity of Streptomyces tricolor HM10 against nine fungi including: 1 – Fusarium graminearum, 2 – Thielaviopsis basicola, 3 – Colletotrichum gloeosporides, 4 – Fusarium oxysporum, 5 – Fusarium moniliforme, 6 – Botrytis cinerea, 7 – Fusarium solani, 8 – Rhizoctonia solani, 9 – Alternaria solani.
Table IV
The antagonism effect of eight identified Streptomyces strains against three bacterial strains.
| Isolates | Pseudomonas putida | Escherichia coli | Bacillus subtilis | Total |
|---|---|---|---|---|
| Streptomyces griseorubens strain HM1 | + 3 mm | – | – | 1 |
| Streptomyces sp. strain HM2 | – | – | – | 1 |
| Streptomyces thinghirensis strain HM3 | – | + 12 mm | Trace 3 mm | 2 |
| Streptomyces sp. strain HM4 | – | – | – | 0 |
| Streptomyces sp. strain HM6 | – | – | – | 0 |
| Streptomyces panayensis strain HM7 | – | – | – | 0 |
| Streptomyces sp. strain HM8 | – | – | – | 0 |
| Streptomyces tricolor strain HM10 | – | – | – | 0 |
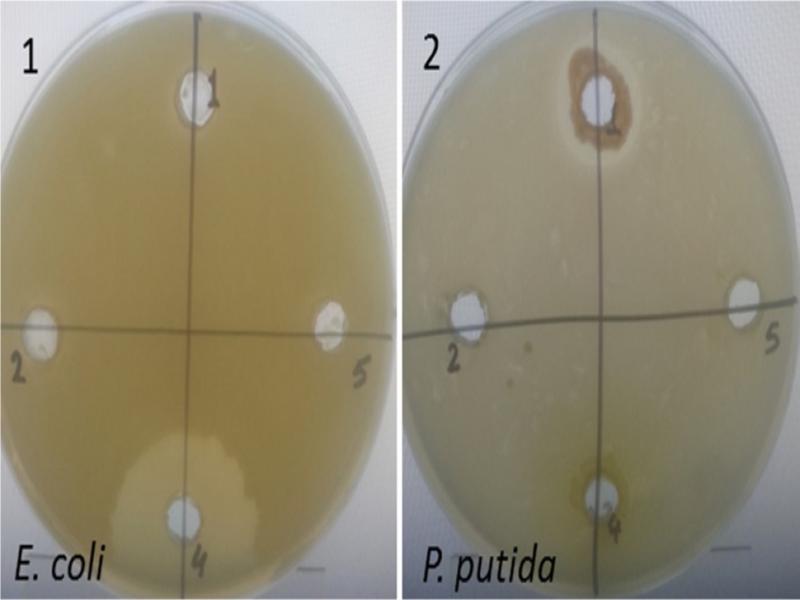
Fig. 3.
Antibacterial activity of some selected isolated Streptomyces against two Gram-negative bacteria, Escherichia coli and Pseudomonas putida.
Table V
The production of siderophores, extracellular indole-3-acetic acid (IAA) and phosphor fixing of eleven isolated Streptomyces strains.
| Isolate | Iron1 | Phosphor2 | IAA3 µg/ml | |||
|---|---|---|---|---|---|---|
| Reaction | Width | D/D colony | h/c | |||
| Streptomyces griseorubens strain HM1 | ++ | 2 mm | 9.5/5.5 | 1.98 | + | 77.19 |
| Streptomyces sp. strain HM2 | ++ | 1.5 mm | 10.1/7.5 | 2.15 | + | 89.36 |
| Streptomyces thinghirensis strain HM3 | + | 1 mm | 11/8 | 1.67 | Trace | 86.66 |
| Streptomyces sp. strain HM4 | ++ | 2.5 mm | 11/5.5 | 3.36 | – | 72.26 |
| Actino7 | +++ | 5 mm | 16.5/8 | 4.25 | – | 112.96 |
| Streptomyces sp. strain HM6 | ++ | 2 mm | 11.5/7.5 | 2.35 | – | 43.65 |
| Streptomyces panayensis strain HM7 | +++ | 5 mm | 14/4 | 12.25 | + | 99.3 |
| Streptomyces sp. strain HM8 | +++ | 11 mm | 24/3 | 64 | Trace | 75.6 |
| Actino10 | +++ | 10 mm | 25.5/4.5 | 32.1 | + | 172.13 |
| Actino11 | +++ | 9 mm | 20/3.5 | 32.65 | – | 270.33 |
| Streptomyces tricolor strain HM10 | +++ | 11.5 mm | 28.5/6 | 22.56 | + | 273.02 |
51 – + A thin yellow area surrounding the colony (about 1 mm width), ++ less than 5 mm width of the yellow area surrounding the colony, +++ more than 5 mm width of the yellow area surrounding the colony, D = diameter, h/c = halo zone area/colony area
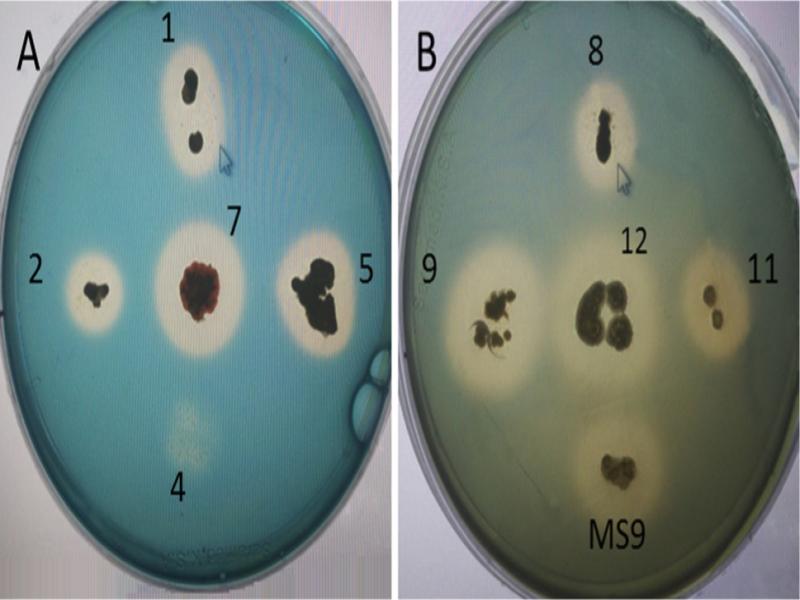
Fig. 4.
Iron cheating of isolated eleven Streptomyces strains in the CAS general assay to detect siderophore production according to (Schwyn and Neilands 1987).
Table VI
Effects of Streptomyces tricolor HM10 and Streptomyces thinghirensis strain HM3 crude extracts on the viability of A549 cancer cells. Treated versus untreated cells (p > 0.05).
| Streptomyces thinghirensis HM3 (μg/ml) | % Cells Viability (Mean + SD) | Streptomyces tricolor strain HM10 (μg/ml) | Cells Viability (%) (Mean ± SD) |
|---|---|---|---|
| Untreated cells | 98.3 ± 8.2 | Untreated cells | 99.1 ± 6.1 |
| 20 | 98.2 ± 9.2 | 20 | 99.2 ± 5.5 |
| 40 | 97.4 ± 6.8 | 40 | 98.3 ± 6.6 |
| 60 | 98.5 ± 7.3 | 60 | 97.1 ± 4.6 |
| 80 | 97.3 ± 9.6 | 80 | 98.2 ± 7.3 |
| 100 | 96.2 ± 9.1 | 100 | 98.3 ± 8.8 |
| 120 | 98.4 ± 7.2 | 120 | 97.7 ± 9.5 |
| 140 | 98.8 ± 9.5 | 140 | 99.1 ± 6.4 |
| 160 | 96.2 ± 9.1 | 160 | 98.2 ± 7.2 |
| 180 | 98.2 ± 8.2 | 180 | 97.1 ± 7.3 |
| 200 | 97.1 ± 8.5 | 200 | 98.3 ± 9.5 |
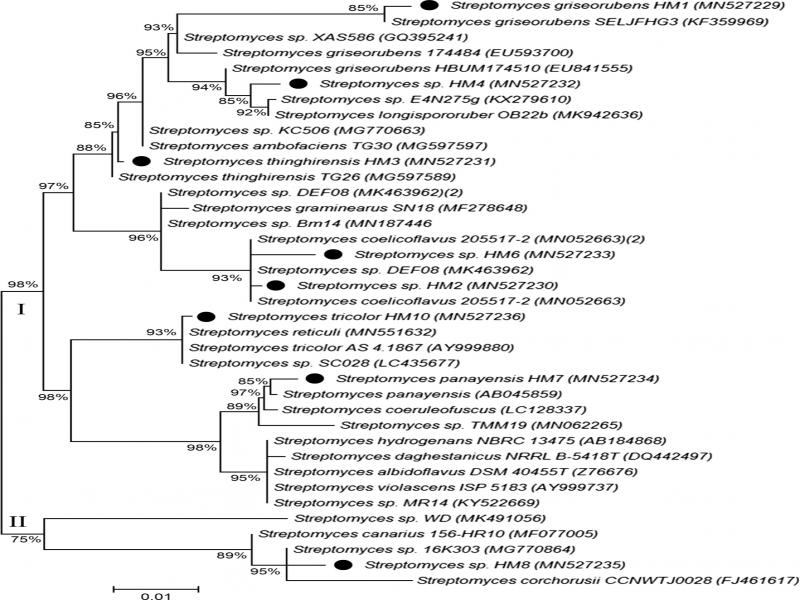
Fig. 5.
Phylogenetic tree based on 16S rRNA sequences. The evolutionary history was inferred by using the Maximum Likelihood method and Tamura-Nei model. The tree with the highest log likelihood (–4351.16) is shown. Initial tree for the heuristic search were obtained automatically by applying the Maximum Parsimony method. This analysis involved 38 nucleotide sequences. Evolutionary analyses were conducted in MEGA X.