
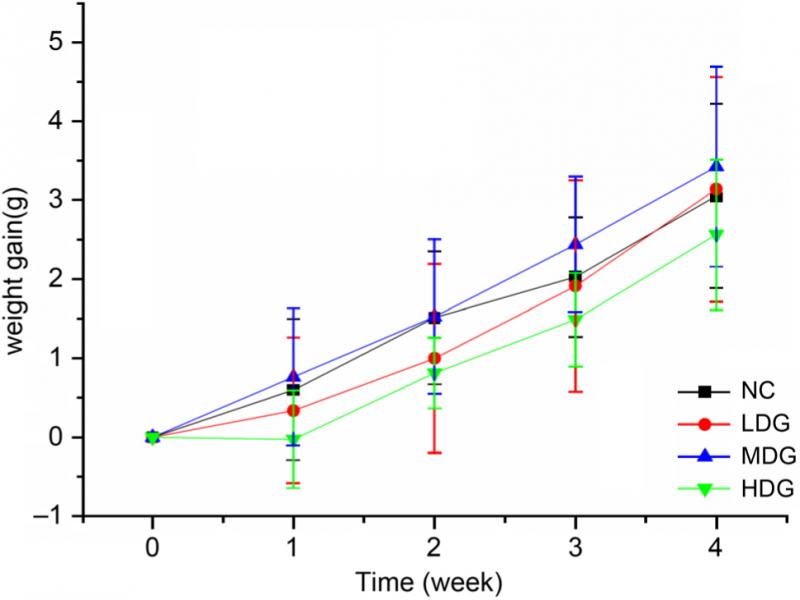
Fig. 1.
Body weight variations of the mice after L. plantarum BW2013 gavage. The data are represented as mean ± SD.
NC – control group, LDG – low-dose group, MDG – medium-dose group, HDG – high-dose group.
Table I
The α diversity index of gut microbiota in each group.
| Group | Observed species | Shannon | Simpson | Chao1 | ACE | Goods coverage |
|---|---|---|---|---|---|---|
| IS | 532 | 6.566 | 0.971 | 534.371 | 540.911 | 0.999 |
| NC | 535.6 | 6.433 | 0.968 | 538.985 | 545.437 | 0.999 |
| LDG | 559 | 6.622 | 0.976 | 563.100 | 570.366 | 0.999 |
| MDG | 580 | 6.728 | 0.978 | 582.440 | 588.671 | 0.999 |
| HDG | 584.8 | 6.640 | 0.971 | 616.129 | 619.041 | 0.999 |
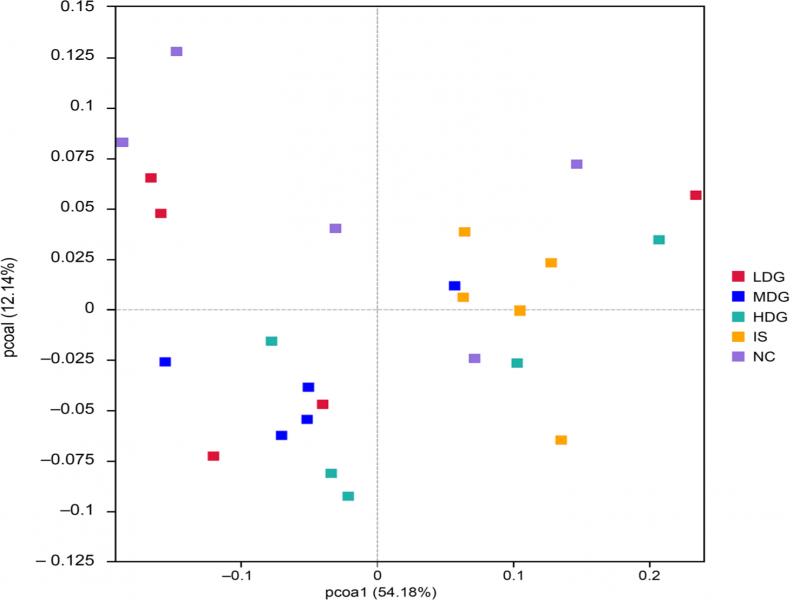
Fig. 2.
Principal co-ordinates analysis (PCoA) of the microbial communities of different groups. Initial state (IS) stands for mice before intragastric administration.
NC – control group, LDG – low-dose group, MDG – medium-dose group, HDG – high-dose group.
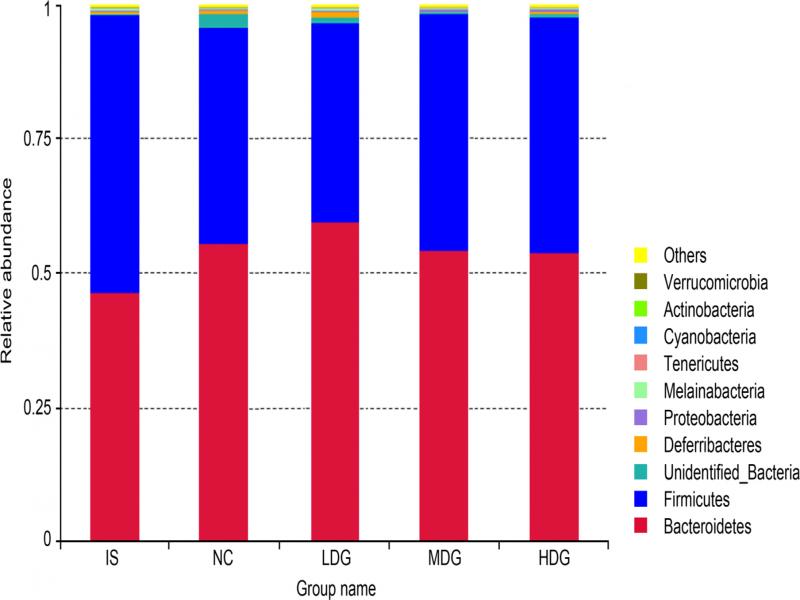
Fig. 3.
Microbial community bar plot at the phylum level. Initial state (IS) stands for mice before intragastric administration.
NC – control group, LDG – low-dose group, MDG – medium-dose group, HDG – high-dose group.
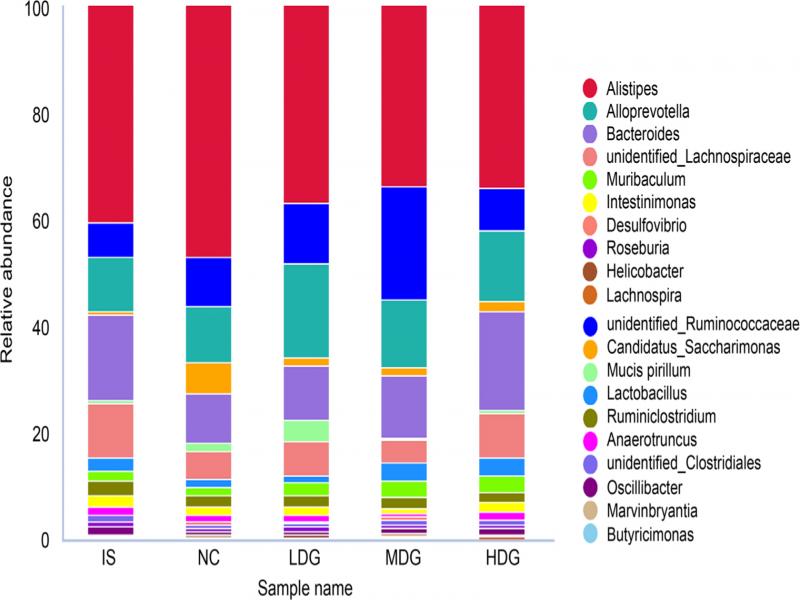
Fig. 4.
Microbial community bar plot at the genus level. Initial state (IS) stands for mice before intragastric administration.
NC – control group, LDG – low-dose group, MDG – medium-dose group, HDG – high-dose group.
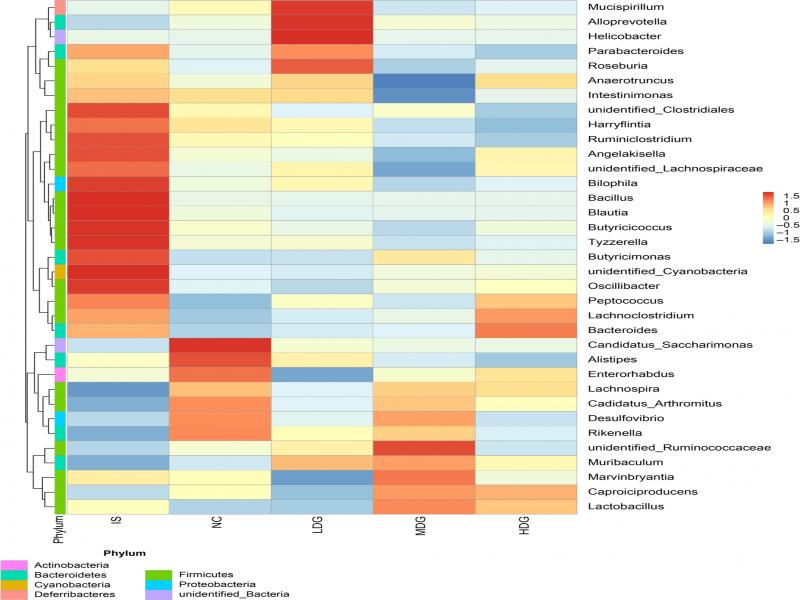
Fig. 5.
Heat map analysis of the gut microbiota at the phylum and genus levels. Initial state (IS) stands for mice before intragastric administration.
NC – control group, LDG – low-dose group, MDG – medium-dose group, HDG – high-dose group.