
Introduction
Mount Jiri (hereafter referred to as Jiri) is located at the southern tip of the Sobaek Mountain ranges in the southern part of the Korean peninsula. It covers a vast area, spanning five cities, and it is the second-highest mountain (1915 m) in South Korea, with slopes of 28°–30° (Kim and Jung 2018). Jiri presents annual average temperature of 13°C and an average annual precipitation of 1,350–1,510 mm, with 69% of the rainfall concentrated between June and September (Kim and Jung 2018). Mountain streams and high marshes have developed depending on groundwater and rainfall. Such freshwater ecosystems may be geographically isolated due to weathering and erosion (Wieringa 1964; Kim and Jung 2018). Jiri has well-developed mountain marshes that can be separated and isolated by the mountain ranges or originated from separate water sources (Wieringa 1964; Kim and Jung 2018). Here, we studied three mountain marshes – Jeonglyeongchi, Waegok, and Wangdeungjae – and their different environmental factors associated with their respective microbial and microalgal communities.
Jiri’s high marshes characteristics have been influenced by topography and soil properties (Yang 2008; Kim et al. 2010). In particular, the soil of Jiri’s high marshes presents high water retention and poor permeability, allowing fresh water to flow into the wetlands (Yang 2008; Kim et al. 2010). Because of the low soil permeability, sediments around Mount Jiri tend to build up, influencing the development of soil layers (Yang 2008; Kim et al. 2010). Thus, soil in Mount Jiri is characterized by organic layers and deep O and A soil horizons (Anderson 1988; Bormann et al. 1995; Huggett 1998; Hartemink et al. 2020). The soil supports a thriving vegetation, along with peat deposits (Anderson 1988; Bormann et al. 1995; Huggett 1998). Some microorganisms can use the peat as an energy source, leading to the formation of a unique type of microbial community (Williams and Yavitt 2003; Dobrovol’skaya et al. 2012). This microbial community contains decomposers that can degrade cellulose and/or lignin as well as consumers that utilize the resulting degradation products (Berg and McClaugherty 2003; Berg and Laskowski 2005; Stone et al. 2020), including organic carbon sources, nitrogen, phosphorus, and trace elements (Jewell 1971; Garber 1984; Canfield et al. 2020; Zhang et al. 2020). In addition, microalgal groups consume nitrogen and phosphorus (Di Termini et al. 2011) and are involved in cycling these elements through photosynthesis (McGlathery et al. 2004). Microalgal groups can act as producers (of oxygen), consumers (of organic carbon sources), and decomposers (of cellulose and lignin, using them as energy sources) (Schoenberg et al. 1984; Perez-Garcia et al. 2011; Blifernez-Klassen et al. 2012). Therefore, microalgal groups can play a variety of ecological roles and potentially affect the diversity of the microbial community (Schoenberg et al. 1984; Perez-Garcia et al. 2011; Blifernez-Klassen et al. 2012).
Each of the Jiri marshes possesses unique characteristics, making them attractive sites for the comparative analyses of physicochemical factors and microbial communities (Yang 2008; Kim and Jung 2018). In this study, we investigated three mountain marsh sites by analyzing the microbial community DNA of eukaryotic microalgal groups and other microorganisms based on the amplification of the 18S rRNA gene. In addition, the geographic isolation between the mountain marshes was tested to identify the environmental factors affecting microbial and microalgal communities in the marshes.
Experimental
Materials and Methods
Collection of samples. Samples were collected from Jeonglyeongchi marsh (35°21’52.5”N 127°31’25.5”E, Deokdong-ri, Sannae-myeon, Namwon-si, Jeollabuk-do, South Korea), Waegok marsh (35°22’57.0”N 127°46’49.7”E, Yupyeong-ri, Samjang-myeon, Sanche ong-gun, Gyeongsangnam-do, South Korea), and Wangdeungjae marsh (35°23’21.8”N 127°47’19.0”E, Yupyeong-ri, Samjang-myeon, Sancheong-gun, Gyeongsangnam-do, South Korea) (Fig. 1) in July 2019, at ten different locations within each marsh. Each sample consisted of 500 ml of freshwater. Samples were transported to the laboratory, then shipped to Macrogen Co., Ltd. using the same-day express courier service. All analyses were performed at room temperature. All living materials were immediately examined and then fixed in 5% formalin for permanent preservation and detailed identification (Kim and Jung 2018).
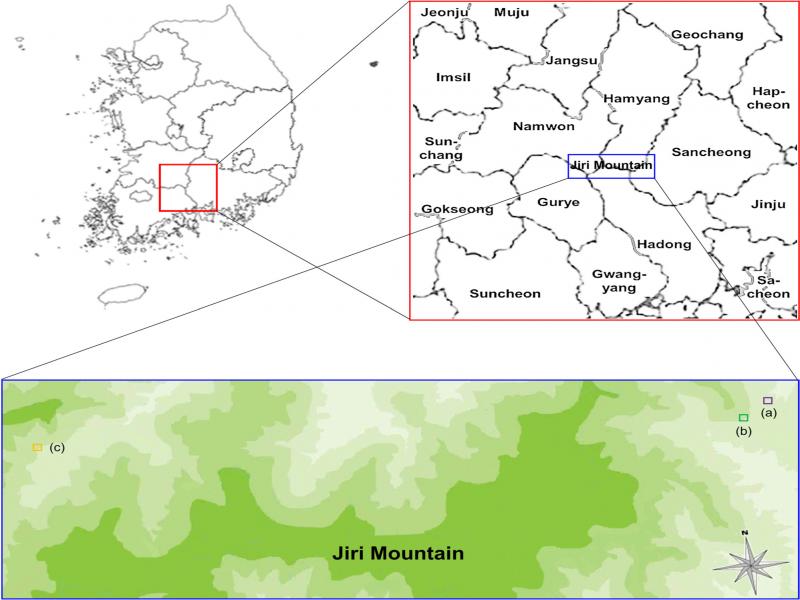
Fig. 1.
Location of sampling sites at three mountain marshes. Red box: location of Mountain Jiri, covering five cities in the southern part of the Korean peninsula. Blue box: location of Mountain Jiri and sampling sites marked with small boxes.
a) Purple box, Wangdeungjae marsh, 35°23’21.8”N 127°47’19.0”E. b) Green box, Waegok marsh, 35°22’57.0”N 127°46’49.7”E. c) Orange box, Jeonglyeongchi marsh, 35°21’52.5”N 127°31’25.5”E.
Physicochemical analysis. Temperature, pH, electrical conductivity (EC), salinity, dissolved oxygen (DO), and nephelometric turbidity of the samples were measured on-site using a multiparameter instrument (U-50 Multiparameter Water Quality Meter, HORIBA, Kyoto, Japan). A water test kit (HUMAS, Daejeon, South Korea) was used to measure total nitrogen (TN) and total phosphorus (TP) in each sample.
Microbial community analysis. Illumina MiSeq analyses of the microbial communities were performed by the Macrogen (Macrogen, Seoul, South Korea, https://dna.macrogen.com/kor/), as described previously (Yun et al. 2019). DNA for Illumina MiSeq sequencing was extracted from the samples according to the manufacturer’s protocol of the PowerSoil® DNA Isolation Kit (Cat. No. 12888, MO BIO) (Claassen et al. 2013). PicoGreen and Nanodrop were used for quantification and quality measurements of the extracted DNA. Extracted DNA samples were amplified by PCR according to the Illumina 18S Metagenomic Sequencing Library protocols (Vo and Jedlicka 2014). The 18S V4 primer set was used to amplify the 18S rRNA regions (Stoeck et al. 2010). TAReuk454FWD1 (forward primer, 5’-CCAGCA(G/C)C(C/T)GCGGTAATTCC-3’) and TAReukREV3 (reverse primer, 5’-ACTTTCGTTCTTGAT(C/T)(A/G)A-3’) were used as the 18S V4 primer set (Stoeck et al. 2010). A subsequent limited-cycle amplification was conducted for the addition of multiplexing indices and Illumina sequencing adapters (Meyer and Kircher 2010). The target DNA fragment size of PCR amplification is approximately 420 bp; the final DNA fragments were pooled and normalized using PicoGreen. TapeStation DNA and D1000 ScreenTape system (Agilent) was used to verify the library size. The sequencing data results were analyzed using the MiSeq™ platform (Illumina, San Diego, USA) (Kozich et al. 2013).
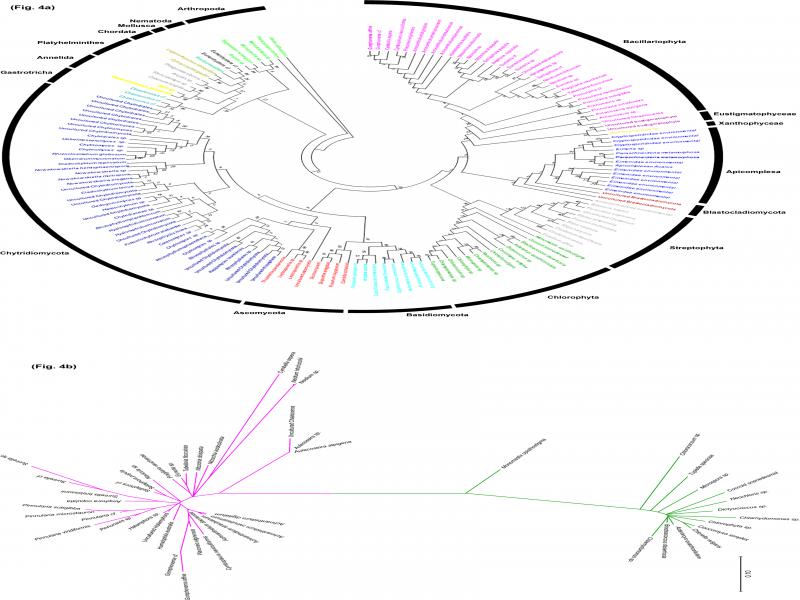
Taxonomic identification and phylogenetic analysis. The raw sequencing data were demultiplexed using the index sequence, and a FASTQ file was generated for each sample (Yun et al. 2019). The adapter sequence was removed using SeqPurge, and the sequencing error correction was performed on the overlapping areas of the correct reads (Sturm et al. 2016). Low-quality sequences of barcode sequences were trimmed and filtered (standard: 400 bp<read length or 25<average quality value). The trimmed and filtered sequencing data were identified using a BLASTN search from the NCBI database, based on their barcode sequences (Zhang et al. 2000). For the unclassified results, “–” was marked to the end of the name for each sublevel. Each operational taxonomic unit (OTU) was analyzed based on the CD-HIT at a 97% sequence similarity level (Li et al. 2012). The rarefaction curves and the diversity indicators (Shannon, Simpson, and Chao1) were calculated using the Mothur platform (Heck Jr et al. 1975; Schloss et al. 2009). Based on the weighted UniFrac distance, Beta diversity (sample diversity information of the comparison group) was calculated and used to visualize the relationship between the samples using the UPGMA tree (FigTree, http://tree.bio.ed.ac.uk/software/figtree/). Phylogenetic analysis was performed using the software package MEGA version 7.0 (Kumar et al. 2008; Kumar et al. 2016). The identified sequencing data groups were aligned using ClustalW and incorporated in MEGA 7.0 (Kumar et al. 2008; Kumar et al. 2016). The best-fit nucleotide substitution model was selected based on the Bayesian information criterion (Schwarz 1978). The maximum likelihood (ML) phylogenetic tree was built according to the best-fit nucleotide substitution model (Felsenstein 1985).
Culture-based analysis of microalgal groups. To culture microalgae, 1 ml of each sample was inoculated into 100 ml of culture medium in a 250 ml flask (Rippka et al. 1979; Bolch and Blackburn 1996). Four types of culture media were used: Blue Green-11 (BG11) medium, Optimum Haematococcus Medium (OHM), Bold Basal medium (BB), and Diatom Medium (DM) (Agrawal and Sarma 1982; Bolch and Blackburn 1996; Fábregas et al. 2000; Safonova et al. 2007). The cultures were grown under constant shaking (VS-202D orbital shaker, Vision Scientific, Bucheon, South Korea) and exposed to light in an illuminated incubation room (light: dark cycle of 16:8 h, fluorescent lamp, approximately 55 μmol photons) set at 25°C. Microalgae were cultivated for two weeks, and the resulting cultures were spread on agar plates and incubated until algal colonies formed. Then, the latter would be transferred aseptically to fresh medium (Stanier et al. 1971). The number of colonies that formed on the first set of plats was counted, and data were analyzed as described in the next section. An optical microscope (Nikon Eclipse E100 Biological Microscope, Tokyo, Japan) was used for morphological identification and the 18S V4 region of selected cultures was amplified and sequenced for molecular identification (Stoeck et al. 2010).
Statistical analysis. We compared individual data points using the Student’s t-test. A p-value of < 0.05 was considered statistically significant. All data were subjected to one-way analysis of variance (ANOVA). All statistical analyses were performed using the Statistical Package for the Social Sciences software (SPSS). All the experiments were performed at least in triplicate, and all the traditional microbiological data are expressed as mean ± standard deviation (SD) (n = 3).
Results
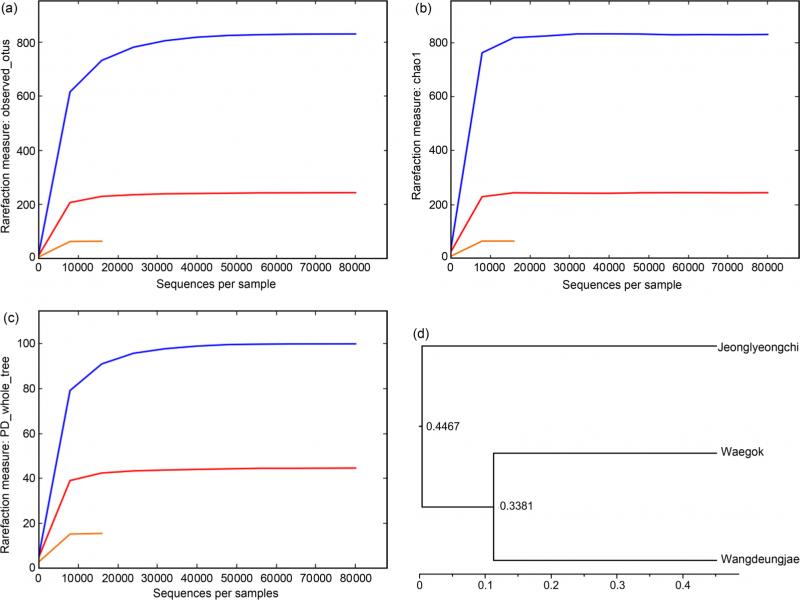
Environmental factors and species diversity estimates. The physicochemical characteristics of Jeonglyeongchi, Waegok, and Wangdeungjae marshes are summarized in Table I. The registered average temperatures in Jeonglyeongchi, Waegok, and Wangdeungjae were 12.75°C, 16.55°C, and 22.93°C, respectively. The pH values of all marshes were between pH 6 and 7 – pH 6.95 at Jeonglyeongchi, pH 6.84 at Waegok, and pH 6.48 at Wangdeungjae. The EC values at Jeonglyeongchi and Waegok were 32 and 36 μS/cm, respectively, and significantly lower than 96 μS/cm registered at Wangdeungjae. The marshes differed by approximately 3 mg/l in DO, as its values at Jeonglyeongchi, Waegok, and Wangdeungjae were 10.51, 7.98, and 4.71 mg/l, respectively. The turbidity at Waegok averaged 42.30 nephelometric turbidity units (NTU), which was considerably higher than those at Jeonglyeongchi (2.51 NTU) and Wangdeungjae (6.26 NTU). The TP levels at Jeonglyeongchi and Waegok were 1.57 ± 0.16 and 0.94 ± 0.01 mg/l, respectively, and undetectable in Wangdeungjae. The salinity and TN levels in all the marshes were below the detection limits. Overall, Jeonglyeongchi and Waegok have shown to have similar physicochemical characteristics.
Table I
Physicochemical measurements, sequencing results, and ecological diversity analysis of Mount Jiri marsh samples.
| x | Jeonglyeongchi | Waegok | Wangdeungjae | ||||
|---|---|---|---|---|---|---|---|
| Physico-chemical factors | Temperature (°C) | 12.75 | 16.55 | 22.93 | |||
| pH | 6.95 | 6.84 | 6.48 | ||||
| EC (µS/cm) | 32 | 36 | 96 | ||||
| Salinity (ppt) | 0.0 | 0.0 | 0.0 | ||||
| DO (mg/l) | 10.51 | 7.98 | 4.71 | ||||
| Turbidity (NTU) | 2.51 | 42.30 | 6.26 | ||||
| TN (mg/l) | 0.00 ± 0.00 | 0.00 ± 0.00 | 0.00 ± 0.00 | ||||
| TP (mg/l) | 1.57 ± 0.16 | 0.94 ± 0.01 | 0.00 ± 0.00 | ||||
| Sequencing results | Total reads | 122,953 | 113,853 | 121,392 | |||
| Validated reads | 98,159 | 80,099 | 22,249 | ||||
| Mean read length (bp) | 406.28 | 402.63 | 401.70 | ||||
| Maximum read length (bp) | 419 | 407 | 407 | ||||
| Number of OTUsa | 243 | 828 | 64 | ||||
| Diversity indicators | Chao1b | 243.00 | 828.00 | 64.00 | |||
| Shannonc | 4.84 | 6.36 | 2.97 | ||||
| Simpsond | 0.91 | 0.94 | 0.75 | ||||
| Goods Coveragee | 1.00 | 1.00 | 1.00 | ||||
| Taxonomy | Relative abundance (%) | ||||||
|---|---|---|---|---|---|---|---|
| Phylum | Class | Order | Family | Species | Jeonglye ongchi | Waegok | Wangdeungjae |
| Annelida | – | Haplotaxida | Enchytraeidae | Mesenchytraeus pelicensis | 0 | 0.05 | 0 |
| Annelida | – | Haplotaxida | Naididae | Dero sp. | 0 | 0.17 | 9.98 |
| Apicomplexa | – | – | – | Apicomplexan Acarus | 0 | 0.01 | 0 |
| Apicomplexa | – | – | Sphaerocystidae | Paraschneideria metamorphosa | 0 | 0.19 | 0 |
| Apicomplexa | Coccidia | Eucoccidiorida | Cryptosporidiidae | Cryptosporidiidae environmental | 0 | 3.09 | 0.93 |
| Apicomplexa | Coccidia | Eucoccidiorida | Eimeriidae | Eimeriidae environmental | 5.43 | 1.11 | 0 |
| Apicomplexa | Coccidia | Eucoccidiorida | Eimeriidae | Eimeria sp. | 0 | 0 | 26.17 |
| Arthropoda | – | Cyclopoida | Cyclopidae | Paracyclops chiltoni | 0 | 0.16 | 0 |
| Arthropoda | Arachnida | – | Anystidae | Anystis sp. | 0 | 0.03 | 0 |
| Arthropoda | Arachnida | – | Hygrobatidae | Hygrobates norvegicus | 5.73 | 0 | 0 |
| Arthropoda | Insecta | Diptera | Chironomidae | Micropsectra sp. | 0.31 | 0 | 0 |
| Arthropoda | Insecta | Diptera | Chironomidae | Monodiamesa sp. | 0 | 0.05 | 0 |
| Arthropoda | Insecta | Diptera | Culicidae | Aedes albopictus | 0 | 34.77 | 0 |
| Ascomycota | – | – | – | Uncultured ascomycete | 0 | 0.04 | 0 |
| Ascomycota | Saccharomycetes | Saccharomycetales | Debaryomycetaceae | [Candida] schatavii | 0.07 | 0 | 0 |
| Ascomycota | Sordariomycetes | – | – | Leptosporella sp. | 0 | 0.11 | 0 |
| Ascomycota | Sordariomycetes | Chaetosphaeriales | Chaetosphaeriaceae | Thozetella pandanicola | 0 | 1.24 | 0 |
| Ascomycota | Sordariomycetes | Diaporthales | Diaporthaceae | Diaporthe amygdali | 0 | 0.02 | 0 |
| Ascomycota | Sordariomycetes | Hypocreales | Nectriaceae | Fusarium oxysporum | 0 | 0.05 | 0 |
| Ascomycota | Sordariomycetes | Xylariales | – | Discosia querci | 0 | 0.01 | 0 |
| Bacillariophyta | Bacillariophyceae | – | – | Achnanthidium daonense | 0 | 0.04 | 0 |
| Bacillariophyta | Bacillariophyceae | – | – | Achnanthidium digitatum | 0 | 0.11 | 0 |
| Bacillariophyta | Bacillariophyceae | – | – | Achnanthidium minutissimum | 0 | 0.25 | 0 |
| Bacillariophyta | Bacillariophyceae | – | – | Achnanthidium straubianum | 0 | 0.12 | 0 |
| Bacillariophyta | Bacillariophyceae | – | Bacillariaceae | Nitzschia acidoclinata | 0 | 0.04 | 0 |
| Bacillariophyta | Bacillariophyceae | – | Bacillariaceae | Nitzschia dissipata | 0 | 0.18 | 0 |
| Bacillariophyta | Bacillariophyceae | – | Cymbellaceae | Cymbella aspera | 0 | 1.45 | 0 |
| Bacillariophyta | Bacillariophyceae | – | Cymbellaceae | Cymbopleura naviculiformis | 0 | 0.82 | 0 |
| Bacillariophyta | Bacillariophyceae | – | Cymbellaceae | Placoneis elginensis | 0 | 0.09 | 0 |
| Bacillariophyta | Bacillariophyceae | – | Gomphonemataceae | Gomphonema affine | 0.57 | 0.36 | 0 |
| Bacillariophyta | Bacillariophyceae | – | Gomphonemataceae | Gomphonema cf. | 0 | 0.18 | 0 |
| Bacillariophyta | Bacillariophyceae | Eunotiales | Eunotiaceae | Eunotia sp. | 0.24 | 0.14 | 0.81 |
| Bacillariophyta | Bacillariophyceae | Naviculales | – | Humidophila australis | 0 | 0.03 | 0 |
| Bacillariophyta | Bacillariophyceae | Naviculales | – | Uncultured Halamphora | 0 | 0.03 | 0 |
| Bacillariophyta | Bacillariophyceae | Naviculales | Amphipleuraceae | Halamphora sp. | 0 | 0.11 | 0 |
| Bacillariophyta | Bacillariophyceae | Naviculales | Naviculaceae | Pinnunavis sp. | 0 | 0.18 | 0 |
| Bacillariophyta | Bacillariophyceae | Naviculales | Naviculaceae | Navicula sp. | 0 | 0.04 | 0 |
| Bacillariophyta | Bacillariophyceae | Naviculales | Neidiaceae | Neidium hitchcockii | 0 | 0.01 | 0 |
| Bacillariophyta | Bacillariophyceae | Naviculales | Neidiaceae | Neidium sp. | 0 | 0.11 | 0 |
| Bacillariophyta | Bacillariophyceae | Naviculales | Pinnulariaceae | Pinnularia cf. | 0 | 0.11 | 0 |
| Bacillariophyta | Bacillariophyceae | Naviculales | Pinnulariaceae | Pinnularia microstauron | 0 | 0.51 | 0 |
| Bacillariophyta | Bacillariophyceae | Naviculales | Pinnulariaceae | Pinnularia subgibba | 0.34 | 0 | 0 |
| Bacillariophyta | Bacillariophyceae | Naviculales | Pinnulariaceae | Pinnularia viridiformis | 0 | 0.04 | 0 |
| Bacillariophyta | Bacillariophyceae | Naviculales | Sellaphoraceae | Sellaphora cf. | 0 | 0.01 | 0 |
| Bacillariophyta | Bacillariophyceae | Naviculales | Sellaphoraceae | Sellaphora pupula | 0 | 0.04 | 0 |
| Bacillariophyta | Bacillariophyceae | Surirellales | – | Surirella brebissonii | 0 | 0.75 | 0 |
| Bacillariophyta | Bacillariophyceae | Surirellales | – | Surirella cf. | 0 | 0.08 | 0 |
| Bacillariophyta | Bacillariophyceae | Surirellales | – | Surirella sp. | 0 | 0.09 | 0 |
| Bacillariophyta | Bacillariophyceae | Thalassiophysales | Catenulaceae | Amphora copulata | 0 | 0.21 | 0 |
| Bacillariophyta | Coscinodiscophyceae | – | Aulacoseiraceae | Aulacoseira alpigena | 0 | 0.12 | 1.83 |
| Bacillariophyta | Coscinodiscophyceae | – | Aulacoseiraceae | Aulacoseira sp. | 0 | 0 | 7.77 |
| Bacillariophyta | Coscinodiscophyceae | Chaetocerotales | Chaetocerotaceae | Uncultured Chaetoceros | 0 | 0.02 | 0 |
| Bacillariophyta | Fragilariophyceae | Fragilariales | Fragilariaceae | Fragilaria vaucheriae | 0 | 0.29 | 0 |
| Bacillariophyta | Fragilariophyceae | Tabellariales | Tabellariaceae | Tabellaria flocculosa | 0.23 | 0.44 | 0 |
| Basidiomycota | Agaricomycetes | Agaricales | – | Inocybe spuria | 0 | 0.01 | 0 |
| Basidiomycota | Agaricomycetes | Polyporales | – | Fibroporia gossypium | 0.11 | 0.08 | 0 |
| Basidiomycota | Tremellomycetes | – | – | Holtermanniella nyarrowii | 0.04 | 0 | 0 |
| Basidiomycota | Tremellomycetes | Cystofilobasidiales | Cystofilobasidiaceae | Cystofilobasidium macerans | 0.31 | 0.01 | 0 |
| Basidiomycota | Tremellomycetes | Filobasidiales | – | Solicoccozyma terricola | 0.21 | 0 | 0 |
| Basidiomycota | Tremellomycetes | Filobasidiales | Filobasidiaceae | Filobasidium magnum | 0.15 | 0 | 0 |
| Basidiomycota | Tremellomycetes | Tremellales | – | Cryptococcus carnescens | 0.02 | 0 | 0 |
| Basidiomycota | Tremellomycetes | Tremellales | – | Papiliotrema flavescens | 0.03 | 0 0 | |
| Blastocladiomycota | – | – | – | Uncultured Blastocladiomycota | 0 | 0.11 | 0 |
| Chlorophyta | – | – | – | Chlorophyta sp. | 0 | 0.01 | 0 |
| Chlorophyta | Chlorophyceae | – | Microsporaceae | Microspora sp. | 0 | 0 | 1.24 |
| Chlorophyta | Chlorophyceae | Chlamydomonadales | Chlamydomonadaceae | Chlamydomonas sp. | 0 | 0.05 | 1.24 |
| Chlorophyta | Chlorophyceae | Chlamydomonadales | Chlorococcaceae | Chlorococcum sp. | 0 | 0.04 | 0 |
| Chlorophyta | Chlorophyceae | Sphaeropleales | – | Dictyococcus sp. | 0 | 0.08 | 0 |
| Chlorophyta | Chlorophyceae | Sphaeropleales | – | Bracteacoccus deserticola | 0 | 0 | 0.09 |
| Chlorophyta | Chlorophyceae | Sphaeropleales | Neochloridaceae | Neochloris sp. | 0.22 | 0 | 0 |
| Chlorophyta | Chlorophyceae | Sphaeropleales | Scenedesmaceae | Scenedesmus sp. | 0 | 0 | 1.71 |
| Chlorophyta | Chlorophyceae | Sphaeropleales | Scenedesmaceae | Asterarcys quadricellulare | 0 | 0.02 | 0 |
| Chlorophyta | Trebouxiophyceae | – | Coccomyxaceae | Coccomyxa simplex | 0.15 | 0.01 | 0 |
| Chlorophyta | Trebouxiophyceae | Chlorellales | Chlorellaceae | Chlorella vulgaris | 0 | 0.01 | 0.44 |
| Chlorophyta | Ulvophyceae | Ulotrichales | – | Tupiella speciosa | 0.12 | 0.03 | 0 |
| Chlorophyta | prasinophytes | – | – | Monomastix opisthostigma | 0 | 0.05 | 0 |
| Chordata | Amphibia | Caudata | Salamandridae | Cynops pyrrhogaster | 0.05 | 0 | 0 |
| Chordata | Mammalia | Cetacea | Delphinidae | Lagenorhynchus obliquidens | 0 | 0 | 2.45 |
| Chytridiomycota | – | – | – | Uncultured Chytridiomycota | 1.31 | 1.09 | 0.44 |
| Chytridiomycota | – | – | – | Uncultured rhizosphere | 0 | 0.01 | 0 |
| Chytridiomycota | Chytridiomycetes | – | – | Catenomyces sp. | 0 | 0.08 | 0 |
| Chytridiomycota | Chytridiomycetes | – | – | Rhizophlyctis rosea | 0 | 0 | 1.58 |
| Chytridiomycota | Chytridiomycetes | Chytridiales | – | Chytridiales sp. | 0 | 0.41 | 0 |
| Chytridiomycota | Chytridiomycetes | Chytridiales | – | Uncultured Chytridiales | 0 | 0.46 | 0 |
| Chytridiomycota | Chytridiomycetes | Chytridiales | – | Uncultured Chytriomyces | 0 | 0.23 | 0 |
| Chytridiomycota | Chytridiomycetes | Chytridiales | – | Chytriomyces sp. | 0.12 | 0.09 | 10.94 |
| Chytridiomycota | Chytridiomycetes | Chytridiales | – | Obelidium mucronatum | 2.62 | 0.58 | 0 |
| Chytridiomycota | Chytridiomycetes | Chytridiales | – | Rhizoclosmatium globosum | 9.07 | 0 | 0 |
| Chytridiomycota | Chytridiomycetes | Chytridiales | Chytridiaceae | Chytridiaceae sp. | 0 | 0.11 | 0 |
| Chytridiomycota | Chytridiomycetes | Cladochytriales | – | Nowakowskiella elegans | 0 | 0.02 | 0 |
| Chytridiomycota | Chytridiomycetes | Cladochytriales | – | Nowakowskiella hemisphaerospora | 0.43 | 0.17 | 0 |
| Chytridiomycota | Chytridiomycetes | Cladochytriales | – | Nowakowskiella multispora | 0 | 1.61 | 0 |
| Chytridiomycota | Chytridiomycetes | Cladochytriales | – | Nowakowskiella sp. | 0 | 0.16 | 0 |
| Chytridiomycota | Chytridiomycetes | Cladochytriales | Cladochytriaceae | Cladochytrium replicatum | 0 | 0.02 | 0 |
| Chytridiomycota | Chytridiomycetes | Cladochytriales | Cladochytriaceae | Cladochytrium tenue | 0 | 0.01 | 0 |
| Chytridiomycota | Chytridiomycetes | Rhizophydiales | – | Rhizophydiales sp. | 0 | 0.08 | 0 |
| Chytridiomycota | Chytridiomycetes | Rhizophydiales | – | Uebelmesseromyces sp. | 0 | 0.94 | 0 |
| Chytridiomycota | Chytridiomycetes | Rhizophydiales | Kappamycetaceae | Kappamyces laurelensis | 0.13 | 0.01 | 0 |
| Chytridiomycota | Chytridiomycetes | Rhizophydiales | Rhizophydiaceae | Rhizophydium planktonicum | 0 | 0 | 0.51 |
| Chytridiomycota | Chytridiomycetes | Rhizophydiales | Rhizophydiaceae | Rhizophydium sphaerotheca | 0 | 2.14 | 0 |
| Chytridiomycota | Chytridiomycetes | Spizellomycetales | – | Fimicolochytrium alabamae | 0.18 | 0.15 | 0 |
| Chytridiomycota | Monoblepharidomycetes | Monoblepharidales | – | Hyaloraphidium curvatum | 0.09 | 0.02 | 0 |
| Chytridiomycota | Monoblepharidomycetes | Monoblepharidales | Harpochytriaceae | Harpochytrium sp. | 0 | 0.06 | 0 |
| Chytridiomycota | Monoblepharidomycetes | Monoblepharidales | Oedogoniomycetaceae | Oedogoniomyces sp. | 0 | 0.01 | 0 |
| Eustigmatophyceae | – | – | – | Uncultured eustigmatophyte | 0 | 0.04 | 0 |
| Gastrotricha | – | Chaetonotida | Chaetonotidae | Chaetonotus cf. | 0 | 24.43 | 0 |
| Mollusca | Bivalvia | Veneroida | Sphaeriidae | Pisidium walkeri | 0 | 0.03 | 0 |
| Nematoda | Chromadorea | Monhysterida | Monhysteridae | Eumonhystera cf. | 0.46 | 0 | 22.27 |
| Platyhelminthes | – | Catenulida | Catenulidae | Catenula turgida | 0.07 | 0 | 0 |
| Platyhelminthes | – | Catenulida | Stenostomidae | Stenostomum sp. | 0 | 0.06 | 6.62 |
| Platyhelminthes | – | Rhabdocoela | Typhloplanidae | Phaenocora sp. | 0 | 0.02 | 0 |
| Platyhelminthes | – | Tricladida | Planariidae | Phagocata sibirica | 68.64 | 0 | 0 |
| Streptophyta | – | Brassicales | Brassicaceae | Brassica napus | 0 | 0 | 0.34 |
| Streptophyta | – | Caryophyllales | Polygonaceae | Persicaria virginiana | 1.96 | 0.01 | 0 |
| Streptophyta | – | Ericales | Styracaceae | Styrax americana | 0 | 0.04 | 0 |
| Streptophyta | – | Malpighiales | Salicaceae | Populus trichocarpa | 0 | 2.84 | 0 |
| Streptophyta | – | Piperales | – | Aristolochiaceae environmental | 0.16 | 0 | 0 |
| Streptophyta | Liliopsida | Poales | Poaceae | Stipa narynica | 0 | 15.14 | 0 |
| Streptophyta | Zygnemophyceae | Desmidiales | – | Uncultured Closterium | 0.43 | 0.06 | 0 |
| Streptophyta | Zygnemophyceae | Desmidiales | Closteriaceae | Closterium moniliferum | 0 | 0.21 | 0 |
| Streptophyta | Zygnemophyceae | Desmidiales | Closteriaceae | Closterium venus | 0 | 0 | 0.62 |
| Streptophyta | Zygnemophyceae | Desmidiales | Desmidiaceae | Euastrum affine | 0 | 0 | 2.02 |
| Xanthophyceae | – | – | – | Xanthophyceae sp. | 0 | 0.05 | 0 |
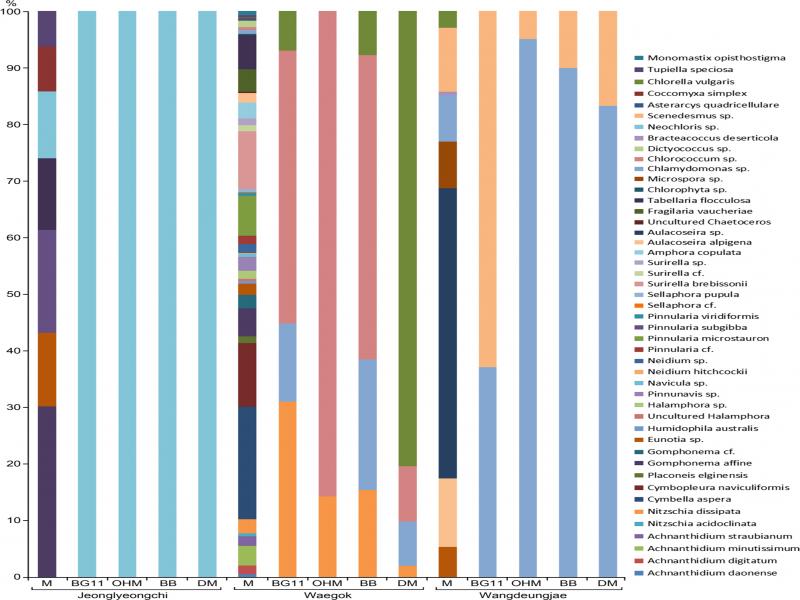
| Species | Accession number | Jeonglyeongchi | Waegok | Wangdeungjae | |||
|---|---|---|---|---|---|---|---|
| M | CB | M | CB | M | CB | ||
| Achnanthidium daonense | KJ658413 | – | – | + | – | – | – |
| Achnanthidium digitatum | KX946582 | – | – | + | – | – | – |
| Achnanthidium minutissimum | MH358459 | – | – | + | – | – | – |
| Achnanthidium straubianum | KY863467 | – | – | + | – | – | – |
| Nitzschia acidoclinata | KT072971 | – | – | + | – | – | – |
| Nitzschia dissipata | AJ867018 | – | – | + | + | – | – |
| Cymbella aspera | KJO11615 | – | – | + | – | – | – |
| Cymbopleura naviculiformis | AM501997 | – | – | + | – | – | – |
| Placoneis elginensis | AM501953 | – | – | + | – | – | – |
| Gomphonema affine | MN197879 | + | – | + | – | – | – |
| Gomphonema cf. | AM502005 | – | – | + | – | – | – |
| Eunotia sp. | KJ961696 | + | – | + | – | + | – |
| Humidophila australis | KM116120 | – | – | + | – | – | – |
| Uncultured Halamphora | MK656307 | – | – | + | – | – | – |
| Halamphora sp. | MG027261 | – | – | + | – | – | – |
| Pinnunavis sp. | KJ961669 | – | – | + | – | – | – |
| Navicula sp. | MK177604 | – | – | + | – | – | – |
| Neidium hitchcockii | KU674393 | – | – | + | – | – | – |
| Neidium sp. | KU674445 | – | – | + | – | – | – |
| Pinnularia cf. | JN418569 | – | – | + | – | – | – |
| Pinnularia microstauron | AM501981 | – | – | + | – | – | – |
| Pinnularia subgibba | KT072984 | + | – | – | – | – | – |
| Pinnularia viridiformis | AM501985 | – | – | + | – | – | – |
| Sellaphora cf. | EF151967 | – | – | + | – | – | – |
| Sellaphora pupula | AJ544653 | – | – | + | – | – | – |
| Surirella brebissonii | KX120739 | – | – | + | – | – | – |
| Surirella cf. | KX120782 | – | – | + | – | – | – |
| Surirella sp. | KX120781 | – | – | + | – | – | – |
| Amphora copulata | MG027291 | – | – | + | – | – | – |
| Aulacoseira alpigena | AY569578 | – | – | + | – | + | – |
| Aulacoseira sp. | AY569587 | – | – | – | – | + | – |
| Uncultured Chaetoceros | MH023058 | – | – | + | – | – | – |
| Fragilaria vaucheriae | AM497736 | – | – | + | – | – | – |
| Tabellaria foecu losa | MH356258 | + | – | + | – | – | – |
| Chlorophyta sp. | MK929233 | – | – | + | – | – | – |
| Microspora sp. | AF387160 | – | – | – | – | + | – |
| Chlamydomonas sp. | MH683856 | – | – | + | + | + | + |
| Chlorococcum sp. | MK954470 | – | – | + | + | – | – |
| Dictyococcus sp. | HM852440 | – | – | + | – | – | – |
| Bracteacoccus deserticola | JQ259938 | – | – | – | – | + | – |
| Neochloris sp. | AB917132 | + | + | – | – | – | – |
| Scenedesmus sp. | MHO 10849 | – | – | – | – | + | + |
| Asterarcys quadricellulare | MN179327 | – | – | + | – | – | – |
| Coccomyxa simplex | MH196858 | + | – | + | – | – | – |
| Chlorella vulgaris | MK652782 | – | – | + | + | + | – |
| Tupiella speciosa | MF000567 | + | – | + | – | – | – |
| Monomastix opisthostigma | FN562445 | – | – | + | – | – | – |
Discussion
Physicochemical characteristics of Jiri marsh sites. Each marsh presents distinctive environmental characteristics. Jeonglyeongchi marsh had the lowest temperatures registered and the highest DO and TP concentrations (Table I), whereas the temperature at Wangdeungjae marsh (above 20°C) was suitable for the cultivation of microorganisms. The latter marsh also recorded the lowest DO and TP concentrations (Tanner 2007). These mesophilic conditions can promote higher levels of microbial activity compared to low temperatures (Tanner 2007). This increased level of metaolic activity can then change the consumption and overall concentrations of DO and TP (Amon and Benner 1996; Levantesi et al. 2002). In addition, pH and EC, which depend on ion concentrations, vary due to metabolites produced during degradation (Kwabiah et al. 2001; Berg and Laskowski 2005; Rousk et al. 2010). These results support the idea that temperature plays a major role as an environmental factor in all the studied marshes (Witkamp and Frank 1970; Tanner 2007; Kukharenko et al. 2010).
Moreover, Illumina MiSeq analyses were used to characterize the diversity of the microbial communities in the three sites. The sequence analysis revealed a Goods Coverage value of 1.00, which means that our sequencing efforts were 100% effective. Waegok marsh had the highest number of OTUs and diversity index values (Chao1, Shannon, Simpson). By associating the physicochemical characteristics of each site with the corresponding diversity results, we can conclude that the moderate environmental conditions in Waegok marsh, in contrast to the relatively extreme conditions in Jeonglyeongchi and Wangdeungjae, provided a more suitable ecosystem for the microbial community (Zhou et al. 2002; Curtis and Sloan 2004; Roesch et al. 2007). Our research suggests that environmental conditions can determine the degree of diversity of the microbial community, resulting from various adaptation processes. The environmental conditions at each site were influenced by the geographic isolation between the mountain marshes.
Ecological differences and relationships among mountain marsh sites in Jiri mountain. According to the UPGMA tree, which analyzed the relationship between the microbial communities of the investigated mountain marsh sites, it can be concluded that the microbial communities of Weagok and Wangdeungjae, which are geographically close (Fig. 1), presented a higher similarity than the microbial communities of Jeonglyeongchi (Fig. 2). In addition, the physicochemical factors of Jeonglyeongchi were different from those of Weagok and Wangdeungjae (Table I). In Jeonglyeongchi, the measured values for temperature (12.75°C), EC (32 μS/cm), and turbidity (2.51 NTU) were the lowest recorded, whereas higher values were observed for pH (6.95), DO (10.51 mg/l), and TP (1.57 ± 0.16 mg/l). Given these facts, it was possible to explain that the microbial community of Jeonglyeongchi was distinctive from other sites, and this was due to the variable inter-marsh physicochemical factors. However, when comparing the differences between microbial communities through the number of OTUs and diversity indicators (Chao1, Shannon, Simpson), these values showed high similarity between Jeonglyeongchi and Waegok and less to Wangdeungjae (Table I). This fact contradicted the relationship between mountain marshes based on physicochemical factors. This disparity could be resolved through the composition of the microbial community (supplementary Table SII). While 68.71% of the microbial community in Jeonglyeongchi was dominated by one species belonging to Platyhelminthes, the microbial community of Weagok and Wangdeungjae was composed of several species belonging to 3–4 phyla (Table II). Thus, it is believed that the similarity between microbial communities does not depend on diversity indicators (Miller et al. 2020; Wen et al. 2020). Nonetheless, we support that the comparison between microbial communities should be accompanied by a composition comparison factor (Shi et al. 2020). The composition of microbial communities is thought to be influenced by physicochemical factors, and this way, both studies are complementary (Sun et al. 2020). Thus, the microbial community of mountain marshes, separated due to the topographic features of Mount Jiri, needs diverse research approaches study of physicochemical factors and diversity indicators to understand their microbial community fully.
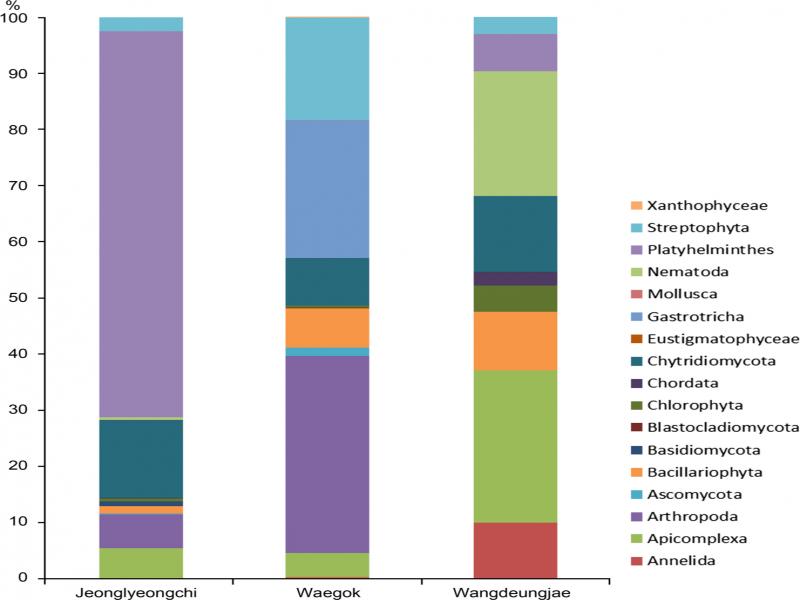
Taxonomic composition of phyla at mountain marsh sites. The phyla comprising the microbial communities of the three marsh sites is shown in Fig. 3. In addition, the taxonomic compositions from phyla to respective species levels are summarized in Table II. The most abundant phyla (present in more than 10% of the microbiome’s taxonomic) included Apicomplexa, Arthropoda, Bacillariophyta, Chytridiomycota, Gastrotricha, Nematoda, Platyhelminthes, and Streptophyta (Fig. 3). Each phylum plays a particular ecological role, either as a producer, decomposer, or consumer. For example, many species of Apicomplexa are parasitic to aquatic animals (Bolland et al. 2020; Laghzaoui et al. 2020). Arthropoda includes animal species such as insects that consume a variety of materials, from living biomass (e.g., algae) to organic carbon sources (e.g., plant byproducts) (Shayanmehr et al. 2020; Sperfeld et al. 2020). Bacillariophyta is composed of autotrophic, photosynthetic organisms such as microalgae that are easily observed in aquatic ecosystems (Al-Handal et al. 2020; Stancheva et al. 2020). Chytridiomycota is a phylum of fungi that includes zoosporic fungal species, which function as heterotrophs in aquatic environments (Jeronimo and Amorim Pires-Zottarelli 2020; McKindles et al. 2020). Gastrotricha comprises various zooplankton species, including predators that feed on phytoplankton (Bosco et al. 2020), whereas Nematoda combines parasitic species and species that consume and decompose organic matter (Jeong et al. 2020; Netherlands et al. 2020). The phylum Platyhelminthes includes species that consume organic matter attached to the bottom and surface, and feed on algae and other microorganisms and plant byproducts (Geraerts et al. 2020; Schadt et al. 2021). Species belonging to Streptophyta include autotrophs capable of photosynthesis (Stamenković et al. 2020; Williamson and Carter 2020). Based on these characteristics, Bacillariophyta and Streptophyta are considered producers (Pushkareva et al. 2016; Shnyukova and Zolotareva 2017); multicellular Arthropoda, Nematoda, and Platyhelminthes and unicellular Chytridiomycota are considered decomposers that decompose and consume organic materials (Berg and McClaugherty 2003; Berg and Laskowski 2005; Gessner et al. 2007; Gulis et al. 2019); and predators (Gastrotricha) and parasites (Apicomplexa) are considered consumers (Norén et al. 1999; Todaro et al. 2006). Most of the major taxa constituting the microbial community of the marshes are decomposers, and their composition differed by region. Jeonglyeongchi comprises more Chytridiomycota and Platyhelminthes, whereas Arthropoda is mostly seen in Waegok, and Chytridiomycota and Nematoda in Wangdeungjae. Among these phyla, only Chytridiomycota exceeded 5% abundance in all investigated regions (Fig. 3). Chytridiomycota is considered a decomposer that can parasitize microalgae (Ibelings et al. 2004; Gessner et al. 2007; Scholz et al. 2014; Gulis et al. 2019). Several species of Chytridiomycota are also parasitic on microalgal populations, thus affecting their growth (Ibelings et al. 2004; Scholz et al. 2014). This parasitic capacity of Chytridiomycota suggested that it may influence the community composition of Bacillariophyta and Chlorophyta in Jiri marshes. Finally, the predatory activity of Gastrotricha (a consumer) suggests that this group may be involved in the predominance of Streptophyta (a producer) by inhibiting the population growth of other microalgae (Todaro et al. 2006).
Our analysis reveals that each major phylum is represented by specific species. The major phyla at Jeonglyeongchi marsh, Chytridiomycota and Platyhelminthes, were represented by Rhizoclosmatium globosum and Phagocata sibirica, respectively. The major phyla at Waegok marsh, Arthropoda, Gastrotricha, and Streptophyta, were represented by Aedes albopictus, Chaetonotus cf., and Stipa narynica, respectively. The major phyla of Wangdeungjae marsh, Apicomplexa, Bacillariophyta, Chytridiomycota, and Nematoda, were represented by Eimeria sp., Aulacoseira sp., Chytriomyces sp., and Eumonhystera cf., respectively. The relative abundances of the predominant species ranged from 65.02% to 100.00%. Bacillariophyta and Chytridiomycota were least likely to be dominated by specific species. Furthermore, Bacillariophyta (34 species) and Chytridiomycota (26 species) were the largest phyla, representing 27.64% and 21.14%, respectively, of a total of 123 detected species. These results suggested that Bacillariophyta and Chytridiomycota were strongly associated with the species richness and diversity of microbial communities in mountain marshes.
Of all the microorganisms recorded in the three studied marshes, producers (Bacillariophyta and Streptophyta) accounted for less than 30% of the total abundance. Because producers were not a significant fraction of the community, consumers were probably dependent on externally derived organic materials (Lu and Wu 1998). For example, Platyhelminthes, a dominant consumer in Jeonglyeongchi, is likely dependent on externally derived organic materials (Roca et al. 1992; Lu and Wu 1998). Although producers were not abundant, their diversity may have had a significant impact on the diversity of the microbial community (Worm et al. 2002; Hillebrand et al. 2007; Cardinale et al. 2011). Bacillariophyta (with the most significant number of species, 34) and Streptophyta (with the fourth-largest number of species, 10) accounted for 35.77% of the total species. The producer group accounted for 17.65–39.58% of the species in the region (17.65% in Jeonglyeongchi, 39.58% in Waegok, and 28.57% in Wangdeungjae). These results discriminated the distribution of species relative to the abundance of the producer group (Hillebrand et al. 2007; Cardinale et al. 2011). Thus, the diversity of producers is highly important in determining the diversity of the local microbial community.
Comparison of marsh sites using culture-based and Illumina MiSeq analyses. We have cultured and identified one-four microalgal species from each marsh site using several types of media (Fig. 5 and supplementary Fig. S1). The following species were isolated and identified: Neochloris sp. at Jeonglyeongchi; Nitzschia dissipata, Chlamydomonas sp., Chlorococcum sp., and Chlorella vulgaris at Waegok; and Chlamydomonas sp. and Scenedesmus sp. at Wangdeungjae. Although the species were distributed disproportionately in each medium, only one species tended to be dominant among the few that grew (supplementary Fig. S1). A single species dominated in the BG11 and DM medium but not in the OHM and BB medium (supplementary Fig. S1). We were able to isolate representatives of Bacillariophyta and Chlorophyta, but not Streptophyta, in the culture media (Table III, Fig. 5 and supplementary Fig. 1). Isolated species included Neochloris sp., Nitzschia dissipata, Chlamydomonas sp., Chlorococcum sp., Chlorella vulgaris, and Scenedesmus sp. Only one species, Nitzschia dissipata, belonged to Bacillariophyta. The relative abundances of isolated species varied depending on the medium used (Fig. 5 and supplementary Fig. S1) (DiGiulio et al. 2008). It is known that only certain species can be cultivated and their growth depends on the composition of the medium chosen (Harrison and Davis 1979). It suggests that culture-based methods are not suitable for detecting multiple microalgal species, a severe limitation in determining community compositions (Alain and Querellou 2009). Furthermore, the inability to purely isolate 100% of all microbial species present using existing culture techniques and media means that the identification of unculturable microbes is limited. Therefore, microalgal community research based solely on culture analysis is limited because of the difficulty in identifying unculturable microorganisms (Handelsman 2004; Shokralla et al. 2012; Bodor et al. 2020). In contrast to culture-based methods, Illumina MiSeq can effectively analyze the microbial community structure of environmental samples, including the identification and analysis of unculturable microorganisms. Illumina MiSeq analysis overcomes the limitations of the culture-based analysis, providing a more accurate representation of the diversity of the microbial community.
Characteristics of microalgae in the marshes of Jiri. Most microalgae in aquatic environments with water flow are attached to surfaces (Benito 2020; Plante et al. 2021). Typically, attached algae are dominated by diatoms, including Bacillariophyta and some green algae, including Chlorophyta (Yun et al. 2019; Benito 2020; Plante et al. 2021). Therefore, in an environment with water flow, the floating algae are relatively less abundant (Yun et al. 2019; Prazukin et al. 2020). In an aquatic environment where water flow is weak, floating algae dominate, with its species’ composition often determined by environmental factors (Mashwani 2020). The microalgae present in the Jiri marshes were mainly composed of Bacillariophyta and Streptophyta (Ali et al. 2019; Garduño-Solórzano et al. 2020). While it is known that Chlorophyta tends to dominate in other aquatic environments (Amorim and Moura 2021), our results suggest that environmental differences determined the dominant microalgal groups.
Furthermore, to better understand the differences between these regional microalgal groups, a more comprehensive set of environmental factors should be investigated using a multidisciplinary rather than a fragmentary approach (Paquette et al. 2020; Sutherland et al. 2020). Our study provides information on the microbial communities and microalgal groups present in the Jiri marshes. Furthermore, our results suggest that it is important to analyze the taxonomic composition of the microalgae present in mountain marshes.
Conclusion
The highest levels of species richness and diversity among the three Jiri high marshes were found in the Waegok marsh, which may be due to the environment’s physicochemical characteristics. Analysis of community composition revealed that species’ abundance was concentrated in the decomposer group, whereas species’ diversity was based in the producer group. Moreover, the consumer group was related to the producer group. Based on these results, we suggest that producers do not support the entire microbial community, but they determine phylogenetic diversity. Illumina MiSeq analysis overcame the inherent limitations of the culture-based analysis, i.e., incomplete or biased results. Our analyses provide a clear association between the environmental conditions of three mountain marshes and the properties of their respective microbial and microalgal communities. Further research on the roles and interactions between microbial and microalgal communities should be investigated along with their environmental impacts. The data generated in this study can be used to identify mountain areas based on their microalgal communities and help understand the role of environmental factors in their geography.
Acknowledgments
We thank Jae-Hong Park (Research Institute of Ulleung-do & Dok-do, Kyungpook National University) for helpful discussions and assisting with Materials and Methods. This work was supported by the Basic Science Research Program of the National Research Foundation of Korea (NRF) funded by the Ministry of Education (Grant no. 2016R1A6A1A05011910 and Grant no. 2018R1D1A3B07049385), Korea. We are grateful for the financial support of the Next-Generation BioGreen 21 Program (Grant no. PJ013240), Korea. These funding bodies had no role in the design of the study; the collection, analysis, and interpretation of data; or in the writing of the manuscript.
Notes
[8] Conflicts of interest Conflict of interest
The authors do not report any financial or personal connections with other persons or organizations, which might negatively affect the contents of this publication and/or claim authorship rights to this publication.