
Introduction
Pestalotiopsis sp. is a mitosporic fungus with spore-forming conidia. This fungus has a wide distribution and a variety of life habits, including pathogenicity (Wang et al. 2019), saprophytic (Zi 2015), and endophytic characteristics (Tanapichatsakul et al. 2019; Liao et al. 2020). It is an important plant pathogen and an asexual fungus with specific economic value (Taylor et al. 2001). The types of compounds isolated from Pestalotiopsis in recent years include alkaloids, polyols, cyclic peptides, terpenes, isocoumarins, coumarins, quinones, semiquinones, chromones, simple phenols, phenolic acids, esters, and other novel compounds (Yang et al. 2012; Xie et al. 2015). Many of these compounds have important application prospects. Among the reported Pestalotiopsis species, most are pathogens, saprophytes, or endophytes, but there has been little research on the mycoparasitism of these species.
Mycoparasitism is the most critical form of antagonism involving direct physical contact with the host mycelium (Pal et al. 2006). It involves typical growth of biocontrol fungal mycelia toward the target pathogen followed by extensive coiling and secretion of various hydrolytic enzymes, leading to the dissolution of the pathogen’s cell wall or membrane. This mycoparasitism is common among Trichoderma. However, the mycoparasitism of Pestalotiopsis species is utterly different from that of Trichoderma based on microscopic observation. The aeciospores’ outer walls appear deformed and completely broken after treatment with Trichoderma (Li et al. 2014). Pestalotiopsis concentrates the contents of rust spores by producing toxins, and the cell walls sag inward. The contents of the affected rust spores are concentrated, and most of the spores are empty shells (Li et al. 2017).
Mycoparasitic Pestalotiopsis species produce secondary metabolites different from those of endophytic or pathogenic Pestalotiopsis species (Xie et al. 2015), and these species have yet to be developed and used as important fungal resources. Both the lifestyle and secondary metabolite richness of mycoparasitic fungi are not comprehensively understood. In this study, the genome of the mycoparasite Pestalotiopsis sp. PG52 isolated from Aecidium wenshanense was sequenced and annotated. A large set of genes involved in secondary metabolism was identified. The purpose of this research was to investigate the possible mechanisms of mycoparasitism, potential active secondary substances (antifungal or antibacterial substances), and gene resources for resistance breeding against fungal diseases using genomic sequencing.
Experimental
Materials and Methods
Microbial material. The aeciospores of A. wenshanense were collected in Kunming, Yunnan Province, People’s Republic of China, in September 2012. The species was mistakenly identified as Aecidium pourthiaea Syd. (Cai and Wu 2008) and has been corrected to A. wenshanense (Zhuang and Wei 2016; Zhu et al. 2020). The aeciospores were incubated on distilled filter paper at 25°C and cultured until mycelium or colony formation was observed. After being cultured for approximately one week, strain PG52 was isolated from the aeciospores, identified as Pestalotiopsis kenyana (Sui et al. 2020), and preserved at Southwest Forest University, Kunming, China.
Mycelial sample preparation. The conidia of Pestalotiopsis sp. PG52 were cultured on modified Fries culture agar. After incubation at room temperature for three days, the mycelium was carefully scraped off and stored in liquid nitrogen for later use.
DNA extraction and WGS library construction.Pestalotiopsis sp. PG52 DNA was extracted using a TIANGEN (Tiangen, Beijing, China) Bacterial Genomic DNA Extraction Kit and sheared into fragments between 100 and 800 bp in size by a Covaris E220 ultrasonicator (Covaris, Brighton, UK). High-quality DNA was selected using AMPure XP beads (Agencourt, Beverly, MA, USA). After repair using T4 DNA polymerase (Enzymatics, Beverly, MA, USA), the selected fragments were ligated at both ends to T-tailed adapters and amplified using KAPA HiFi HotStart ReadyMix (Kapa Biosystems, Wilmington, NC, USA). Then, amplification products were subjected to a single-strand circularization process using T4 DNA ligase (Enzymatics) to generate a single-stranded circular DNA library.
Genome sequencing and assembly. The NGS library was loaded and sequenced on the BGISEQ-500 platform. Raw data are available in the GenBank. The raw reads with a high proportion of Ns (ambiguous bases) and low-quality bases were filtered out using SOAPnuke (v1.5.6) (Chen et al. 2018) with the parameters “-l 15 -q 0.2 -n 0.05 -Q 2 -c 0”. Then, the clean NGS (“Next-generation” sequencing technology) data were assembled using Canu (Koren et al. 2017) with the parameters “-useGrid = false maxThreads = 30 maxMemory = 60 g -nanopore-raw *.fastq -p -d”. BUSCO (v3.0.1) was used to assess the confidence of the assembly with Pestalotiopsis sp. PG52.
Identification of Repetitive Elements and Non-Coding RNA Genes. Repetitive sequences were identified using multiple tools. TEs were identified by aligning against the Repbase (Bao et al. 2015) database using RepeatMasker (v4.0.5) (Tarailo-Graovac and Chen 2009) with parameters “-nolow -no_is -norna -engine wublast” and RepeatProteinMasker (v4.0.5) with parameters “-noLowSimple -pvalue 0.0001” at DNA and protein levels respectively. Meanwhile, the de novo repeat library was detected using RepeatModeler (v1.0.8) and LTR-FINDER (v1.0.6) (Xu and Wang 2007) with default parameters. Based on the de novo identified repeats, repeat elements were classified using RepeatMasker (v4.0.5) (Tarailo-Graovac and Chen 2009) with the same parameters. Furthermore, the tandem repeats were identified using Tandem Repeat Finder (v4.07) (Benson 1999) with parameters “-Match 2 -Mismatch 7 -Delta 7 -PM 80 -PI 10 -Minscore 50 -MaxPeriod 2000”.
For non-coding RNA (ncRNA), the tRNA genes were predicted using tRNAscan-SE (v1.3.1) (Lowe and Eddy 1997) with default parameters. The rRNA fragments were identified using RNAmmer (v1.2). The snRNA and miRNA genes were predicted using CMsearch (v1.1.1) (Cui et al. 2016) with default parameters after aligning against the Rfam database (Kalvari et al. 2018) with a blast (v2.2.30).
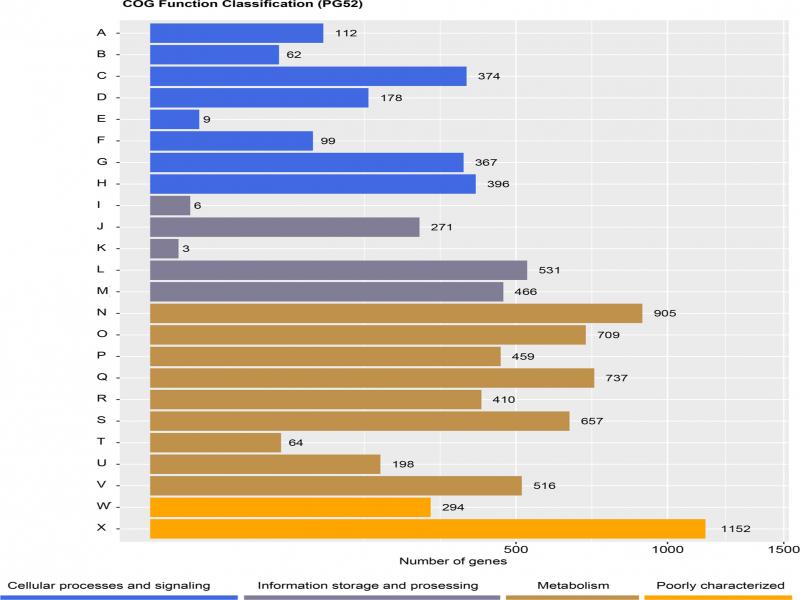
Gene prediction and genome annotation. The predicted genes were aligned to the KEGG (Kanehisa 1997; Kanehisa et al. 2004; Kanehisa et al. 2006), Swiss-Prot (Magrane and UniProt Consortium 2011), COG (Tatusov et al. 1997; 2003), CAZy (Cantarel et al. 2009), NR and GO (Ashburner et al. 2000) databases using blastall (v2.2.26) (Altschul et al. 1990) with the parameters “-p blastp -e 1e-5 -F F -a 4 -m 8”. The Pestalotiopsis sp. PG52 assembly was uploaded to the antiSMASH (v5.0) (Medema et al. 2011) website to identify the secondary metabolite gene cluster.
Transcriptome analysis. In order to define secondary metabolite clusters using transcriptional data, Pestalotiopsis sp. PG52 was inoculated on modified Fries medium for experiment. Abundant secondary metabolites were detected in the study. Total RNA was extracted from tissue samples. The mRNA was purified and then reverse transcribed into cDNA, and the library was constructed according to the large-scale parallel signature scheme. They were then sequenced using Illumina’s technology. The genomic annotation results were compared with transcriptome data, and if mRNA of a gene was detected, the gene was considered to be expressed.
Results
Pestalotiopsissp. PG52 genome extraction and quality inspection. The quality and concentration of the extracted Pestalotiopsis sp. PG52 genomic DNA were measured using a Qubit fluorometer, and then the DNA was subjected to 1% agarose gel electrophoresis. The sample volume was 1 μl. The test results are shown in Fig. 1 and indicate that the extracted genomic DNA had good integrity. BD Image Lab software was used to calculate the amounts of DNA in the electrophoresis image. The total amount of DNA in the samples was 3.78 μg, which meets the requirements for library construction and sequencing; this amount could meet the requirements for two or more samples for library construction.
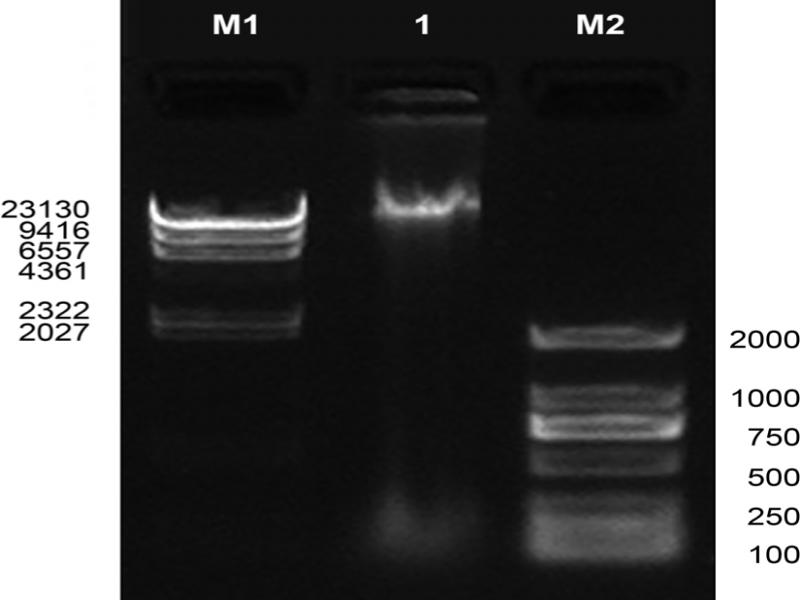
Fig. 1.
Electrophoresis pattern of Pestalotiopsis kenyana PG52 genome. Agarose concentration (%): 1; voltage: 180 V; time: 35 min.; molecular weight standard name: M1: λ-Hind Ш digest (Takara), M2: D2000 (Tiangen); sample volume: M1: 3 μl, M2: 6 μl.
Genomic sequencing quality analysis. Fqcheck software was used to evaluate the quality of the data. Fig. 2 and 3 show the base composition and quality of PG52.
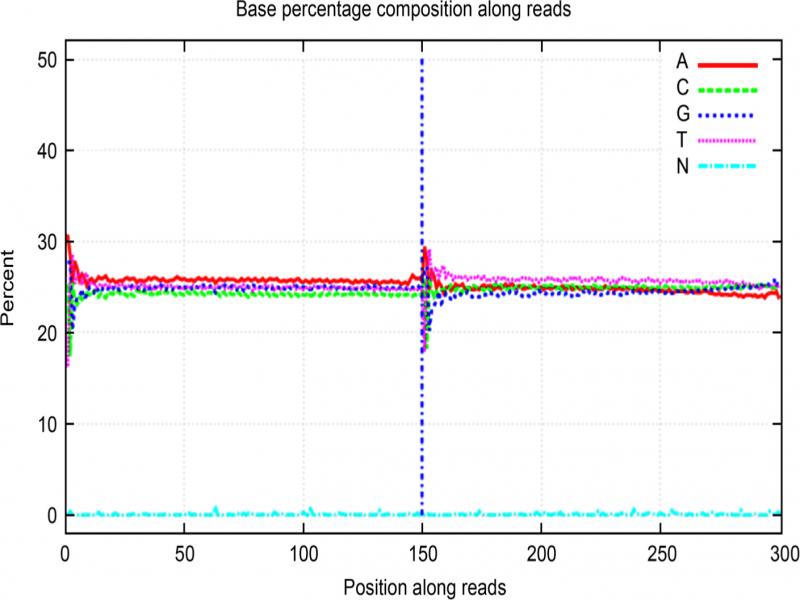
Fig. 2.
Pestalotiopsis kenyana PG52 base composition distribution map. The X axis represents the position on reads, and the Y axis represents the percentage of bases.
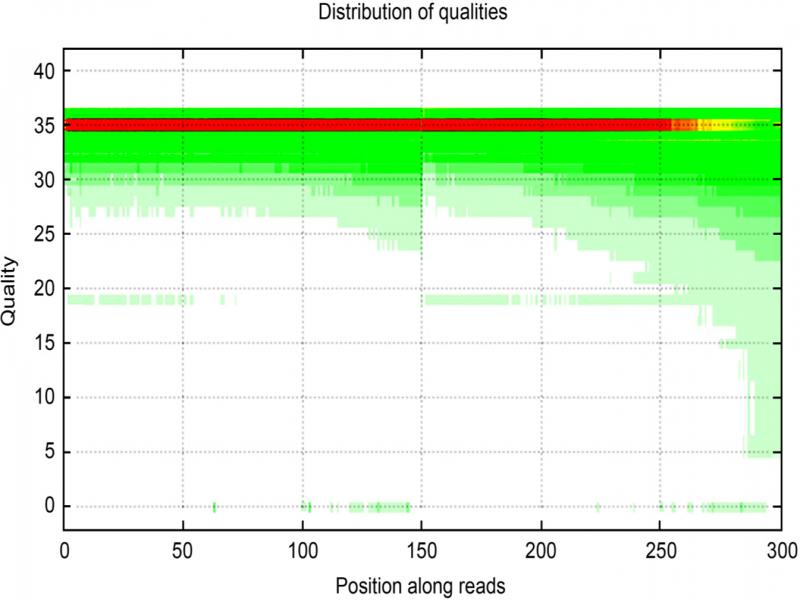
Fig. 3.
Pestalotiopsis kenyana PG52 base mass distribution map. The X axis is the position of the base in reads, and the Y axis is the base quality value. Each point in the figure represents the total number of bases at this position that reach a certain.
The slight fluctuation at the beginning of the curve is typical of the BGI-seq 500 sequencing platform and does not affect the data. Normally, the distribution curves of the A and T and the C and G bases should coincide with each other. If an abnormality occurs in the sequencing process, it may cause abnormal fluctuations in the middle of the curve. If a particular library construction method or library is used, the base distribution may also be changed (Fig. 2).
The base quality distribution reflects the accuracy of the sequencing reads. The sequencer, sequencing reagents, and sample quality can all affect base quality. Overall, the low-quality (< 20) base proportion was low, indicating that the sequencing quality of the lane was relatively good (Fig. 3).
Genome assembly and gene prediction. The long fragment of Pestalotiopsis sp. PG52 was sequenced on the Nanopore platform, and a total of 12.18 Gb of data was generated. Before assembly, k-mer was selected as 15, and k-mer analysis was performed based on the second-generation data to estimate the genome’s size (assembly results indicate the true genome size), degree of heterozygosity, and repeatability. Using Jellyfish software to process the filtered data, the results showed that the genome size of the PG52 strain was 50.7 Mb. We used Canu to assemble the Nanopore data and then with Pilon used the second-generation data for base error correction to obtain the final assembly result. BUSCO integrity assessment was conducted using the genome database (SordariomycetA_ODB9). More than 97.0% of core genes could be annotated in the genome, reflecting the high integrity of assembly results. A total of 335 scaffolds were assembled by genome stitching. The genome size was 58.01 Mbp, and the values of N50 and N90 were 6,598,051 bp and 55,791 bp, respectively. The entire genome’s size was larger than those of the Pestalotiopsis fici (51.91 Mbp), Pestalotiopsis sp. JCM 9685 (48.23 Mbp) and Pestalotiopsis sp. NC0098 (46.41 Mbp) genomes, which have been sequenced.
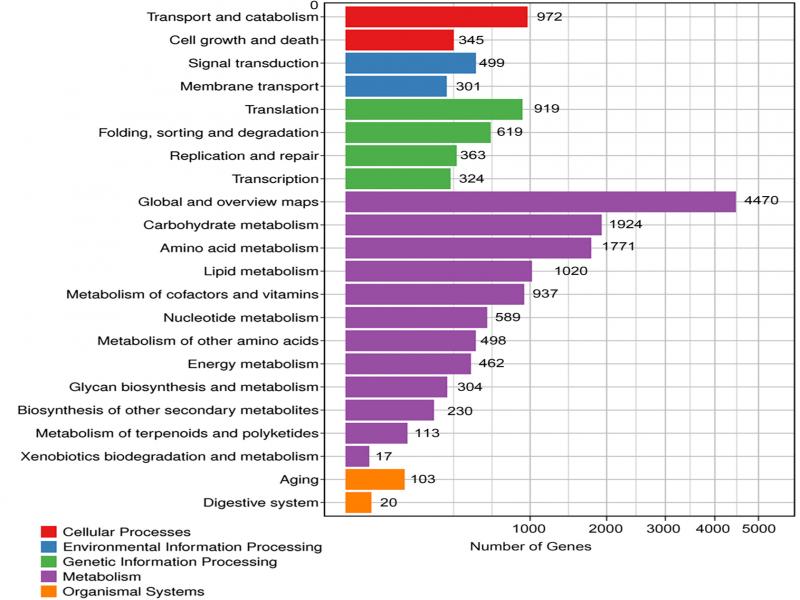
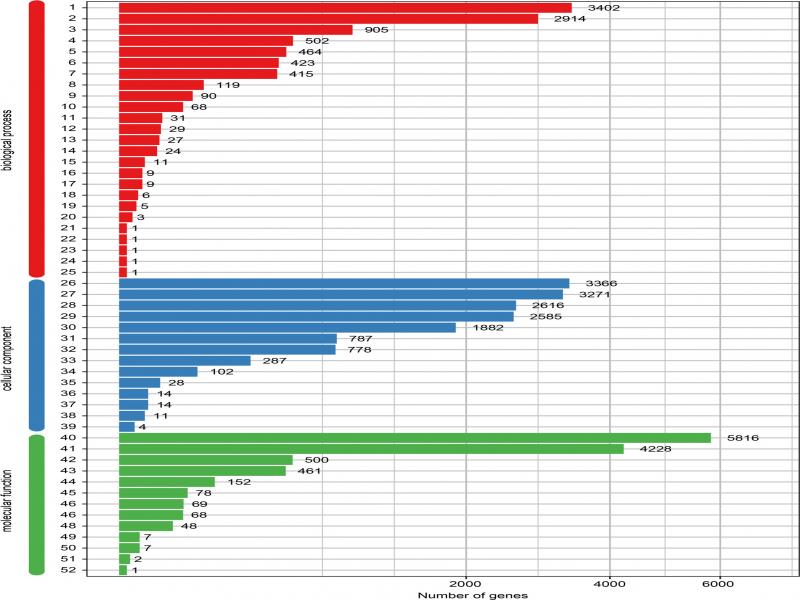
A total of 20,023 genes were predicted in the Pestalotiopsis sp. PG52 genome, with an average length of 1,714.03 bp, an average CDS length of 1,478.29 bp, an average of 3.13 exons per gene, an average exon length of 472.00 bp, and an average intron length of 110.57 bp. The reported average length of the predicted genes of P. fici (Wang et al. 2015) is 1,683.88 bp, and the average number of exons contained in each gene is 3. Another reported average length of the predicted genes of Pestalotiopsis sp. NC0098 is 1864 bp, and the average number of exons contained in each gene is 2.83. The above comparison results indicate the reliability of the sequencing data for the Pestalotiopsis sp. PG52 genome and the similarity to the other two Pestalotiopsis strain genomes (Table I).
Table I
The comparison of Pestalotiopsis genome sequences.
| PG52 | FICI | NC0098 | ||||
|---|---|---|---|---|---|---|
| Assembly size (Mb) | 55 | 52 | 46.61 | |||
| Scaffold N50 (Mb) | 6.6 | 4.0 | 5 | |||
| Coverage (fold) | 335.0 | 24.5 | 24 | |||
| GC content (%) | 53.30 | 48.73 | 51.28 | |||
| Protein-coding genes | 20,023 | 15,413 | 15,180 | |||
| Gene density (genes per Mb) | 345.22 | 296.90 | 327.08 | |||
| Exons per gene | 3.13 | 2.76 | 2.83 |
| Species | GH18 | GH75 | GH17 | GH55 | GH64 | GH81 |
|---|---|---|---|---|---|---|
| Pestalotiopsis sp. PG52 | 3 | 6 | 7 | 19 | 3 | 2 |
| Trichoderma harzianum | 20 | 4 | 4 | 5 | 3 | 2 |
| Trichoderma atroviride | 29 | 5 | 5 | 8 | 3 | 2 |
| Trichoderma virens | 36 | 5 | 4 | 10 | 3 | 1 |
| Secondary metabolites | Pestalotiopsis sp. PG52 | P. fici | Pestalotiopsis sp. NC0098 | T. harzianum | T. atroviride | T. virens |
|---|---|---|---|---|---|---|
| NRPS | 13 | 12 | 12 | 17 | 16 | 28 |
| PKS | 102 | 27 | 21 | 27 | 18 | 18 |
| Total | 115 | 39 | 33 | 44 | 34 | 46 |
| Pestalotiopsis sp. PG52 | T. harzianum | T. atroviride | T. virens | |
|---|---|---|---|---|
| Cytochrome P450 | 317 | 50 | 15 | 40 |
| Zn2/Cys6 transcription factor | 4 | 7 | 69 | 95 |
| Protease | 175 | 53 | 23 | 28 |
| Genes | Transcription groups | Genome | Expression rate |
|---|---|---|---|
| PKS | 82 | 102 | 80.39% |
| NRPS | 10 | 13 | 76.92% |
| Protease | 137 | 175 | 78.29% |
| Cytochrome P450 | 245 | 317 | 77.29% |
| Zn2Cys6 transcription factor | 1 | 4 | 25.00% |