
Table I
List of primer sequences for qPCR.
| Gene | Forward primer (5’→3’) | Reverse primer (5’→3’) | Gene accession number |
|---|---|---|---|
| ACTB | CTCGGCTGTGGTGGTGAA | CCATCTATGAAGGCTACGC | AB495648 |
| Hsp70 | TGGTGGGAATGGTGGTGTTAC | ATCTGCTCCTGTTGGATGTCA | MH422508.1 |
| Hsp90 | CAGCAGCAGTATCATCTTCATC | CCTGTCCTCTGGCTTTAGTTT | NM001109785.1 |
| NF-kB1 | AGTTCAGGATGCACCAAGAGT | AGTCAACGCAGGACCTAAAGA | GGAF000241 |
| NF-KB2 | TGACGGTGGGATAGGTCTTGT | CTGCCTGGATGGGATTGACTA | U00111 |
| IL-6 | CCTAGAAGGAAATGAGAATGCCTAT | CGTTTATGGAGAAGACCGTGAG | AJ309540 |
| TNF-α | GCTTACTTCCCTTCTTCTCC | TCTACATCTGACCCATCCC | XM015284187 |
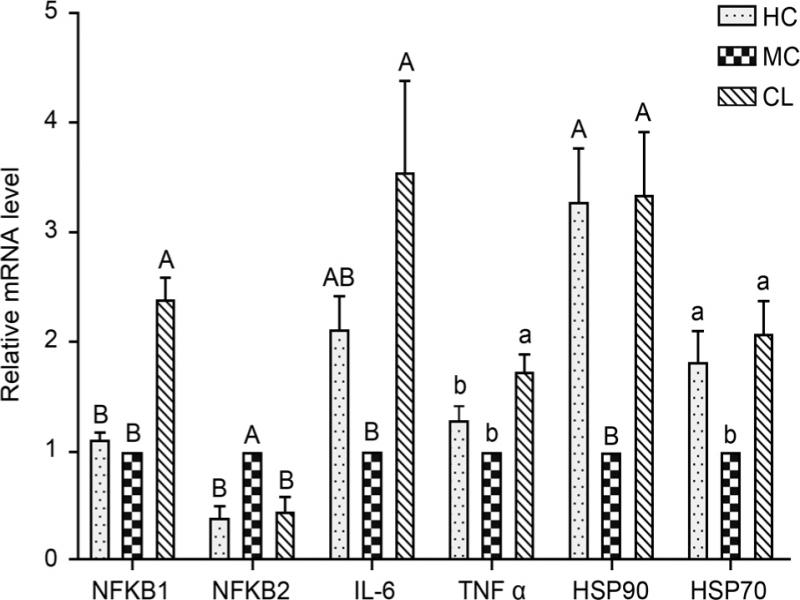
Fig. 1.
The relative mRNA expression level of heat shock proteins and inflammation-related genes in the liver of chickens. Different uppercase and lowercase letters indicate the significance of difference at p < 0.01 and p < 0.05, respectively. The same letters indicate no significant difference.
Table II
Library diversity of the 16S rRNA genes from the chicken cecum1.
| Group ID | HC | MC | LC |
|---|---|---|---|
| OTUs | 292 ± 22.70 | 297 ± 42.57 | 271 ± 52.59 |
| Chao1 | 334.06 ± 22.72ab | 351.67 ± 44.98a | 316.75 ± 45.95b |
| Observed species | 289.16 ± 22.77 | 294.25 ± 42.11 | 267.66 ± 53.71 |
| Shannon | 4.93 ± 0.43 | 4.62 ± 0.64 | 4.83 ± 1.01 |
| Simpson | 0.91 ± 0.03 | 0.86 ± 0.05 | 0.89 ± 0.11 |
| PD whole tree | 17.32 ± 1.18 | 17.83 ± 2.11 | 16.64 ± 2.88 |
| Good’s Coverage | 0.9983 ± 0.0001 | 0.9981 ± 0.0002 | 0.9983 ± 0.0002 |
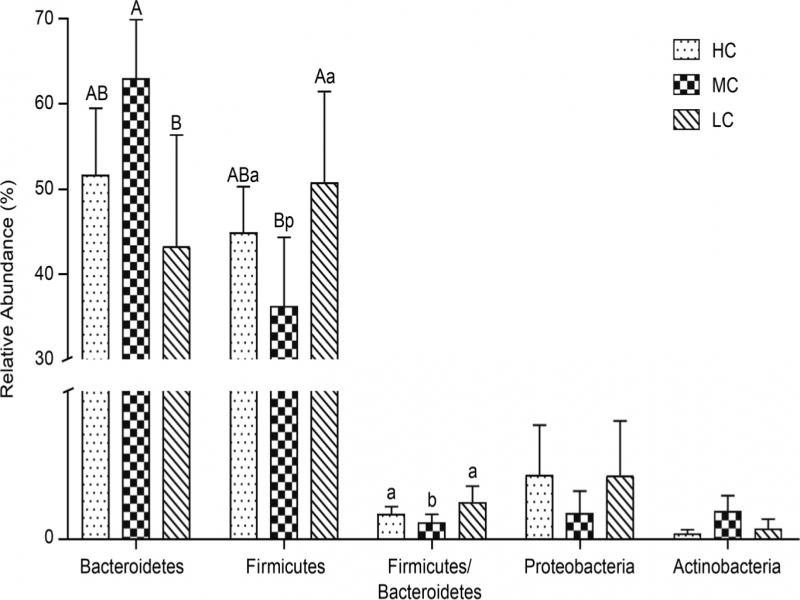
Fig. 2.
Composition of the dominant microbiome at the phylum level. Different uppercase and lowercase letters indicate significant differences at p < 0.01 and p < 0.05, respectively. The same letters indicate no significant difference.
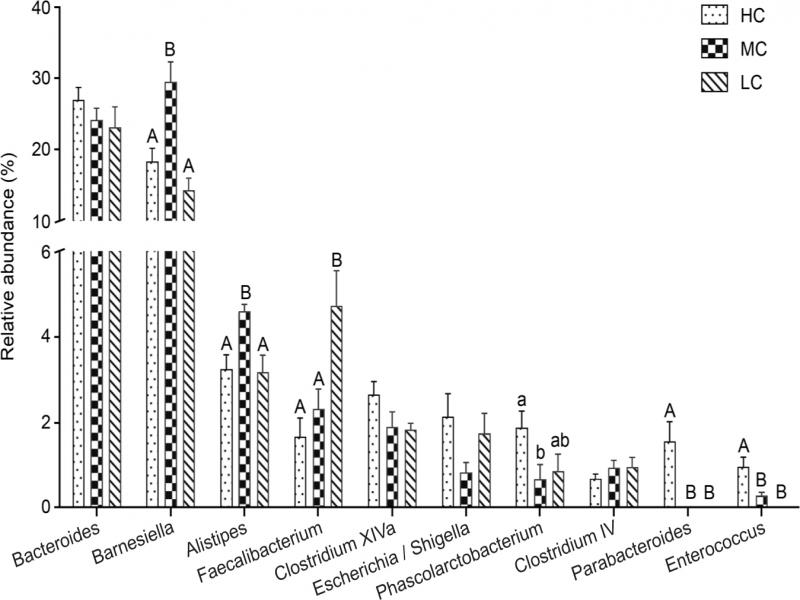
Fig. 3.
Composition of the dominant microbiome at the genus level. Different uppercase and lowercase letters indicate significant differences at p < 0.01 and p < 0.05, respectively. The same letters indicate no significant difference.
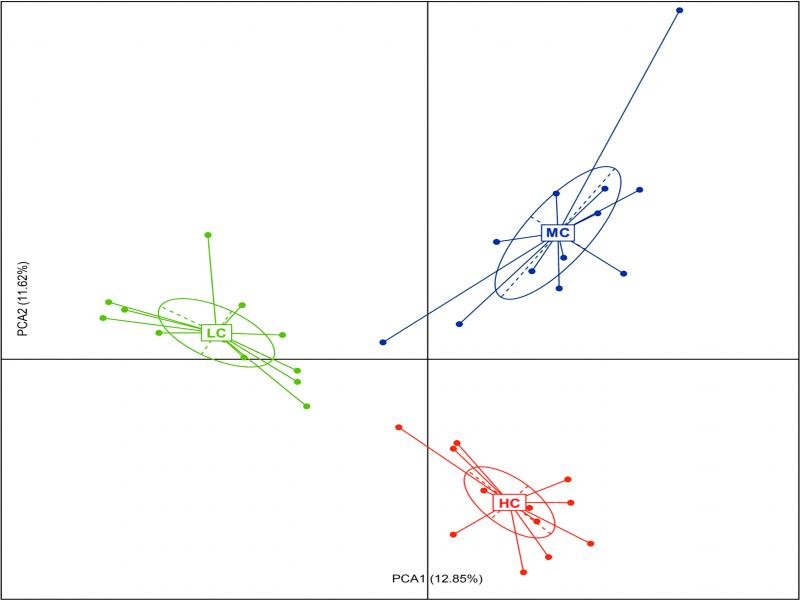
Fig. 4.
The effects of ambient temperatures on the caecal microbial communities. Principal component analysis (PCA) of the abundance profiling of microbes based on OTUs.
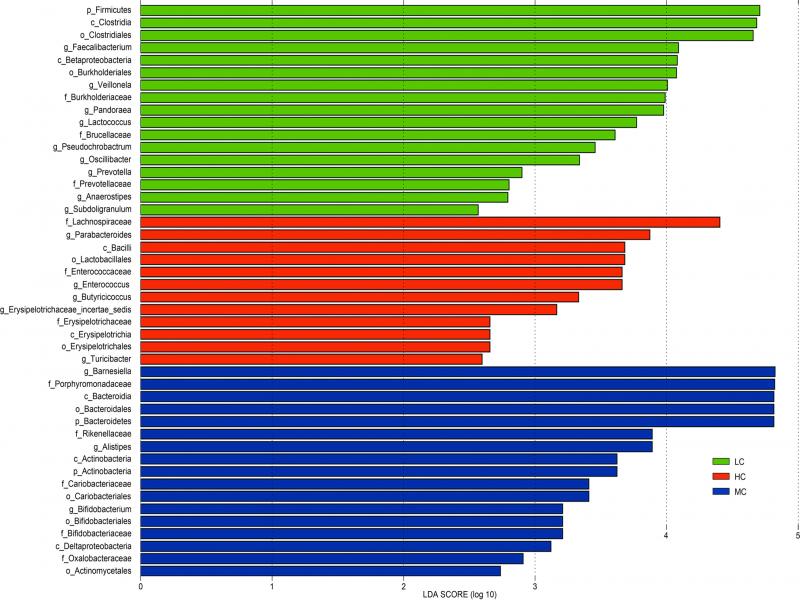
Fig. 5.
LEfSe identified the most differentially abundant microbiota between HC, MC, and LC groups.
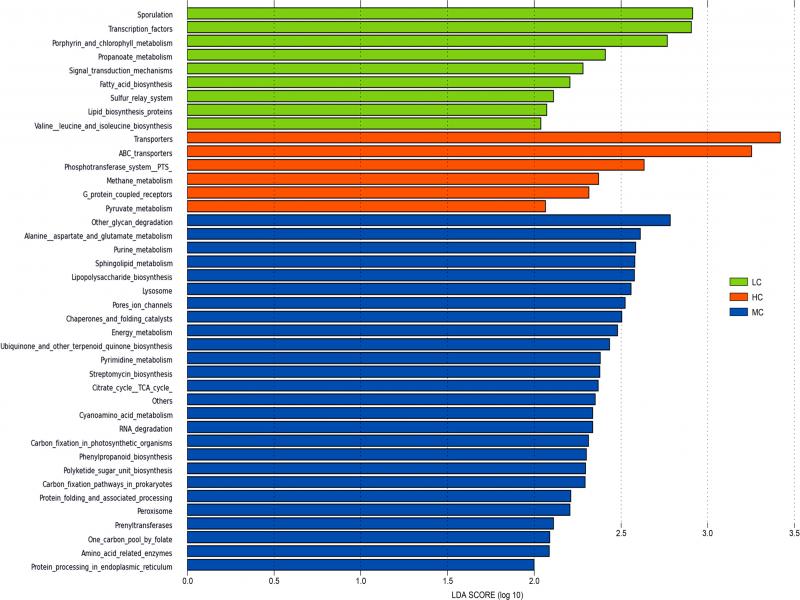
Fig. 6.
KEGG enrichment analyses of the caecal microbial taxa from the HC, MC, and LC groups at the L3 hierarchy.