
Fig. 1.
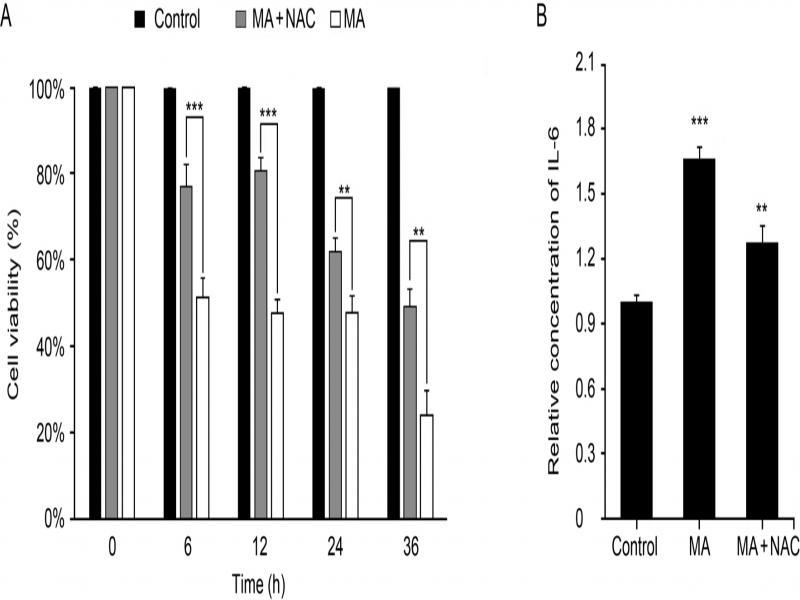
Fig. 2.
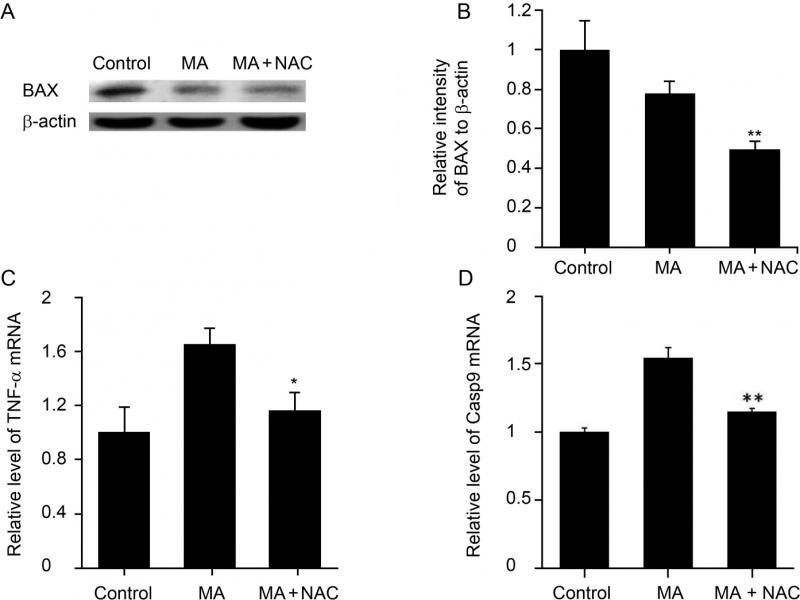
Fig. 3.
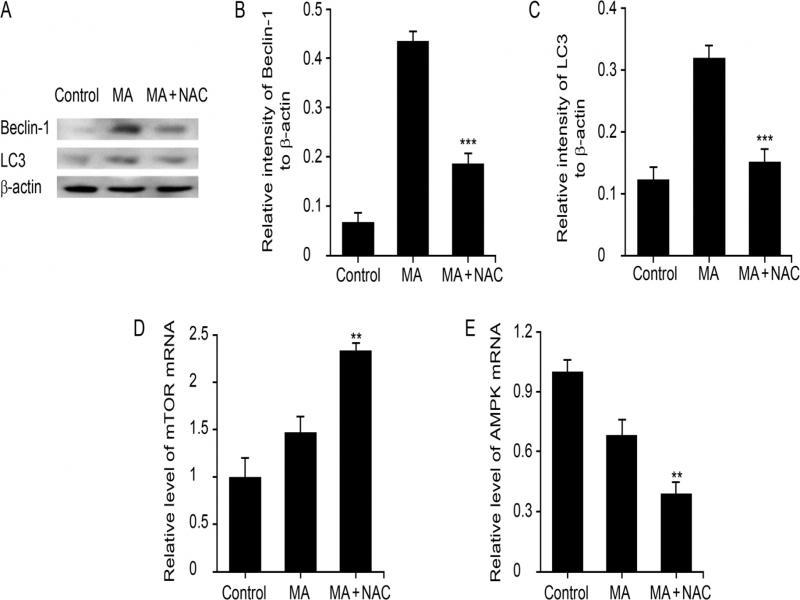
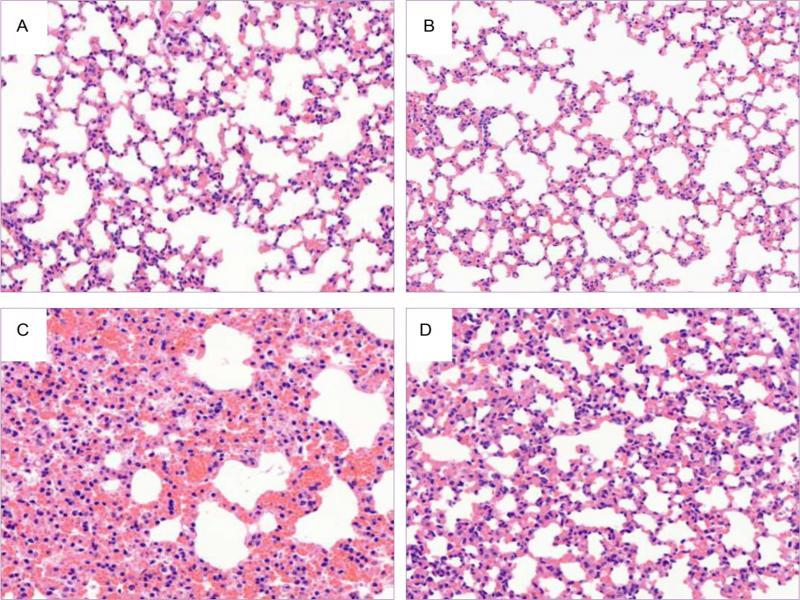
Fig. 4.
Primer sequences_
| Gene name | Forward primer | Reverse primer |
|---|---|---|
| TNF-α | CGCTGAGGTCAATCTGC | GGCTGGGTAGAGAATGGA |
| Caspase-9 | AGCGATTCTGCCTTTCAC | TGGAGATTTTGTGGTCAGC |
| mTOR | CTGGGGCTGCTTTCTGT | ACGGTTTTCTGCCTCTTGT |
| AMPK | CATCCCCAAACCTGTCC | ACAAGCCCCGAACAAAA |