
Fig. 1.

Fig. 2.
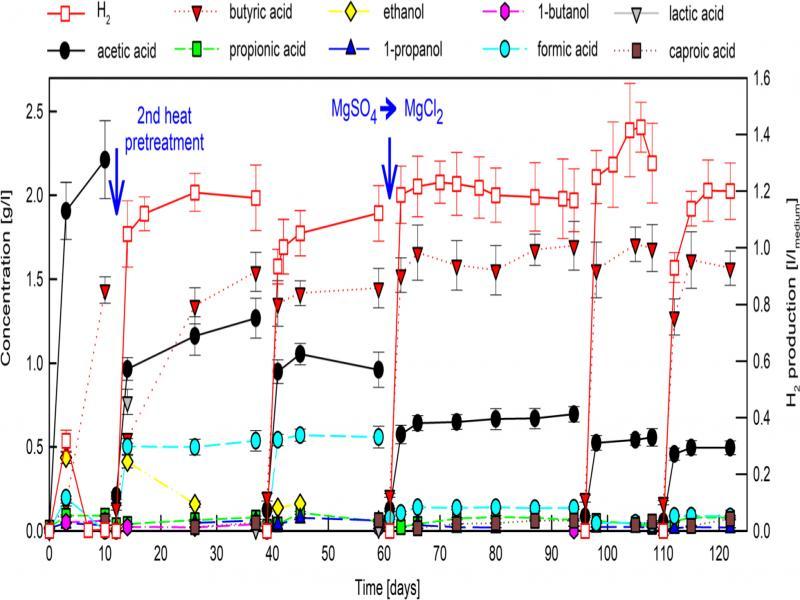
Fig. 3.
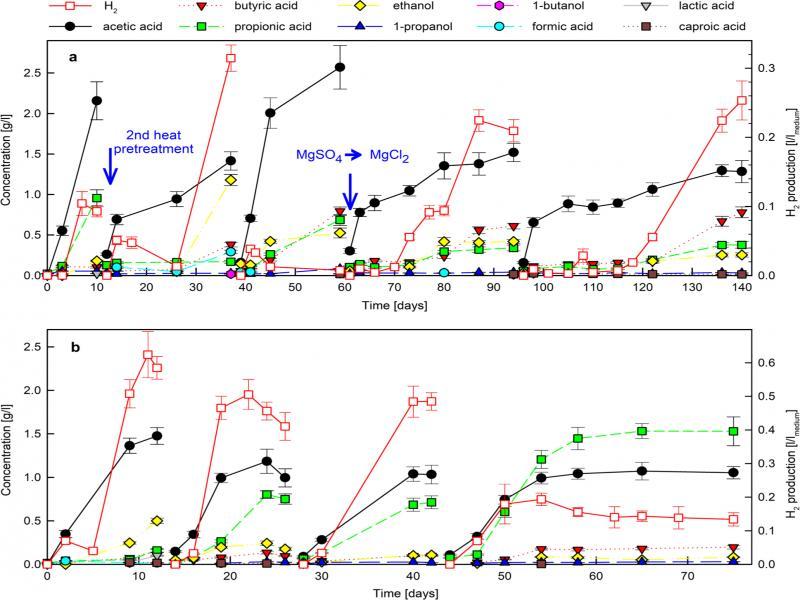
Fig. 4.
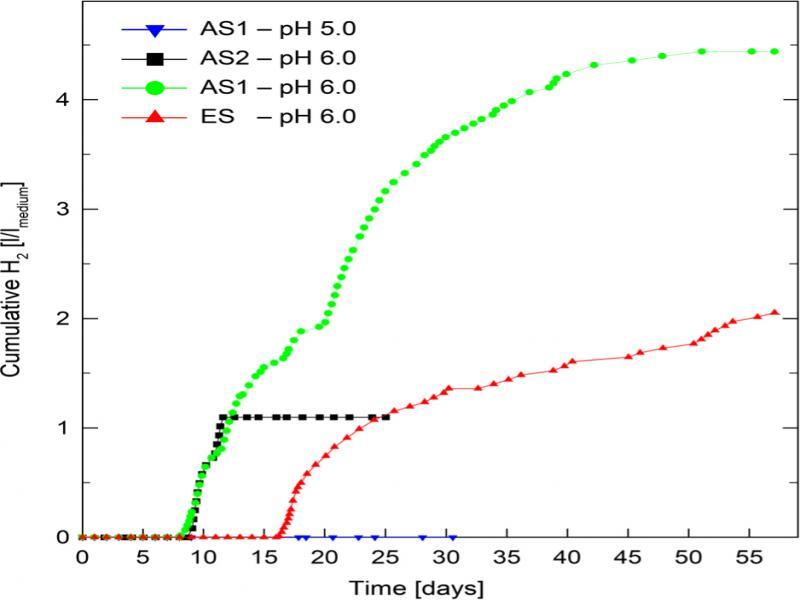
Fig. 5.
The main anaerobic bioreactions during hydrogen fermentation form glucose with corresponding standard Gibbs free energies_
| ΔG° [kJ] | Eq. No. | |
|---|---|---|
| Reaction | ||
| Acetate: C2H12O6 + 2H2O = > 2CH3COOH + 4H2 + 2CO2 | −206 | 1 |
| Butyrate: C6H12O6 = > CH3CH2CH2COOH + 2H2 + 2CO2 | −254 | 2 |
| Lactate: C6H12O6 = > 2CH3CHOHCOOH + H+ | −225.4 | 3 |
| Ethanol: C6H12O6 = > 2CH3CH2OH + 2CO2 | −164.8 | 4 |
| Hydrogen consuming reactions | ||
| Homoacetogenesis: 4H2 + 2CO2 = > CH3COOH + 2H2O | −104 | 5 |
| Methanogenic reactions: 4H2 + CO2 = > CH4 + 2H2O | −135 | 6 |
| Sulfidogenic reactions: SO4 2- + 4H2 + H+ = > HS- + 4H2O | −152.2 | 7 |
| Propionate production: C6H12O6 + 2H2 = > 2CH3CH2COOH + 2H2O | −279.4 | 8 |
Comparison of the hydrogen production processes using untreated cellulosic material at mesophilic conditions_
| Inoculum | Inoculum pretreatment | Cellulosic substrate | Conc. [g/l] | Temp. [°C] | pH initial (final) | SRE [%] | Culture conditions | Main metabolites | HPR [ml/l-h] | H2 yield [mol H2/molhexose | Ref. |
|---|---|---|---|---|---|---|---|---|---|---|---|
| Sewage sludge digester | No pretreatment | Cellulose | 5.0 | 37 | 5.90 (5.90) | 61 | Continuous | 0.3 | 0.10 | Butyrate > acetate > valerate | (Gadow et al. 2012) |
| Anaerobic digester sludge | 70°C (30 min) | α-Cellulose | 13.5a | 37 | 5.5 (5.1) | NR | Batch | 5 | 0.13 | Propionate > butyrate > acetate | (Gupta et al. 2014) |
| Clostridium lentocellum | No pretreatment | Carboxymethyl cellulose | 5 | 37 | 7.0 | 49 | Batch | 50.4 | 5.42d | Acetate > butyrate > ethanol | (Zhang et al. 2019) |
| Cow dung compost | No pretreatment | Microcrystalline cellulose | 10 | 37 | 6.8 (4.2) | 55 | Batch | 33 | 2.09 | Acetate > butyrate > lactate = ethanol | (Ren et al. 2010) |
| Anaerobic digester sludge | No pretreatment | Carboxymethyl cellulose | 4 | 30 | 7.0 (NR) | NR | Batch | NR | 1.72d | Butyrate > acetate > ethanol > lactate | (Ho et al. 2012) |
| Anaerobic digester sludge | 100°C (20 min) | Microcrystalline cellulose | 5 | 32 | 6.0 (6.0) | 60 | Repeated fed-batch | 2.3 | 0.63–1.04 | Acetate > butyrate > propionate | This study |
| Anaerobic digester sludge | 100°C (20 min) | Microcrystalline cellulose | 25 | 32 | 6.5 (5.7) | 82 | Batch | 3.94 | 0.97 | Acetate > ethanol | This study |
| Clostridum sartagoforme FZll | No pretreatment | Microcrystalline cellulose | 10 | 35 | 7.0 (NR) | 83.2 | Batch | 7.5c | 0.53 | NR | (Zhang et al. 2015) |
| Clostridium acetobutylicum X9 + Ethanoigenens harbinense B2 | No pretreatment | Microcrystalline cellulose | 12 | 37–40 | 6.0 (NR) | 86 | Batch | NR | 1.7 | Ethanol > acetate > butyrate | (Bao et al. 2016) |
| Clostridium termitidis + Clostridium beijerinckii | No pretreatment | Cellulose | 2 | 37 | 7.2 | 93 | Batch | 2.17 | 1.92 | Acetate > ethanol >lactate | (Gomez-Flores et al. 2017) |
Hydrogen and CO2 production, hydrogen yield, an average hydrogen production rate (HPR), substrate removal efficiency (SRE), and final pH in repeated batch processes from starch (S) and cellulose (C) with inoculum pretreated at 90 or 100°C_
| Process | Cycle no. | Final H2 production [l/lmedium] | Final CO2 production [l/lmedium] | H2 yield [mol H2/molhexose] | Average HPR [ml H2/l/h] | SRE [%] | Final pH | Carbon recovered in metabolites [%] |
|---|---|---|---|---|---|---|---|---|
| S – 90°C | 1 | 0 | 0.478 ± 0.056 | 0 | 0 | 100 | 5.70 ± 0.12 | 81 |
| 2 | 0 | 0.484 ± 0.032 | 0 | 12.2 ± 1.1 | 100 | 5.16 ± 0.14 | 74 | |
| C – 90°C | 1 | 0 | 0.42 ± 0.047 | 0 | 0.2 ± 0.1 | 95 ± 3 | 5.50 ± 0.10 | 75 |
| 2 | 0 | 0.65 ± 0.038 | 0 | 0.5 ± 0.1 | 94 ± 3 | 5.71 ± 0.07 | 87 | |
| S – 100°C | 1 | 0.003 ± 0.001 | 0.607 ± 0.040 | 0.01 ± 0.001 | 4.4 ± 0.3 | 100 | 4.60 ± 0.11 | 81 |
| 2 | 1.175 ± 0.115 | 0.917 ± 0.079 | 1.60 ± 0.16 | 21.8 ± 2.0 | 100 | 5.05 ± 0.08 | 58 | |
| 3 | 1.121 ± 0.097 | 0.961 ± 0.050 | 1.53 ± 0.13 | 14.9 ± 1.2 | 100 | 5.90 ± 0.05 | 51 | |
| 4 | 1.167 ± 0.111 | 0.775 ± 0.074 | 1.59 ± 0.15 | 24.7 ± 2.2 | 100 | 5.05 ± 0.05 | 52 | |
| 5 | 1.298 ± 0.140 | 0.838 ± 0.086 | 1.77 ± 0.19 | 26.0 ± 1.9 | 100 | 5.05 ± 0.04 | 48 | |
| 6 | 1.200 ± 0.098 | 0.771 ± 0.059 | 1.63 ± 0.13 | 15.8 ± 1.2 | 100 | 5.05 ± 0.07 | 46 | |
| C – 100°C | 1 | 0.093 ± 0.006 | 0.549 ± 0.061 | 0.14 ± 0.01 | 0.6 ± 0.1 | 90 ± 2 | 5.30 ± 0.12 | 75 |
| 2 | 0.314 ± 0.019 | 0.892 ± 0.056 | 0.48 ± 0.03 | 0.5 ± 0.1 | 89 ± 1 | 5.95 ± 0.12 | 62 | |
| 3 | 0.007 ± 0.001 | 0.828 ± 0.097 | 0.01 ± 0.001 | 0.5 ± 0.1 | 95 ± 2 | 5.63 ± 0.11 | 85 | |
| 4 | 0.201 ± 0.023 | 0.456 ± 0.035 | 0.33 ± 0.04 | 0.4 ± 0.1 | 84 ± 3 | 5.40 ± 0.07 | 59 | |
| 5 | 0.253 ± 0.028 | 0.415 ± 0.047 | 0.39 ± 0.04 | 0.3 ± 0.1 | 89 ± 4 | 5.52 ± 0.08 | 50 | |
| C – 100°C (without SO/4 2-) | 1 | 0.585 ± 0.033 | 0.532 ± 0.042 | 0.97 ± 0.05 | 2.3 ± 0.2 | 82 ± 2 | 5.70 ± 0.04 | 56 |
| 2 | 0.410 ± 0.041 | 0.379 ± 0.028 | 0.71 ± 0.07 | 2.6 ± 0.3 | 79 ± 1 | 4.90 ± 0.05 | 39 | |
| 3 | 0.485 ± 0.026 | 0.323 ± 0.022 | 0.93 ± 0.05 | 1.3 ± 0.2 | 71 ± 3 | 4.95 ± 0.09 | 41 | |
| 4 | 0.135 ± 0.014 | 0.337 ± 0.023 | 0.23 ± 0.02 | 1.3 ± 0.2 | 80 ± 2 | 5.02 ± 0.07 | 54 |
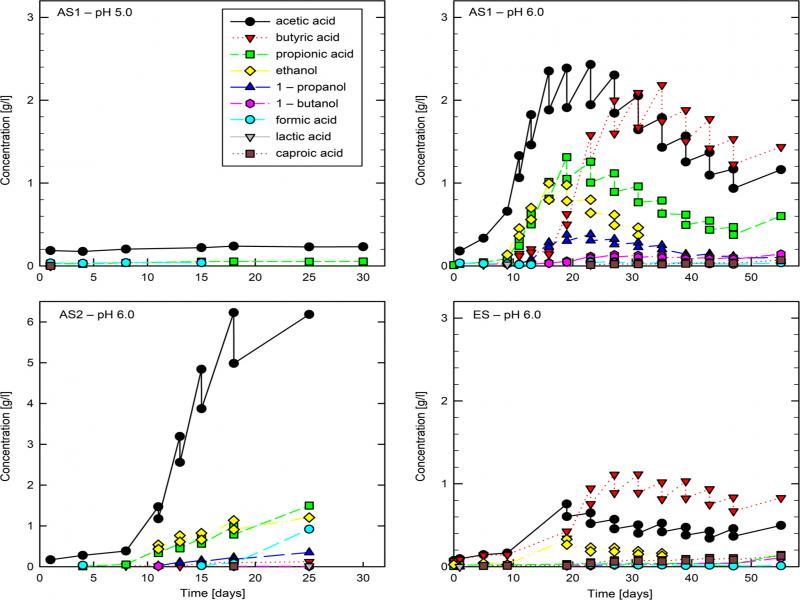
Hydrogen yield in repeated fed-batch processes of hydrogen production from cellulose_
| Inoculum | Hydrogen yield [mol H2/molhexose] after | |||
|---|---|---|---|---|
| 1 feeding cycle | 2 feeding cycle | 5 feeding cycle | 9 feeding cycle | |
| AS1 – pH 6.0 | 1.04 | 0.83 | 0.75 | 0.63 |
| AS2 – pH 6.0 | 0.67 | 0.75 | 0.30 | – |
| ES – pH 6.0 | 0.79 | 0.67 | 0.39 | 0.27 |