
Table I
Sequences of primers for the genes selected for transcript analysis using quantitative RT-PCR.
| Gene | Orientation | Sequence (5′–3′) | Reference |
|---|---|---|---|
| ACT1 | F | TTGGTGATGAAGCCCAATCC | Chau et al. 2004 |
| R | CATATCGTCCCAGTTGGAAACA | ||
| MDR1 | F | TTACCTGAAACTTTTGGCAAAACA | Chau et al. 2004 |
| R | ACTTGTGATTCTGTCGTTACCG | ||
| CDR1 | F | TTTAGCCAGAACTTTCACTCATGATT | Chau et al. 2004 |
| R | TATTTATTTCTTCATGTTCATATGGATTGA | ||
| CDR2 | F | GGTATTGGCTGGTCCTAATGTGA | Chau et al. 2004 |
| R | GCTTGAATCAAATAAGTGAATGGATTAC |
Table II
Demographic profile of candiduric patients.
| Demographic variables | ||||||||||||
|---|---|---|---|---|---|---|---|---|---|---|---|---|
| Sex | Age group (years) | |||||||||||
| Male | Female | 30–40 | 41–50 | 51–60 | 61– > 70 | |||||||
| n | % | n | % | n | % | n | % | n | % | n | % | |
| Candida albicans (n = 18) | 11 | 61.1 | 7 | 38.9 | 0 | 0 | 6 | 33.3 | 1 | 5.6 | 11 | 61.1 |
| Non-albicans Candida isolates (n = 10) | 5 | 50 | 5 | 50 | 1 | 10 | 3 | 30 | 1 | 10 | 5 | 50 |
| Total (n = 28) | 16 | 57.1 | 12 | 42.9 | 1 | 3.6 | 9 | 32.1 | 2 | 7.1 | 16 | 57.1 |
Table III
Identification, virulence determinants, and the minimum inhibitory concentration (MIC) of fluconazole against the Candida spp. isolates tested.
| Isolate code | Candida species | Virulence determinants | MIC of Fluconazole (μg/ml) c | ||
|---|---|---|---|---|---|
| Biofilm formation | Proteases production Pz value a | Phospholipase production Pz value b | |||
| C1 | C. tropicalis | Strong | 0.26 | 0.33 | 128 |
| C2 | C. albicans | Strong | 0.4 | 0.48 | 16 |
| C3 | C. albicans | Strong | 0.16 | 0.29 | 8 |
| C4 | C. albicans | Strong | 0.19 | 0.29 | 32 |
| C5 | C. albicans | Strong | 0.2 | 1 | 8 |
| C6 | C. albicans | Strong | 0.2 | 0.3 | 1024 |
| C7 | C. tropicalis | Strong | 0.22 | 0.23 | 128 |
| C8 | C. glabrata | Weak | 0.18 | 0.21 | 1024 |
| C9 | C. glabrata | Weak | 0.67 | 0.22 | 1024 |
| C10 | C. glabrata | Moderate | 0.5 | 0.2 | 32 |
| C11 | C. albicans | Strong | 0.26 | 0.26 | 16 |
| C12 | C. glabrata | Moderate | 0.43 | 0.23 | 32 |
| C13 | C. albicans | Strong | 0.4 | 0.2 | 8 |
| C14 | C. albicans | Strong | 0.26 | 0.3 | 256 |
| C15 | C. albicans | Strong | 0.24 | 0.24 | 16 |
| C16 | C. albicans | Strong | 0.24 | 0.24 | 8 |
| C17 | C. albicans | Strong | 0.15 | 0.27 | 1024 |
| C18 | C. glabrata | Moderate | 0.25 | 0.21 | 8 |
| C19 | C. albicans | Weak | 0.15 | 0.67 | 2 |
| C20 | C. albicans | Strong | 0.14 | 0.31 | 1024 |
| C21 | C. albicans | Strong | 0.17 | 0.4 | 1024 |
| C22 | C. albicans | Weak | 0.15 | 0.39 | 1 |
| C23 | C. albicans | Strong | 0.18 | 0.32 | 1024 |
| C24 | C. albicans | Strong | 0.17 | 0.41 | 8 |
| C25 | C. glabrata | Weak | 0.17 | 0.23 | 8 |
| C26 | C. glabrata | Moderate | 0.2 | 0.16 | 256 |
| C27 | C. albicans | Strong | 0.16 | 0.32 | 16 |
| C28 | C. famata | Strong | 0.16 | 0.4 | 128 |
Table IV
Fluconazole susceptibility of different Candida spp.
| Candida species | Fluconazole susceptibility n (%) | MIC50 | MIC90 | MIC range (μg/ml) | |
|---|---|---|---|---|---|
| S | R | ||||
| Candida albicans (n = 18) | 12 (66.7%) | 6 (33.3%) | 16 | 1024 | 1–1024 |
| Non-albicans Candida isolates (n = 10) | 4 (40%) | 6 (60%) | 128 | 1024 | 8–1024 |
| Candida glabrata (n = 7) | 4 (57.1%) a | 3 (42.9%) | 32 | 1024 | 8–1024 |
| Candida tropicalis (n = 2) | 0 (0%) a | 2 (100%) | 128 b | ND c | ND |
| Candida famata (n = 1) | 0 (0%) a | 1 (100%) | ND | ND | ND |
Table V
Resistance-modulating effect of amikacin (4000 μg/ml) on fluconazole-resistant Candida clinical isolates.
| Isolate code | Candida species | MIC of fluconazole alone (μg/ml) | MIC of fluconazole (μg/ml) in the presence of amikacin | Modulation factor (MF) a |
|---|---|---|---|---|
| C1 | C. tropicalis | 128 | 4 | 32 |
| C6 | C. albicans | 1024 | 4 | 256 |
| C7 | C. tropicalis | 128 | 4 | 32 |
| C8 | C. glabrata | 1024 | 32 | 32 |
| C9 | C. glabrata | 1024 | 32 | 32 |
| C14 | C. albicans | 256 | 4 | 64 |
| C17 | C. albicans | 1024 | 4 | 256 |
| C20 | C. albicans | 1024 | 4 | 256 |
| C21 | C. albicans | 1024 | 4 | 256 |
| C23 | C. albicans | 1024 | 4 | 256 |
| C26 | C. glabrata | 256 | 256 | 1 |
| C28 | C. famata | 128 | 4 | 32 |
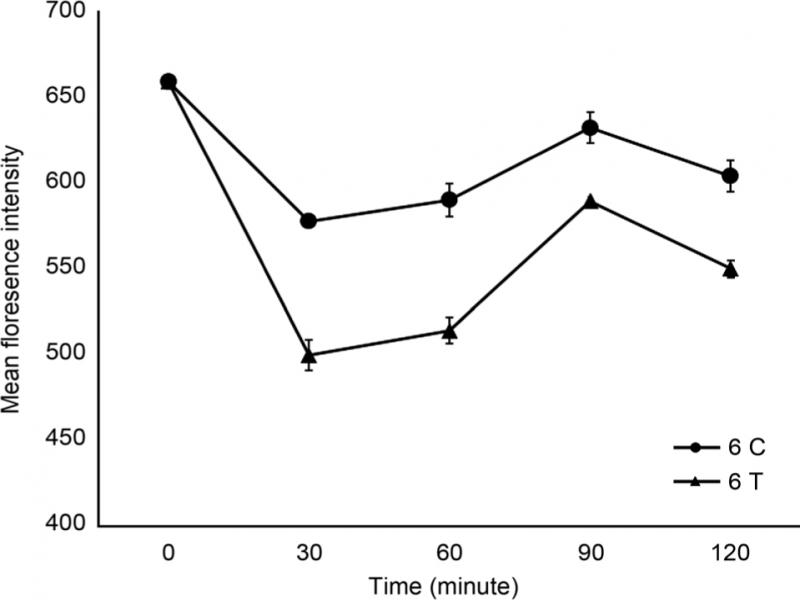
Fig. 1.
Inhibitory effect of amikacin (4,000 μg/ml) on the efflux of rhodamine in fluconazole-resistant Candida albicans (C6).
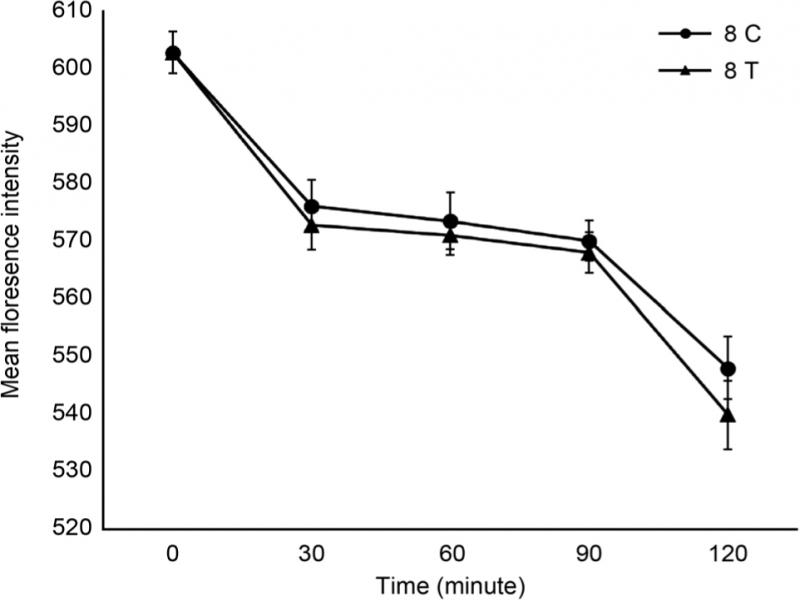
Fig. 2.
Inhibitory effect of amikacin (4,000 μg/ml) on the efflux of rhodamine in fluconazole-resistant Candida glabrata (C8).
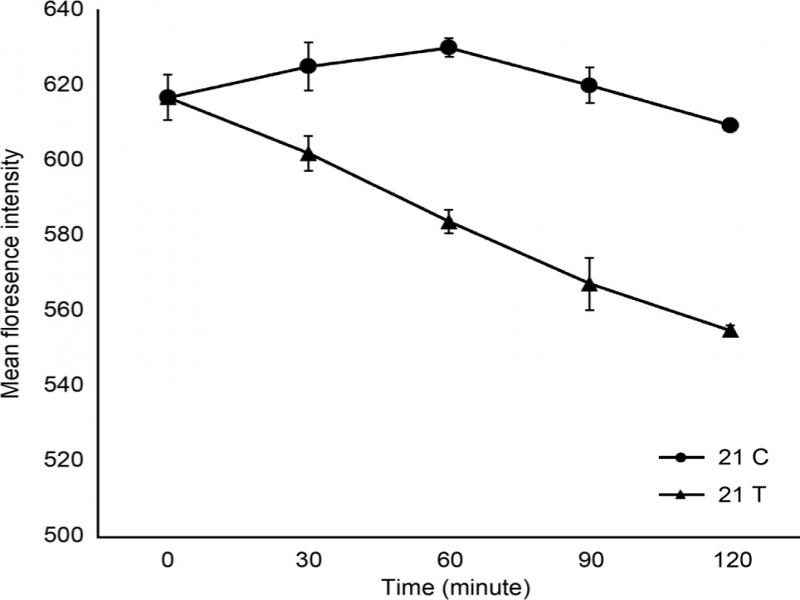
Fig. 3.
Inhibitory effect of amikacin (4,000 μg/ml) on the efflux of rhodamine in fluconazole-resistant Candida albicans (C21).
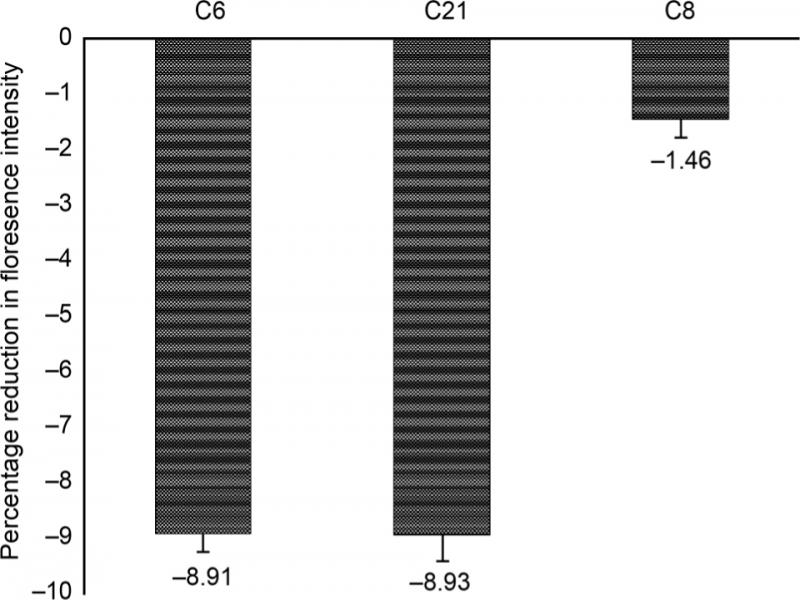
Fig. 4.
Percentage of reduction in the rhodamine fluorescence intensity after 120 minutes of amikacin (4,000 μg/ml) treatment of C6, C21 and C8 Candida isolates.
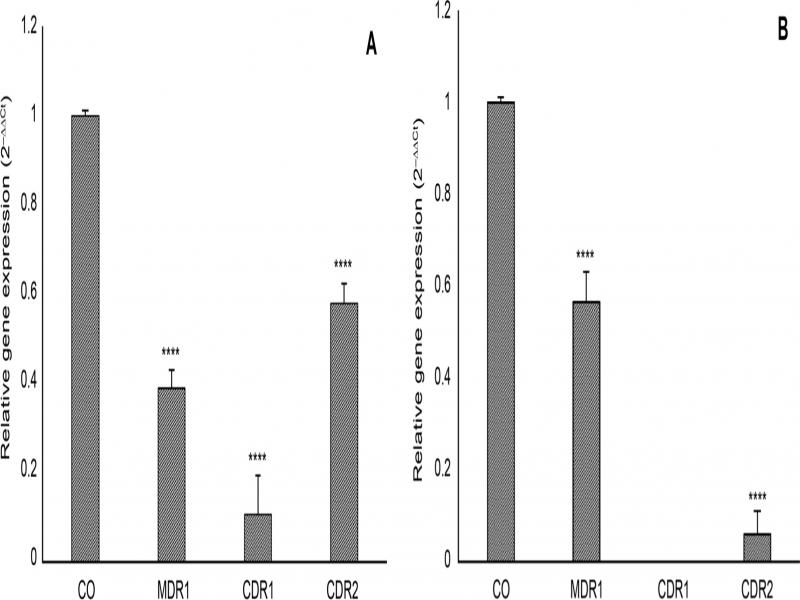
Fig. 5.
Relative gene expression levels of the efflux pump mediated genes MDR1, CDR1, and CDR2 in (A) Candida albicans C6 and (B) Candida albicans C21 as measured by the quantitative real-time PCR. Total RNAs were prepared from both selected isolates after 48-hour treatment with 4,000 μg/ml amikacin. The levels of transcripts were normalized to the level of the ACT1 gene expression and then compared to the level of expression in the untreated control cells. The level of gene transcript in control untreated cells (CO) was set as 1. Results were expressed as the means and standard deviations of three independent determinations. The error bars represent SDs.