
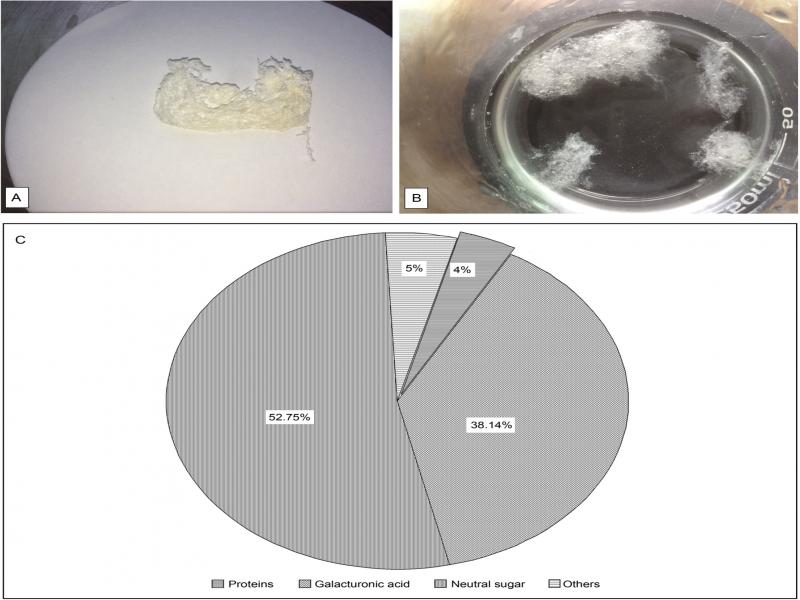
Fig. 1.
Purified IC-1 from Isaria cicadae GZU6722 and its main composition. A is purified bioflocculant, B is the bioflocculant suspension, and C indicates the main composition of the purified bioflocculant.
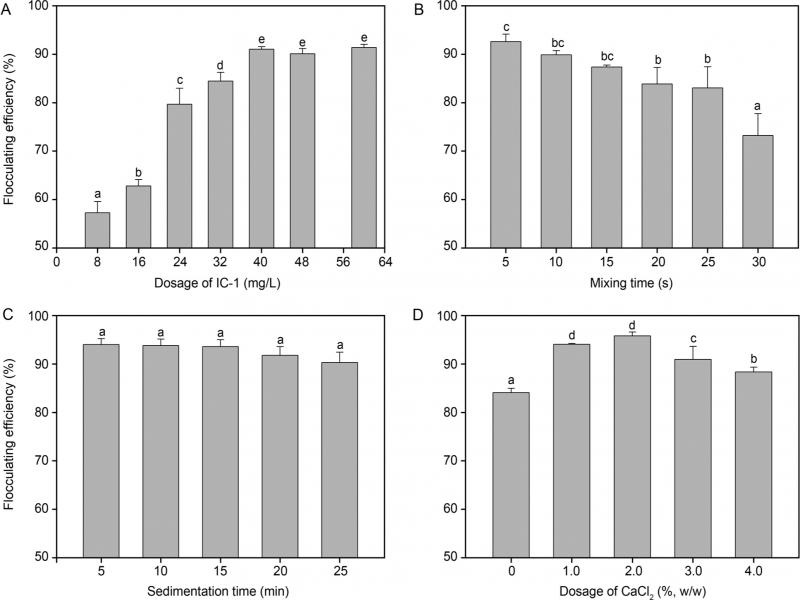
Fig. 2.
The flocculating performance under various conditions. (A) Different dosage of IC-1; (B) Different mixing time; (C) Different sedimentation time; (D) Different dosage of CaCl2 as a coagulant. Error bars indicate standard deviation of triplicate experiments. Significant differences among different treatments are indicated by lowercase (p < 0.05).
Table I
Flocculation performance of IC-1 compared with other microbial flocculants for the coal wastewater treatment.
| Bioflocculant | Origin | Maximum Flocculating Efficiency | Additives |
|---|---|---|---|
| IC-1 | Isaria cicadae GZU6722 | 95.8% | 2% CaCl2 |
| POS412 | Paenibacillus mucilaginosus WL412 | 96.53% (Xu et al. 2017) | |
| MBF-L918 | Pseudomonas veronii L918 | 95.51% (Liu et al. 2016) | |
| A bioflocculant | Azotobacter chroococcum | 95.76% (Yang et al. 2019) | 50 mg/l CTAB |
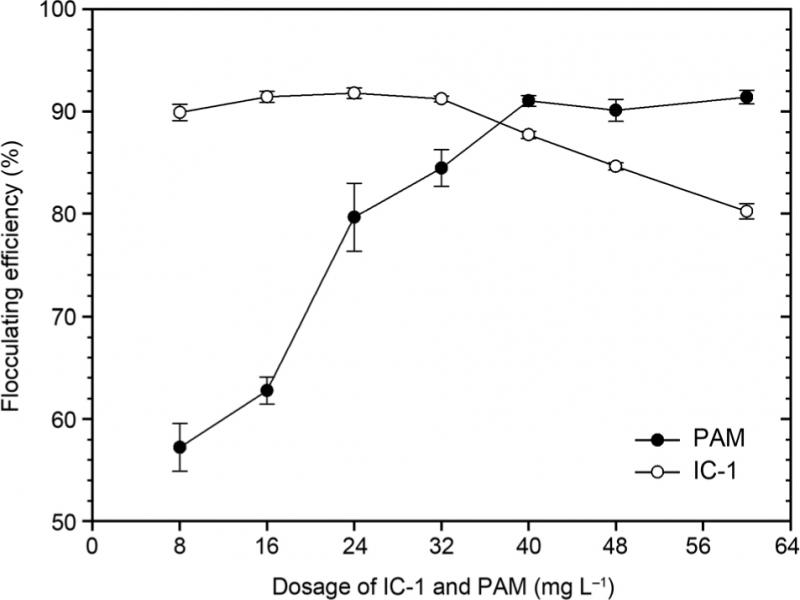
Fig. 3.
The flocculating efficiency of IC-1 and APAM at different dosages. Error bars indicate standard deviation of triplicate experiments. Significant differences among different treatments are indicated by lowercase (p < 0.05).
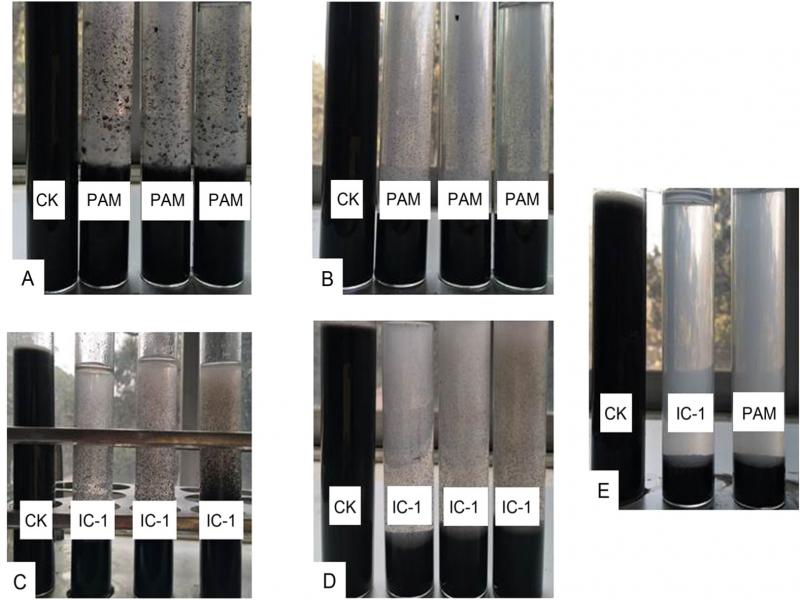
Fig. 4.
The flocculating process after the dosage of IC-1 and APAM. The comparisons between: (A) CK and APAM-assisted samples after 1 min of sedimentation; (B) CK and APAM-assisted samples after 5 min of sedimentation; (C) CK and IC-1-assisted samples after 1 min of sedimentation; (D) CK and IC-1-assisted samples after 5 min of sedimentation; and (E) the comparison among CK, IC-1-assisted, and APAM-assisted samples after 10 min of sedimentation. CK means a control check, i.e., the raw sample without adding any flocculant.
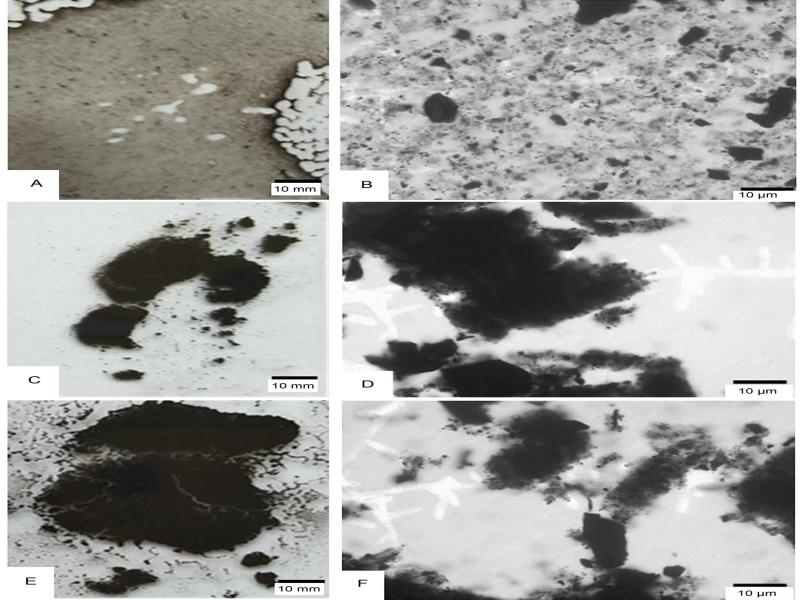
Fig. 5.
Microscopic images of the fine particles after addition of IC-1 and APAM. (A) CK (10 mm); (B) CK (10 μm); (C) IC-1 (10 mm); (D) IC-1 (10 μm); (E) APAM (10 mm); (F) APAM (10 μm). CK means a control check, i.e., the raw sample without adding any flocculant.
Table II
The estimated costs of APAM and IC-1 to treat 1 metric ton of coal washing wastewater at the same flocculating efficiency.
| Cost/t | Dosage/g m−3 | Cost per metric ton of wastewater | |
|---|---|---|---|
| APAM | US$ 2300 | 60 | US$ 0.13 |
| IC-1 a | US$ 2500 | 24 | US$ 0.06 |