
Fig. 1.
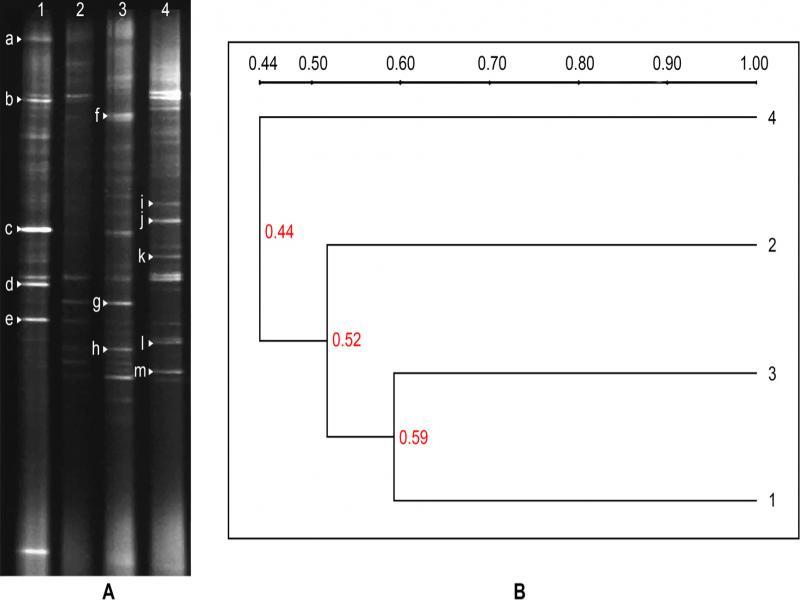
Fig. 2.
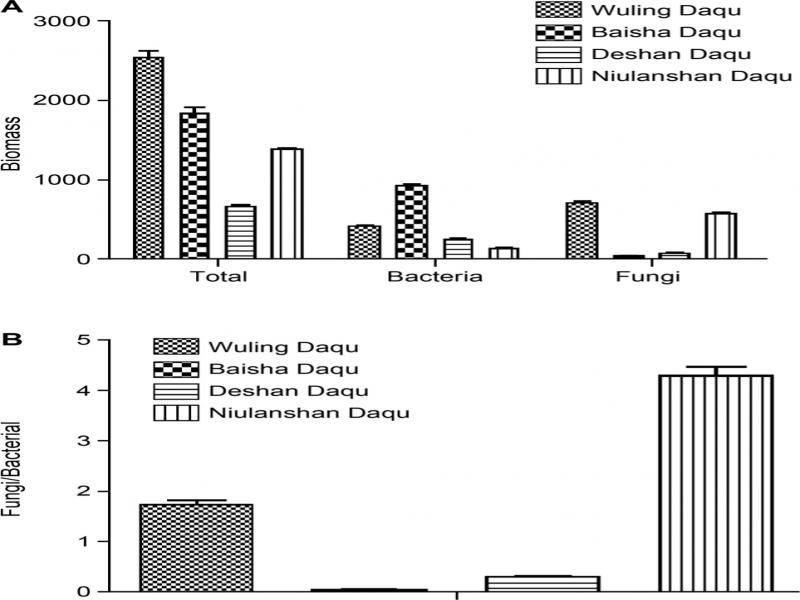
Fig. 3.
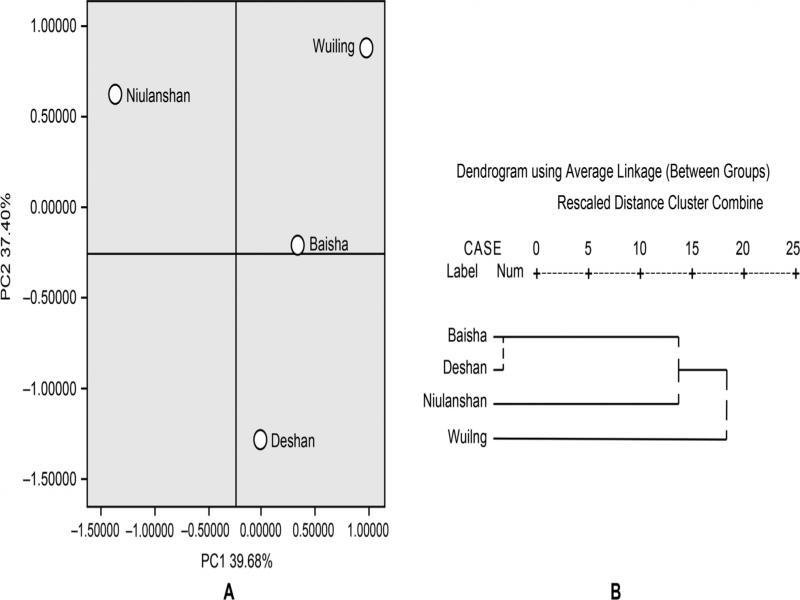
Fig. 4.
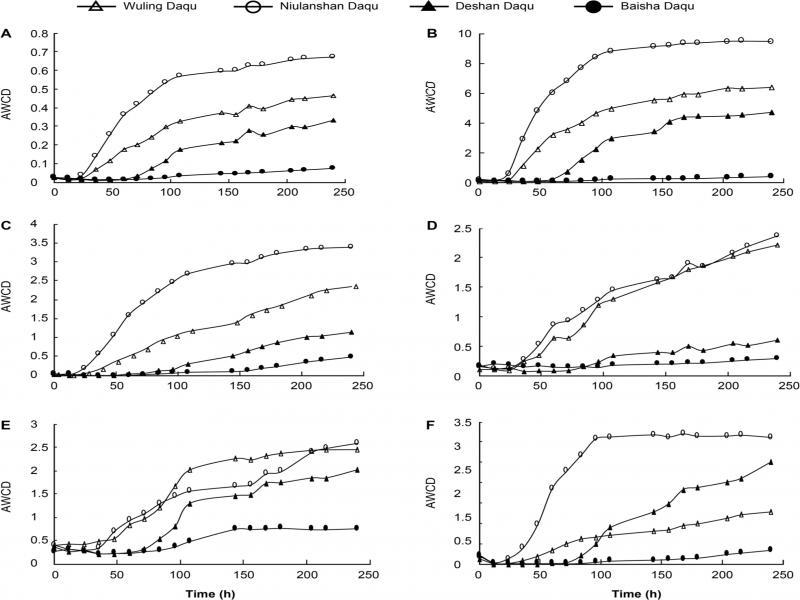
Fig. 5.
Summary of the identification of bands in Fig_ 1_
| Band No. a | Related GenBank sequence | Closest relatives (accession no.) | Identity (%) b |
|---|---|---|---|
| a | MN857671 | Uncultured bacterium (AB441615.1) | 100 |
| b | MN857663 | Weissella confuse (GU049413.1) | 99 |
| c | MN857670 | Pediococcus pentosaceus (AB481102.1) | 100 |
| d | MN857669 | Lactobacillus sanfranciscensis (EU350220.1) | 99 |
| e | MN857662 | Uncultured Lactobacillus sp. (FJ982856.1) | 100 |
| f | MN857666 | Uncultured bacterium (AB441567.1) | 100 |
| g | MN857665 | Pediococcus acidilactici (FJ751795.1) | 99 |
| h | MN857667 | Bacillus thermoamylovorans (GU067470.1) | 99 |
| i | MN857672 | Uncultured bacterium (FJ235654.1) | 100 |
| j | MN857673 | Uncultured bacterium (GQ076030.1) | 96 |
| k | MN857664 | Uncultured bacterium (GQ505035.1) | 100 |
| l | MN857661 | Uncultured Lactobacillus sp. (GQ999780.1) | 98 |
| m | MN857668 | Thermoactinomyces sanguinis (AJ251778.1) | 95 |
The concentration of the PLFAs in different Daqu samples_
| PLFA (nmol/g dry matter) | Wuling Daqu | Baisha Daqu | Deshan Daqu | Niulanshan Daqu |
|---|---|---|---|---|
| A11:0 | 0 | 0 | 0 | 105.36 |
| A13:0 | 327.32 | 297.50 | 153.95 | 99.80 |
| 15:00 | 294.13 | 475.82 | 189.31 | 24.35 |
| Me14:0 | 133.53 | 0 | 0 | 217.31 |
| I14:0 | 117.82 | 0 | 0 | 54.73 |
| I15:0 | 0 | 0 | 0 | 34.62 |
| A15:0 | 102.96 | 0 | 0 | 44.73 |
| 16:1W9Z | 121.91 | 0 | 83.49 | 0 |
| 16:00 | 4.15 | 194.31 | 4.00 | 5.45 |
| I16:0 | 95.05 | 220.59 | 0 | 0 |
| A16:0 | 113.83 | 166.87 | 2.86 | 142.79 |
| 17:00 | 112.01 | 250.34 | 61.09 | 0 |
| Cy17:0 | 0 | 0 | 76.79 | 0 |
| 18:3W6,9,12t | 216.81 | 0 | 1.58 | 0 |
| 18:3W3,6,9zzz | 0 | 0 | 66.79 | 0 |
| 18:2W6.9tt | 1.76 | 3.03 | 0 | 2.66 |
| 18:2W6.9zz | 234.20 | 30.46 | 0 | 186.88 |
| 18:2W6.8zz | 0 | 0 | 0 | 51.43 |
| 18:2W7.10tt | 0 | 0 | 0 | 315.07 |
| 18:2W5.8tt | 248.88 | 0 | 3.18 | 0 |
| 18:1W9t | 5.89 | 8.97 | 14.18 | 7.36 |
| 18:1W10t | 45.45 | 0 | 0 | 0 |
| 18:1W9z | 0 | 0 | 0 | 68.80 |
| 18:00 | 24.92 | 68.60 | 14.55 | 26.90 |
| Cy18:0 | 149.68 | 0 | 0 | 0 |
| 20:00 | 152.12 | 0 | 0 | 0 |
Samples of four typical Daqus of Chinese spirits_
| Name | Flavour type | Highest temperature inside the Daqu pile (°C) | Region (city and geographic coordinates) |
|---|---|---|---|
| Wuling | Sauce-flavour | 65 | Changde, Hunan (29°05′N, 111°39′E) |
| Baisha | Sauce- and strong-flavour | 60 | Changsha, Changsha (28°11′N, 112°58′E) |
| Deshan | Strong-flavour | 55 | Changde, Hunan (29°05′N, 111°39′E) |
| Niulanshan | Light-flavour | 50 | Beijing (39°56′N, 116°20′E) |
Comparison of the carbon utilization of different samples_
| Well | Carbon Sources | Wuling Daqu | Baisha Daqu | Deshan Daqu | Niulanshan Daqu |
|---|---|---|---|---|---|
| A2 | β-Methyl-D-glucoside | 0.559 | 0 | 0.001 | 1.445 |
| A3 | D-Galactonic acid-γ-Lactone | 0.526 | 0.026 | 1.199 | 1.028 |
| A4 | L-Arginine | 0.383 | 0.019 | 0.316 | 0.063 |
| B1 | Pyruvic acid Methyl ester | 0.759 | 0 | 0.383 | 0.444 |
| B2 | D-Xylose | 1.115 | 0.025 | 0.067 | 1.500 |
| B3 | D-Galacturonic acid | 1.484 | 0 | 0.754 | 1.391 |
| B4 | L-Asparagine | 0.146 | 0.033 | 0.035 | 0.919 |
| C1 | Tween 40 | 0.872 | 0.356 | 0.399 | 0.399 |
| C2 | i-Erythritol | 0.113 | 0.002 | 0.21 | 0.263 |
| C3 | 2-Hydroxy benzoic acid | 0.004 | 0 | 0.176 | 0 |
| C4 | L-Phenylalanine | 0.085 | 0.121 | 0.099 | 0.132 |
| D1 | Tween 80 | 0.558 | 0.251 | 0.8 | 1.037 |
| D2 | D-Mannitol | 0.845 | 0.008 | 0.399 | 1.789 |
| D3 | 4-Hydroxy benzoic acid | 0.019 | 0.020 | 0.302 | 0.076 |
| D4 | L-Serine | 1.129 | 0.031 | 0.049 | 0.626 |
| E1 | α-Cyclodextrin | 0.001 | 0.048 | 0 | 0.007 |
| E2 | N-Acetyl-D-glucosamine | 0.927 | 0.171 | 0.146 | 1.844 |
| E3 | γ-Hydroxybutyric acid | 0.118 | 0.102 | 0.139 | 0.042 |
| E4 | L-Threonine | 0.031 | 0 | 0 | 0.019667 |
| F1 | Glycogen | 0.192 | 0 | 0.143 | 0.163 |
| F2 | D-Glucosaminic acid | 0.298 | 0 | 0.967 | 0.023 |
| F3 | Itaconic acid | 0 | 0.044 | 0 | 0 |
| F4 | Glucose-L-glutamic acid | 0.021 | 0.009 | 0 | 0.132 |
| G1 | D-Cellobiose G2 | 0.920 | 0.122 | 0.422 | 1.538 |
| G2 | Glucose-1-phosphate | 0.109 | 0.033 | 0 | 1.255 |
| G3 | a-Ketobutyric acid | 0 | 0 | 0.004 | 0 |
| G4 | Phenylethylamine | 0.001 | 0 | 0.534 | 0 |
| H1 | a-D-Lactose | 0.612 | 0.013 | 0.189 | 1.404 |
| H2 | D,L-a-Glycerol phosphate | 0.162 | 0.009 | 0.243 | 0.275 |
| H3 | D-Malic acid | 0.349 | 0.009 | 0.431 | 0.944 |
| H4 | Putrescine | 0.293 | 0.053 | 0.133 | 0.639 |