
Table I
Diversity index of anaerobic fungal communities among the cattle breeds.
| Cattle breeds | Feed | Reads | 0.97 (level) | ||||
|---|---|---|---|---|---|---|---|
| OTU0.05 | Ace | Chao | Shannon | Simpson | |||
| D | weeds | 64818 | 255 | a272 (b263, c288) | a263 (b258, c276) | a2.17 (b2.15, c2.18) | a0.3102 (b0.3063, c0.3142) |
| H | feed | 57567 | 166 | a193 (b180, c220) | a191 (b176, c225) | a2.78 (b2.76, c2.79) | a0.1352 (b0.1332, c0.1372) |
| M | weeds | 98550 | 463 | a487 (b476, c505) | a477 (b470, c494) | a2.82 (b2.80, c2.83) | a0.1622 (b0.1606, c0.1639) |
| ZH | weeds | 64694 | 441 | a461 (b452, c477) | a451 (b445, c466) | a1.74 (b1.72, c1.76) | a0.4905 (b0.4858, c 0.4953) |
Table II
Cattle diet and nutrient levels.
| Feeds | Dietary nutrients (%) | ||||
|---|---|---|---|---|---|
| DM | CP | EE | NDF | ADF | |
| Bamboo diet | 48.10 ± 9.85 | 13.06 ± 1.20 | 3.08 ± 0.69 | 72.13 ± 1.54 | 42.76 ± 3.02 |
| Wild grass | 70.24 ± 0.56 | 1.44 ± 0.10 | 0.04 ± 0.02 | 30.12 ± 0.17 | 18.83 ± 0.10 |
| Rice bran | 87.03 ± 0.22 | 12.82 ± 0.16 | 16.53 ± 0.18 | 22.91 ± 0.21 | 13.44 ± 0.52 |
| Corn | 86.15 ± 0.14 | 8.38 ± 0.13 | 3.01 ± 0.24 | 8.59 ± 0.62 | 3.27 ± 0.54 |
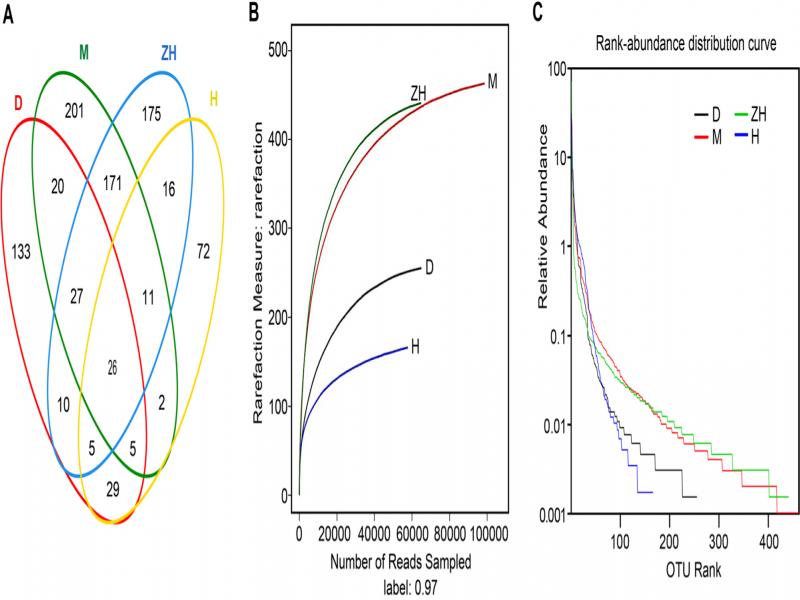
Fig. 1.
Venn diagram, rarefaction index, and abundance distribution curves for D, H, M and ZH based on OTUs from cattle breeds, which had ≥ 97% similarity.
D – gayals; H – Yunnan yellow cattle; M – yaks; ZH – Tibetan yellow cattle. Red line represents D. Blue line represents ZH.
Green line represents M. Yellow line represents H.
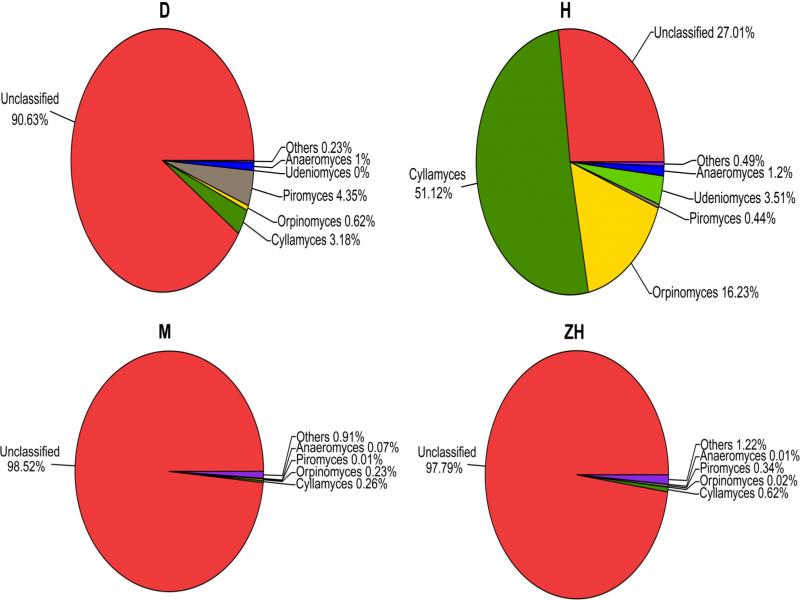
Fig. 2.
Composition of rumen fungi genera. Others represent the abundance of rumen fungi lower than 1%.
D – gayals; H – Yunnan yellow cattle; M – yaks; ZH – Tibetan yellow cattle.
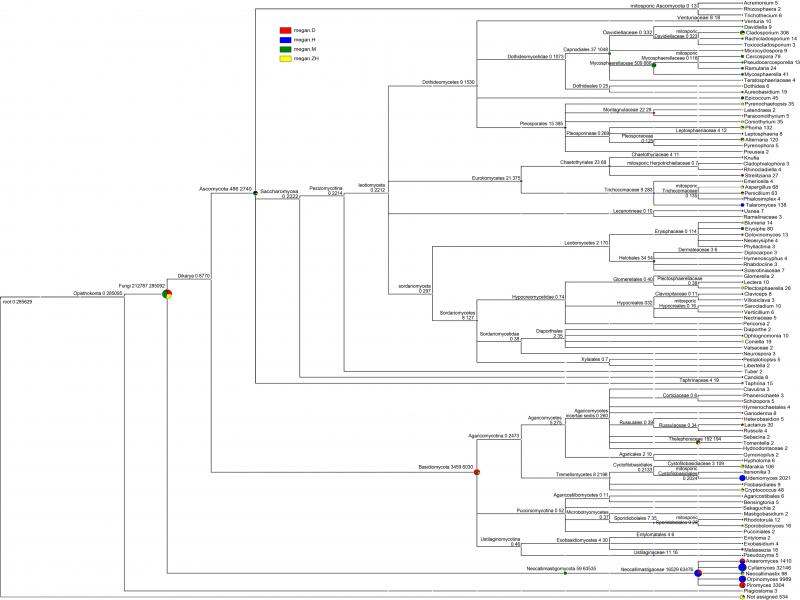
Fig. 3.
Phylogenetic tree. The tree was based on taxonomic information such as the abundance of all genera and the genera of corresponding OTUs based on taxonomic information from the NCBI database to reflect the diversity and community of rumen fungi of D, H, M, and ZH.
D – gayals; H – Yunnan yellow cattle; M – yaks; ZH – Tibetan yellow cattle.
Table III
Fungal classification and the percentage statistics.
| Total sequence | Phylum | Sequences | Percents | Dominant genus |
|---|---|---|---|---|
| 285092 | Neocallimastigomycota | 63 535 | 22.28% | Piromyces, Anaeromyces, Cyllamyces, Neocallimastix and Orpionmyces |
| Basidiomycota | 6 030 | 2.11% | Udeniomyces | |
| Ascomycota | 2 740 | 0.96% | Cladosporium |
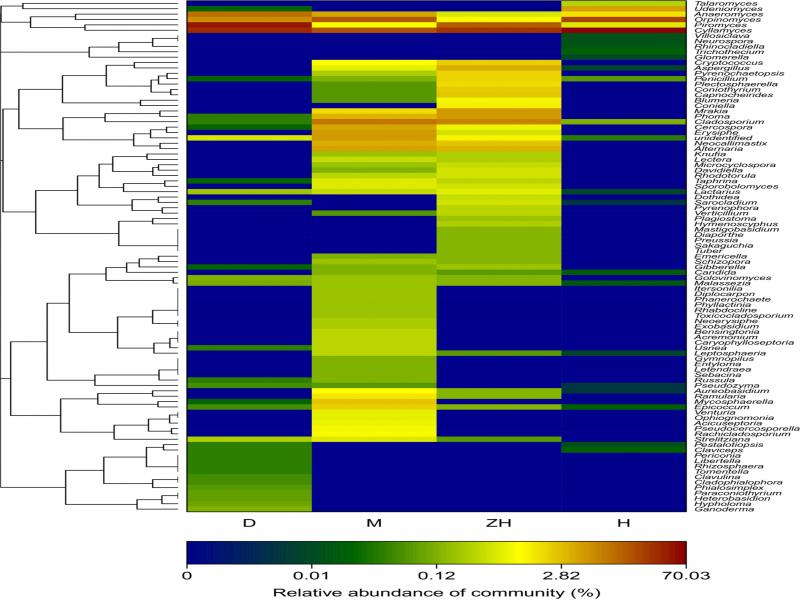
Fig. 4.
Heatmap formed using the Bray-Curtis algorithm and the complete linkage method. The heatmap-plot describes the relative percentage of each fungal class within each cattle breed. Relative values for the fungal class are indicated by color intensity.
D – gayals; H – Yunnan yellow cattle; M – yaks; ZH – Tibetan yellow cattle.