
Fig. 1.
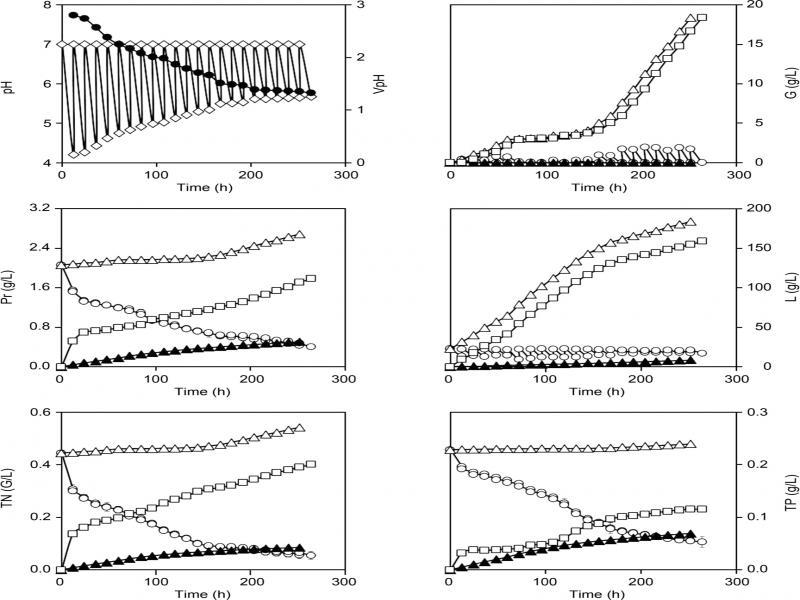
Fig. 2.
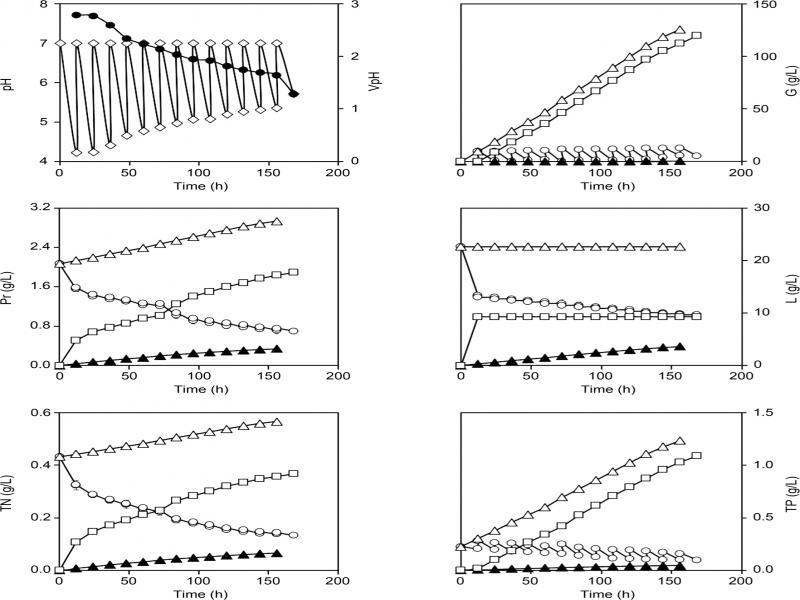
Fig. 3.

Significant values (p < 0_05) for the constants in model [7] for the different dependent variables in the second fed-batch culture_
| Parameter | Biomass | Viable cell counts | Nisin | Lactic acid | Acetic acid | Butane-2,3-diol |
|---|---|---|---|---|---|---|
| A1 | 0.46 ± 0.043 | 0.58 ± 0.053 | 0.42 ± 0.040 | 10.19 ± 0.405 | 0.41 ± 0.032 | 0.23 ± 0.062 |
| A2 | −3.32 ± 0.351 | −1.75 ± 0.062 | −27.69 ± 1.011 | −8.10 ± 0.621 | −2.19 ± 0.027 | −3.15 ± 0.333 |
| A3 | 0.58 ± 0.059 | 0.45 ± 0.011 | 6.53 ± 0.462 | 1.79 ± 0.109 | 0.44 ± 0.024 | 0.63 ± 0.097 |
| A4 | 0.53 ± 0.038 | 0.26 ± 0.065 | 4.73 ± 0.516 | −0.35 ± 0.017 | 0.42 ± 0.023 | 0.72 ± 0.065 |
| A5 | −0.04 ± 0.005 | −0.01 ± 0.003 | −0.10 ± 0.013 | 0.03 ± 0.006 | −0.02 ± 0.001 | −0.04 ± 0.004 |
| A6 | 0.11 ± 0.006 | NS | NS | NS | NS | NS |
| R2 | 0.9973 | 0.9906 | 0.9950 | 0.9959 | 0.9794 | 0.9856 |
| RPDM (%) | 0.987 | 0.326 | 3.775 | 2.609 | 3.988 | 3.602 |
| VpHopt | 1.82 | 1.96 | 2.12 | 2.26 | 2.47 | 2.49 |
| pHopt = 7.0 – VpHopt | 5.18 | 5.04 | 4.88 | 4.74 | 4.53 | 4.51 |
| Gopt (g/l) | 10.55 | 11.10 | 22.83 | 5.30 | 11.17 | 10.27 |
The optimal final culture pH values for different bacteriocins produced by lactic acid bacteria_
| Bacteriocin | Producing strain | Optimum final pH | Culture medium | Reference |
|---|---|---|---|---|
| Mesenterocin 5 | Leuconostoc mesenteroides UL5 | 4.24 to 4.34 | Whey | Daba et al. 1993 |
| Pediocin AcH | Pediococcus acidilactici LB42-923 | 3.70 | TGE broth | Yang and Ray 1994 |
| Nisin | Lactococcus lactis ATCC 11454 | 5.80 | TGE broth | Yang and Ray 1994 |
| Leuconocin Lcm1 | Leuconostoc carnosum Lm1 | 5.00 | TGE broth | Yang and Ray 1994 |
| Sakacin A | Lactobacillus sake LB 706 | 4.50 | TGE broth | Yang and Ray 1994 |
| Nisin | Lactococcus lactis ATCC 7962 | 4.90 | Whey permeate | Flôres and Alegre 2001 |
| Carnocin KZ213 | Carnobacterium piscicola 213 | 4.80 to 5.08 | MRS broth | Khouiti and Simon 2004 |
| Nisin | Lactococcus lactis ATCC 11454 | 4.60 | MRS + milk | Penna et al. 2005 |
| 4.80 | M17 + milk | |||
| Nisin | Lactococcus lactis ATCC 11454 | 4.65 to 4.96 | Whey + YE (5 g/l) | Jozala et al. 2011 |
Significant values (p < 0_05) for the constants in model [7] for the different dependent variables in the first fed-batch culture_
| Parameter | Biomass | Viable cell counts | Nisin | Lactic acid | Acetic acid | Butane-2,3-diol |
|---|---|---|---|---|---|---|
| A1 | 4.12 ± 0.631 | 1.86 ± 0.084 | 1.13 ± 0.113 | 5.71 ± 0.235 | 1.16 ± 0.003 | 2.75 ± 0.277 |
| A2 | −3.60 ± 0.545 | −1.56 ± 0.072 | 8.67 ± 0.4244 | −4.04 ± 0.225 | −0.70 ± 0.012 | −2.00 ± 0.265 |
| A3 | 0.83 ± 0.116 | 0.41 ± 0.015 | −2.07 ± 0.206 | 0.88 ± 0.054 | 0.12 ± 0.005 | 0.37 ± 0.064 |
| A4 | −1.09 ± 0.383 | −0.15 ± 0.051 | −9.25 ± 1.547 | −0.92 ± 0.040 | −0.46 ± 0.021 | −0.19 ± 0.021 |
| A5 | 0.14 ± 0.062 | 0.03 ± 0.008 | 2.93 ± 0.314 | 0.26 ± 0.019 | 0.15 ± 0.011 | 0.03 ± 0.003 |
| A6 | 0.35 ± 0.168 | NS | 0.74 ± 0.203 | NS | NS | NS |
| R2 | 0.9950 | 0.9948 | 0.9993 | 0.9986 | 0.9949 | 0.9954 |
| RPDM (%) | 3.335 | 0.228 | 1.121 | 3.760 | 1.701 | 5.809 |
| VpHopt | 1.81 | 1.92 | 2.32 | 2.30 | 2.83 | 2.40 |
| pHopt = 7.0 – VpHopt | 5.19 | 5.08 | 4.68 | 4.70 | 4.17 | 4.60 |
| Gopt (g/l) | 1.64 | 2.72 | 1.29 | 1.76 | 1.41 | 2.80 |
Mean composition (g/l) of the substrates used as culture media_
| Nutrient | DW medium | CMPW medium | CMPWGP medium |
|---|---|---|---|
| Lactose | 22.62 ± 0.05 | − | − |
| Glucose | − | 101.72 ± 0.17 | 400.00 ± 0.01 |
| Total nitrogen | 0.433 ± 0.02 | 0.540 ± 0.01 | 0.431 ± 0.02 |
| Total phosphorus | 0.227 ± 0.02 | 0.060 ± 0.00 | 3.210 ± 0.06 |
| Proteins | 2.07 ± 0.01 | 3.47 ± 0.03 | 2.75 ± 0.02 |