
1. Introduction
Coastal zones, particularly river-dominated deltas, are highly dynamic environments governed by complex interactions between hydrodynamics, wave processes, and sediment transport (Carpi et al., 2021; Reis et al., 2025). In monsoon-dominated regions such as the Mekong River Delta (MRD), this dynamism is exacerbated by strong seasonal forcing, where wave energy and current patterns vary significantly throughout the year. Recent investigations in major tropical deltas demonstrate that monsoon-driven wave action is the primary driver of coastal erosion and mangrove margin retreat. However, sea-level rise further compounds deltaic vulnerability; site-specific hydrodynamics and localized physical forcing remain the governing factors controlling nearshore morphological stability. Consequently, precise, high-resolution engineering assessments are essential for designing resilient coastal protection strategies. The study in other major deltaic systems, such as the Ganges–Brahmaputra–Meghna Delta, have demonstrated that monsoon-driven waves are a primary driver of shoreline recession, particularly impacting mangrove-fronted coasts (Xiong et al., 2026). Furthermore, the vulnerability of these tropical deltas is compounded by sea-level rise; however, emerging research suggests that the ecological deterioration of mangroves due to sea-level rise may be overestimated in some tropical contexts (Dai et al., 2024), highlighting the need for precise, site-specific engineering assessments like those presented here. Numerical modeling has become a key tool for understanding these processes and for assessing the impacts of coastal protection structures. Recent advances in coupled hydro-morphodynamical models have significantly improved the capability to simulate these interactions, particularly in vulnerable systems such as the Mekong Delta.
Modern numerical modeling approaches increasingly rely on integrated frameworks that couple hydrodynamics, wave propagation, and sediment transport. To evaluate structural protection efficacy, modern coastal engineering relies heavily on process-based numerical modeling systems. Coupled frameworks—such as Delft3D, MIKE 21/3, and TELEMAC– TOMAWAC—have significantly advanced our ability to simulate non-linear interactions among wave transformation, current fields, and sediment transport. These numerical tools have been widely applied to quantify structural impacts on sediment connectivity, assess beach nourishment longevity, and evaluate coastal flooding hazards (Lesser et al., 2004; Roelvink & Reniers). These models have demonstrated that coastal morphodynamics are governed by non-linear feedback mechanisms between hydrodynamics and sediment transport. Morphological changes influence flow patterns, while hydrodynamic forcing alters sediment pathways, particularly in shallow coastal and deltaic systems (van der Wegen & Roelvink, 2008).
Wave transformation plays a fundamental role in shaping nearshore hydrodynamics. As waves propagate toward the coast, processes such as shoaling and breaking redistribute energy and generate longshore currents and circulation patterns that control sediment entrainment and transport (Carpi et al., 2021; Ryu et al., 2022; Saengsupavanich et al., 2022; Scott et al., 2016; Soulsby, 1997). In estuarine systems, these processes are further complicated by tidal forcing and river discharge.
Recent studies emphasize the importance of wave–current coupling in determining sediment dynamics. Suspended sediment transport is strongly influenced by seasonal forcing, particularly in monsoon-dominated regions, where wave energy and current patterns vary significantly throughout the year (An et al., 2025). These interactions must be explicitly resolved in numerical models to accurately capture sediment transport and morphological evolution.
Coastal protection structures—including detached breakwaters, groynes, and seawalls—are widely used to mitigate coastal erosion. Numerical modeling studies have shown that such structures significantly modify wave fields through reflection, diffraction, and energy dissipation, thereby altering nearshore circulation and sediment transport processes (Ranasinghe & Turner, 2006; Repousis et al., 2023; Tsiaras et al., 2020; USACE, 2008).
Detached breakwaters can reduce wave height and promote sediment deposition in sheltered zones; however, they often disrupt longshore sediment transport, leading to sediment accumulation on the updrift side and erosion on the downdrift side (Burcharth et al., 2007). Similar impacts have been reported for seawalls, which may increase local scouring and exacerbate erosion in adjacent areas (Xia, 2025).
Research has focused on hybrid and nature-based solutions, such as artificial reefs and mangrove-integrated coastal protection systems. These approaches aim to balance engineering performance with ecological sustainability by attenuating wave energy while preserving sediment connectivity (Cappietti, 2011; Kristensen et al., 2013; Pranzini et al., 2018). Process-based models have been widely applied to assess beach nourishment performance (Karasu et al., 2023; Staudt et al., 2021), quantify the impacts of coastal structures on sediment dynamics (Franzen et al., 2021), and support coastal flooding and inundation risk assessments (Cao et al., 2024). Nevertheless, relatively few studies have employed calibrated and validated coupled modeling systems to explicitly compare the morphodynamical consequences of existing detached breakwaters with scenarios involving structural modification or removal. Addressing this gap is essential for advancing defensible, science-based coastal management and forms the primary motivation of the present study.
A critical frontier in coastal management is the strategic modification or removal of legacy structures. However, such interventions introduce non-linear perturbations to local sediment budgets and morphological stability. Currently, there is a significant knowledge gap in the literature regarding the use of calibrated, coupled modeling systems to explicitly quantify the morphodynamical trade-offs between maintaining, modifying, or removing detached breakwaters—especially in highly dynamic muddy coastal environments (Tsiaras et al., 2020).
In MRD, significant research has focused on regional hydrodynamics and sediment transport dynamics (An et al., 2025; Binh et al., 2022; Duy Vinh et al., 2016; Tu et al., 2019). To combat severe monsoonal shoreline erosion, various engineered interventions have been deployed across the delta, including T-shaped bamboo fences, geotubes, pile-rock breakwaters, Busadco breakwaters, semi-circular breakwaters, and hollow triangle breakwaters (An et al., 2024; Le et al., 2022). Recent evaluations show that while permeable and detached breakwaters reduce incident wave energy by up to 50%–76%, their morphological efficacy varies wildly depending on local mud-sediment dynamics (Le Xuan et al., 2022). Conversely, traditional shore-normal groynes primarily disrupt alongshore current momentum. However, existing MRD studies remain predominantly focused on localized empirical monitoring of single-structure typologies or single site-specific installations. A systematic, process-based research gap exists regarding how shore-normal groyne fields directly compare against detached breakwater systems in cohesive mud environments. Specifically, there is a lack of coupled hydro-morphodynamic modeling that quantifies the critical trade-offs between current-driven sediment trapping (groynes) versus wave attenuation and mud-flushing dynamics (detached breakwaters) under combined monsoon wave and fluvial forcing.
The spatial-temporal analysis of the shoreline changes from 1980 to 2025 reveals a complex pattern of coastal erosion and accretion over the 45-year period, indicating that a significant portion of the outer coastline is characterized by persistent erosion. This is represented by the warm color spectrum (yellow–red), with retreat rates typically ranging from −10 m · year−1 to −30 m · year−1. Critical erosion zones in the estuaries where the shoreline has retreated by more than −50 m · year−1 are observed in isolated segments along the eastern coast, signaling high-risk areas for coastal infrastructure (Thanh, 2023; Tu, 2022).
Despite these computational advancements, a critical research gap remains in the scientific literature. Most existing numerical studies on hard engineering structures focus either on single-structure behavior or on non-cohesive, sandy beach environments. There is a pronounced lack of comparative, multi-dimensional studies that systematically evaluate and contrast the performance of different structural typologies—specifically shore-normal groynes vs shore-parallel detached breakwaters—within highly dynamic, cohesive muddy deltaic settings. Furthermore, how these contrasting layout configurations alter domain-wide sediment budgets, induce localized head-scour, and interact with combined monsoonal waves and river discharge remains insufficiently quantified. To address these knowledge gaps, this study utilizes a fully coupled MIKE 21/3 hydro-morphodynamic modeling framework to systematically evaluate and compare the performance of two primary structural intervention schemes in Vinh Long, MRD: a shore-normal groyne system (Option 1) and a detached breakwater system (Option 2) against natural baseline conditions (Option 0). The novelty of this work lies in:
(1) Providing a direct, quantitative comparison between shore-normal sediment-trapping structures and shore-parallel wave-attenuating barriers in a cohesive mud-dominated environment.
(2) Decoupling the hydrodynamic mechanisms (wave diffraction vs current obstruction) that govern mid-cell accretion versus structure-induced localized tip scour.
(3) Delivering actionable, science-based design criteria for optimizing structural layouts in climate-vulnerable deltaic coastlines.
2. Brief study area and study method
2.1. Brief study area
Situated at the strategic confluence of the Tien and Hau Rivers within the MRD, Vinh Long Province encompasses a natural area of approximately 6296.20 km2 and supports a burgeoning population of over 4.25 million (Fig. 1). The province’s 130 km coastline serves as a critical interface for maritime development; however, this region is currently grappling with severe environmental stressors, including accelerated sea-level rise and a drastic reduction in upstream sediment supply. The coastal hydrodynamic regime is primarily governed by a meso-tidal influence, with a tidal range spanning 2.0–4.0 m and extreme tidal reaches up to 4.14 m (An, 2005; Thuy, 1989). This forcing is seasonally modulated by the monsoonal system, where the Northeast (NE) monsoon (November–March) generates high-energy wave climates (Hs = 1.0–1.5 m and T = 5.0–7.0 s) that drive intense coastal erosion, while the Southwest (SW) monsoon (June–October) coincides with fluvial discharge, occasionally facilitating localized deposition (Nguyen et al., 2011; Nguyen et al., 2013; Thanh, 2012; Tu et al., 2019).

Figure 1
Location of the study area.
The morphodynamical complexity of Vinh Long coastal areas and estuaries is further heightened by its cohesive sediment characteristics and the prevalence of fluid mud, particularly within navigation channels and harbor basins. Sediment dynamics exhibit significant tidal asymmetry, with the clay-sized fraction increasing from 15% to 20% in freshwater zones to 20%–30% in saline estuarine reaches, while the suspended sediment during ebb tides maintains a finer median grain size (approx. 0.003 mm). The rheological properties of the fluid mud are notably complex, with densities ranging from 1050 kg · m−3 to 1550 kg · m−3, yield stresses from 50 Pa to 2700 Pa, and dynamic viscosities reaching up to 1100 Pa.s (Le Vinh et al., 2020; Nguyen & Le, 2023).
Shoreline changes along the Vinh Long coast from 1980 to 2025, presented in Fig. 2 show a retreat rates from −20 m · year−1 to −30 m · year−1 in Long Vinh coast, a deposition rate of 30–40 m · year−1 appear in the coast between Long Vinh and Dong Hai, the coast from Duyen Hai to Truong Long Hoa has erosion rate from 20 m · year−1 to 30 m · year−1. The coast of Long Huu in the estuaries where the shoreline has retreated by more than −50 m · year−1 (Thanh, 2023; Tu, 2022).

Figure 2
Shoreline change in the coast of Vinh Long Province from 1980 to 2025.
The beach profile P1 (location in Fig. 2) indicated that beach width from elevation from +2.0 m to ±0.0 m (National Datum VN-2000) ranges from 200 m to 500 m (Fig. 3). Based on these geomorphic conditions, two alternative coastal protection layouts are considered.

Figure 3
Beach profiles at study area.
2.2. Model setup
To rigorously quantify the hydrodynamic interactions and subsequent morphodynamical evolution in the vicinity of these coastal protection structures, this research employs a coupled numerical modeling framework specifically tailored for cohesive sediment environments. The predictive capability of the model is underpinned by a comprehensive calibration and validation protocol using high-resolution field datasets from the MRD (Trinh Dinh & Viet, 2026). The coupled numerical models used are Mike 21/3 integrated models, including Mike 21 HD, Mike 21 SW, and Mike 21 mud transport (MT). The model domain size of 300 km × 270 km with 21 875 nodes and 26 765 elements (Fig. 4). The rectangular and quadrangular meshes used for the coastal-offshore and river-navigation channel area, respectively (Trinh Dinh & Viet, 2026).
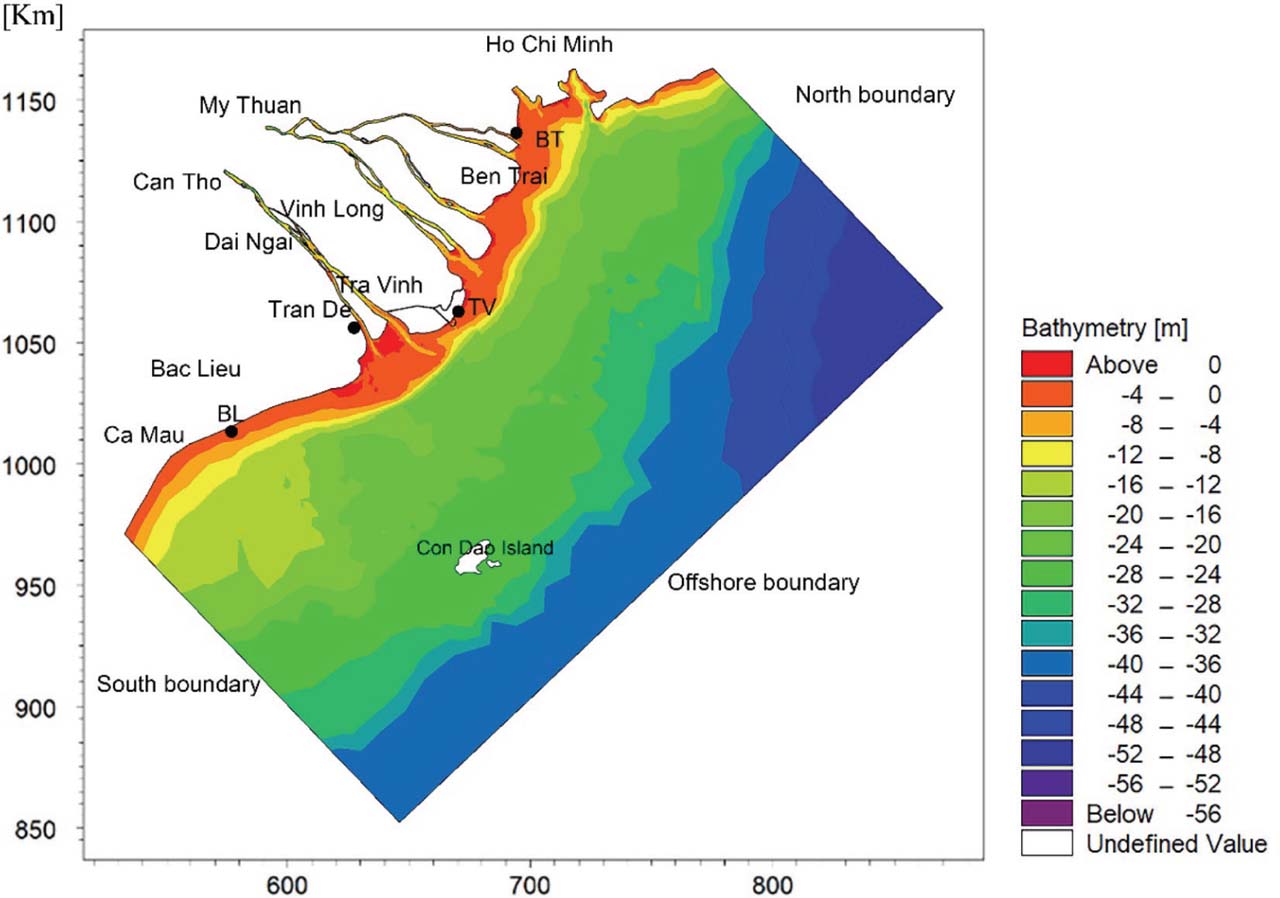
Figure 4
Coupled model domain bathymetry and boundaries (Trinh Dinh & Viet, 2026).
The discharges, salinity and suspended sediment concentration (SSC) data from the Tien River at My Thuan Station and the Hau River at Can Tho Station were applied for two upstream boundaries of Mike 21 HD model. The water levels, salinity, and SSC at Vung Tau (Ho Chi Minh City) and Ganh Hao station (Ca Mau Province) were used for the North and South boundaries. At the open-sea boundary, a constant value of 35 PSU for salinity and 0 for SSC was applied for the HD and MT models. For the SW model, wind forcing was represented by uniform wind shear stress at the water surface, based on wind data recorded at Con Dao Island at 3 hr intervals. Horizontal eddy viscosity was estimated using the Smagorinsky formulation with a constant Cs = 0.30. Offshore boundary applied using wave data from the Southern Institute of Water Resources Research. The North and South are parallel boundaries. The upstream boundaries at Can Tho and My Thuan are set as closed boundaries.
The coupled model was established and calibrated using field observation data from May 2004, and then subsequently validated against measurement datasets from September 2017 and June 2024. The statistical analysis indicates that the relative RMSE for free-surface water level, current speed, current direction, significant wave height, wave period, wave direction, and SSC are 4.4%, 18.5%, 23.1%, 18.0%, 16.7%, 20.9%, and 26.0%, respectively. The validation results indicate that the Manning number in the study area ranges from 40 m1/3 · s−1 to 65 m1/3 · s−1, and the Nikuradse roughness height ranges from 0.012 m to 0.096 m. The four layers of the bed of the Mike 21 MT model were suited to the geological conditions of the study area (Trinh Dinh & Viet, 2026). Unlike generic models, this framework incorporates a four-layer bed structure to explicitly account for vertical variations in bed density and erosion resistance. This validation process integrated synchronized monitoring of water level, depth-averaged current velocities, spectral wave parameters, and SSC. By coupling these multi-parametric measurements, the model effectively captures the non-linear feedback between wave-driven currents and sediment transport. This provides a robust computational platform for evaluating morphodynamical bed-level changes adjacent to both permeable and impermeable coastal structures on muddy shores. The previous study’s academic rigor is supported by a validation protocol using three distinct high-resolution field datasets (2004, 2017, and 2024), resulting in precise RMSE values for seven different physical parameters, including 26.0% RMSE for SSC.
Option 1 comprises a system of 17 shore-normal groynes, 9 in Long Huu and 8 groynes in Truong Long Hoa coasts, respectively. Each groyne has a length of 400 m, with an alongshore spacing of approximately 700–750 m. The first groyne, T1, is located about 500 m from the outlet of the Lang Sac (LS) distributary discharging into the Co Chien estuary (Fig. 5). The 10th groyne, T10, is located about 700 m from the mouth of the Quan Chanh Bo (QCB) canal. The groynes extend offshore into the active wave-breaking zone under low-water conditions, enabling effective interception of alongshore sediment transport generated by estuarine outflows. This configuration is expected to be most effective during ebb-dominated flow conditions, when combined discharge from the Tien River induces a strong southward-directed nearshore current.

Figure 5
Spatial layout and meshes of the coastal protection project on the Vinh Long province coast. (A). Option 1. (B). Option 2.
Option 2 consists of 17 detached breakwaters located approximately 400 m offshore. The detached breakwaters are 400 m in length, separated by gaps of 200 m. In Long Huu coast, there are 10 detached breakwaters and 2 terminal shore-normal groynes, each 400 m long, installed at the northern and southern ends of the detached breakwater system. The gaps between the tips of the terminal groynes and the adjacent breakwater segments are 100 m. In the Truong Long Hoa coast, there are eight detached breakwaters and two terminal shore-normal groynes, each 400 m long, installed at the northern and southern ends of the detached breakwater system. The gaps between the tips of the terminal groynes and the adjacent breakwater segments are also 100 m Fig. 5.
The groynes and detached breakwater segments will be simulated as the emerged breakwater in the study domain. The crest level of all groynes and detached breakwaters is +4.0 m (National Datum, VN-2000). The triangular mesh around the structures is shown in Fig. 5. The goyne and detached breakwater structures will be simulate by the dike structures as suggestions in the Mike 21/3 HD model manual (DHI, 2009). The Manning number range from 40 m1/3 · s−1 to 45 m1/3 · s−1 was applied for the HD model, and the Nikuradse roughness height range from 0.012 m to 0.026 m was used for SW model.
2.3. Modeling scenarios
This study focuses on the numerical simulation of hydrodynamics, wave transformation, and sediment transport to investigate the complex interactions between hydrodynamic forces and coastal protection structures. A primary goal is to analyze the morphological response of the seabed to these structures and evaluate the effectiveness of the countermeasures in coastal protection. To account for seasonal climatic variations, two distinct simulation cases were performed under the influence of NE and SW monsoonal winds, respectively. The six simulations allow for a comprehensive assessment of how varying wave climates and wind-driven currents dictate sediment flux and bed-level evolution around the proposed engineering interventions. A summary of modelling scenarios is shown in Table 1.
Table 1
Input data of the scenario simulations.
| Scenario | Option | Time | Discharge | Wind | Wave | SSC |
|---|---|---|---|---|---|---|
| 1 | 0 | 9/2017 | My Thuan, Can Tho | NE | 9/2017 | 9/2017 |
| 2 | 0 | 6/2024 | SW | 6/2024 | 6/2024 | |
| 3 | 1 | 9/2017 | NE | 9/2017 | 9/2017 | |
| 4 | 1 | 6/2024 | SW | 6/2024 | 6/2024 | |
| 5 | 2 | 9/2017 | NE | 9/2017 | 9/2017 | |
| 6 | 2 | 6/2024 | SW | 6/2024 | 6/2024 |
Each scenario was modeled based on specific monsoonal periods. The simulation in September 2017 for the NE monsoon and in June 2024 for the SW monsoon. The time step interval was set at 30 s as suggested by the MIKE 21/3 model.
Unlike generic sandy coast models that treat the seabed as a uniform layer of non-cohesive grains, this study utilizes the MIKE 21 MT module. A key technical differentiator is the implementation of a four-layer bed structure tailored to the geological conditions of Vinh Long. This structure explicitly accounts for vertical variations in bed density and erosion resistance. This is critical for capturing the behavior of fluid mud, which in the study area exhibits complex rheological properties including densities of 1050–1550 kg · m−3, yield stresses of 50–2700 Pa, and dynamic viscosities up to 1100 Pa (Nguyen & Le, 2023).
The simulations were not intended to model a full multi-decadal timeline but rather to capture seasonal extremes. Specifically, cases were performed for September 2017 (NE Monsoon) and June 2024 (SW Monsoon). These months were selected because they represent the most aggressive wave climates (NE) and the peak fluvial-tidal interactions (SW). For the morphological study, the Morphological Acceleration Factor is not used. The study focuses on a ‘process-based assessment’ of immediate structural impacts and ensuring the results represent high-fidelity, short-term process responses. These short-term results are highly relevant for coastal management as they identify ‘immediate sediment-trapping thresholds’ and ‘localized scouring risks’ at structural boundaries.
3. Results and discussion
3.1. Wave transformation characteristics
The results of spectral wave simulation of Option 0 for NE and SW winds are presented in Fig. 6, indicating that in the NE wind-induced wave direction offshore, the wave field tends to be perpendicular to the shoreline in the nearshore area. The nearshore of Long Huu coast has wave heights ranging from 0.5 m to 0.8 m, while the nearshore of Truong Long Hoa coast has significant wave heights ranging from 0.4 m to 0.7 m. The SW wind induced a southward wave direction offshore and refraction to a southeast direction in the nearshore, with the wave height ranging from 0.15 m to 0.3 m in the Truong Long Hoa coastal area and from 0.1 m to 0.2 m in the Long Huu coastal area. The above results indicate that the NE Monsoon is significantly more aggressive for this coastal stretch, producing wave heights roughly 3–5 times higher than those seen during the SW Monsoon. The waves behave differently as they approach the coast. NE waves straighten out to hit the shore head-on (perpendicular), while SW waves undergo refraction, shifting toward a Southeast direction in the nearshore zone. Under NE winds, Long Huu experiences the highest wave energy (up to 0.8 m). Under SW winds, Truong Long Hoa is slightly more exposed than Long Huu, though both remain relatively calm compared to the NE season.
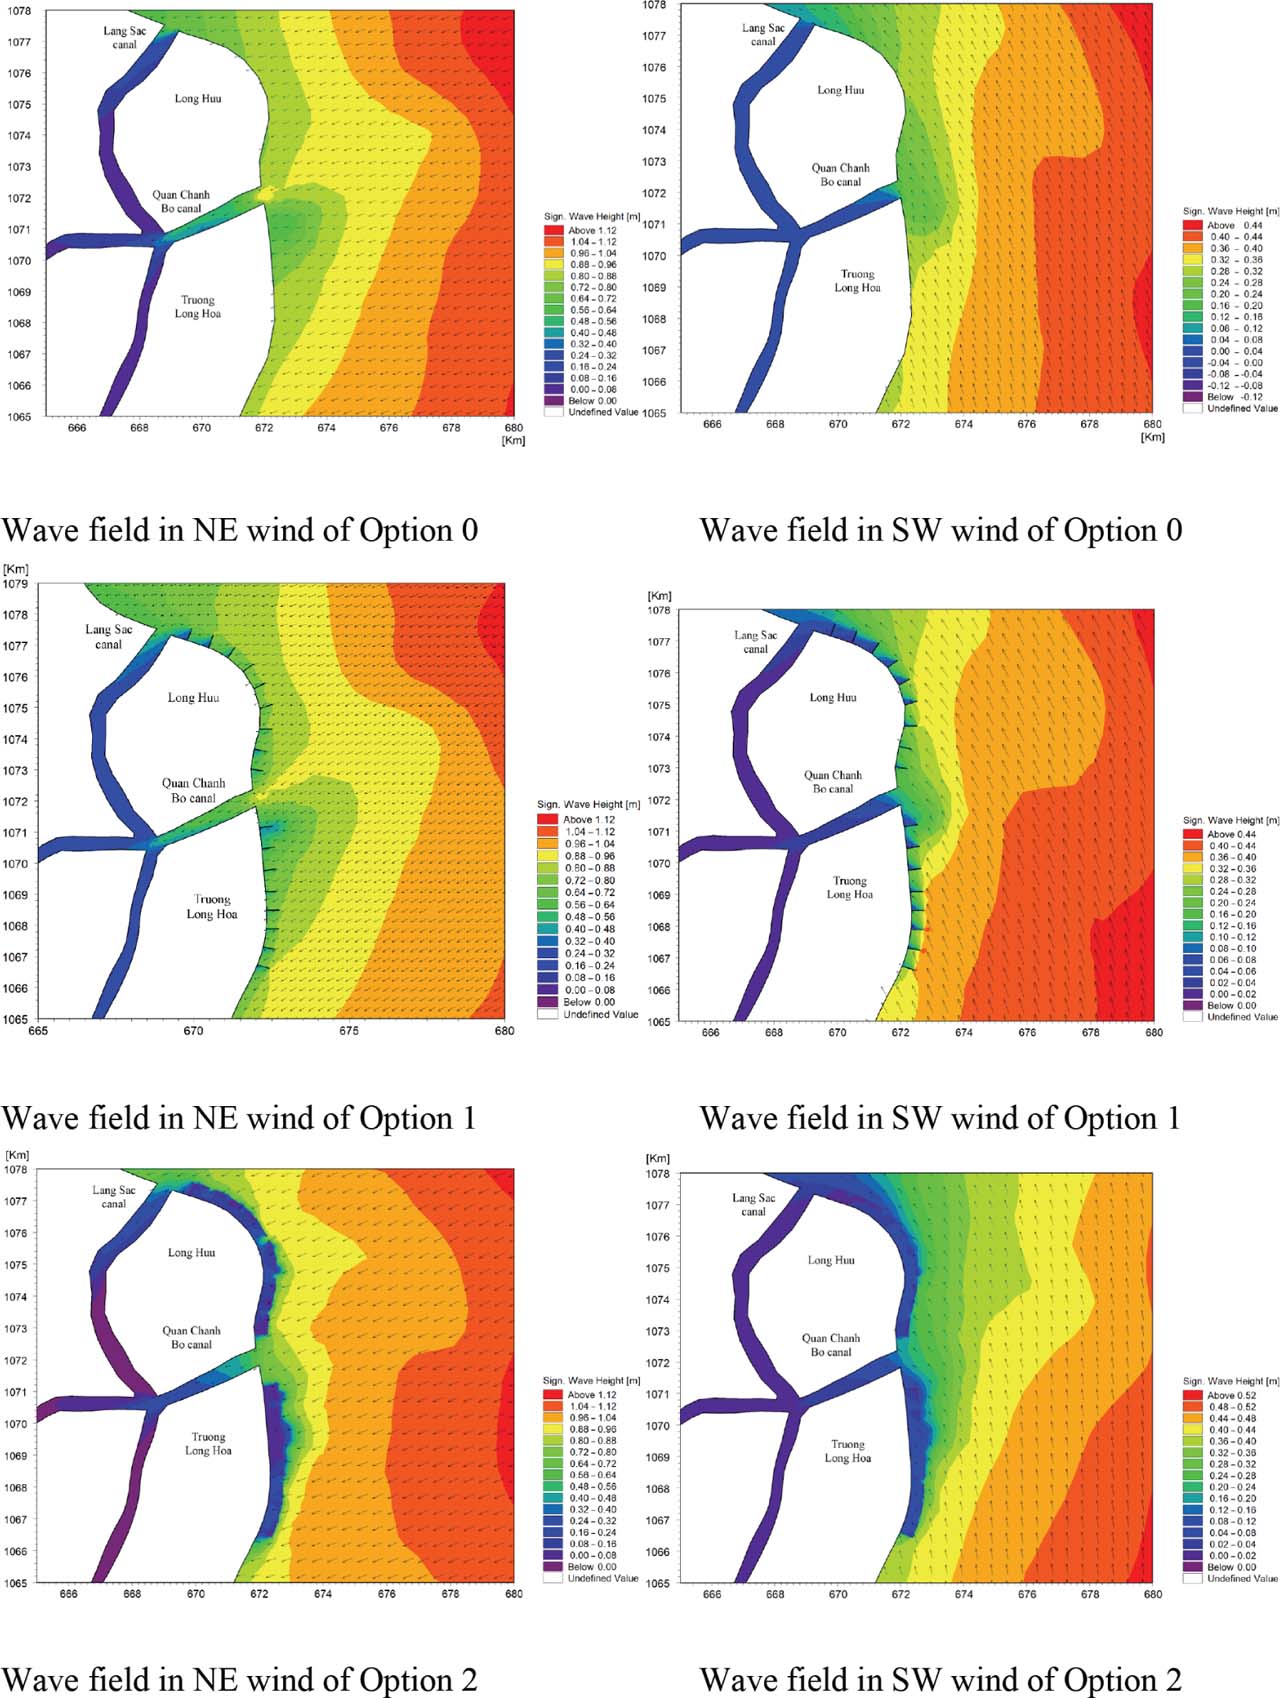
Figure 6
Wave field in NE wind and SW wind. NE, northeast; SW, southwest.
In Option 1, during the NE monsoon season, the simulated wave field indicates a significant reduction in energy as it interacts with the coastal defense structures. Wave height distribution within the area between the groynes typically ranges from 0.35 m to 0.45 m. As the waves propagate further landward, the nearshore zone experiences a marked decrease in wave action, with heights attenuated to between 0.15 m and 0.3 m. These results demonstrate that the groyne system effectively dissipates incident wave energy, providing a sheltered hydrodynamic environment along the shoreline. During the SW monsoon season, the incident wave field undergoes significant refraction, shifting from a southerly offshore direction toward a south-southeast orientation as it approaches the shoreline. Within the zone sheltered by the groynes, significant wave heights are observed to range between 0.16 m and 0.32 m. Further landward, the nearshore wave heights are markedly attenuated, falling below 0.1 m. These results quantify the efficiency of the groyne system in dissipating SW wave energy and provide a high degree of hydrodynamic stability for the immediate coastline (Fig. 6). It shows that the groyne system acts as an effective energy buffer for both seasons, but the SW monsoon experiences the most dramatic reduction in wave action. This is likely due to the combination of lower initial wave heights in the groyne zone and the energy-depleting effects of the refraction process.
For Option 2, under the impact of the NE monsoon, the simulated wave field behind the detached breakwater system exhibits a substantial reduction in energy. Significant wave heights in the lee of the structure typically range from 0.16 m to 0.24 m, with further attenuation to below 0.1 m within the immediate nearshore zone. These results quantify the high efficiency of the detached breakwater configuration in dissipating incident NE wave energy, providing a notably calmer hydrodynamic environment compared to baseline conditions. The segmented layout of the detached breakwaters effectively facilitates wave diffraction and energy scattering, significantly limiting wave penetration toward the shoreline. During the SW monsoon season, the simulated wave field behind the detached breakwater system similarly demonstrates a significant reduction in wave intensity. The region sheltered by the detached breakwaters remains highly quiescent, with wave heights ranging from only 0.08 m to 0.20 m and dropping below 0.05 m near the shore. These findings indicate that the detached breakwater system effectively neutralizes SW wave action, ensuring high hydrodynamic stability along the protected coastal reach (Fig. 6).
The numerical results indicate that both engineering interventions significantly attenuate wave height and current velocities relative to the baseline. Option 1 reduced the significant wave height from 6.1% to 34.0%, an average of 16.1%, while Option 2 reduced significant wave height from 23.6% to 76.5%, an average of 61.9%. On average, Option 2 demonstrated a 54.0% higher wave height reduction efficiency compared to Option 1 (an average reduction of 61.9% for Option 2 vs 16.1% for Option 1 relative to baseline conditions). This superior performance is attributed to the diffraction and energy dissipation mechanisms of the detached breakwater system; specifically, wave transmission through the gaps in the breakwater system is significantly lower than the penetration observed between the groyne fields (Fig. 7). The results highlight that wave penetration between groyne fields is relatively high. Groynes are shore-perpendicular; they are excellent at trapping sediments but allow waves to travel largely unimpeded into the ‘cells’ between them. In contrast, Option 2 uses shore-parallel segments. As waves hit these barriers, they are forced to diffract around the edges. This process re-orients and spreads the wave energy over a wider area, causing it to dissipate significantly before it can approach the beach. The simulation shows that wave transmission through the gaps in the detached breakwater system is significantly lower than the penetration seen in Option 1. This is likely due to the interference patterns created by the segmented layout. The breakwaters act as a porous barrier that ‘shatters’ the incoming wave front, whereas the groyne fields offer a more direct path for waves to reach the inner coastal zone.

Figure 7
Distribution of the maximum wave height at 19 data points.
Compared to previous studies, the detached breakwater system investigated herein exhibits superior wave attenuation (averaging 61.9%) relative to the 50% reduction found by Tu (2022) and consistency with 50%–75% from the physical modeling of Hollow Triangle Breakwaters by Tu (2022). The superior wave attenuation of the detached breakwater system (average 61.9% reduction) is not merely a result of blocking energy, but of diffraction and energy scattering. As incident waves hit the shore-parallel segments, the energy is forced to diffract around the structural edges. This process re-orients and spreads the wave energy over a wider area, causing it to dissipate significantly before reaching the shoreline. Unlike the groyne system (Option 1), where waves travel largely unimpeded into the ‘cells’, the segmented breakwater layout acts as a porous barrier that ‘shatters’ the incoming wave front through complex interference patterns.
3.2. Hydridynamics features
The spatial-temporal variations of tidal current fields under monsoonal forcing are presented in integrated multi-panel matrices (Figs 8 and 9). This layout enables a synchronized side-by-side comparison of flood and ebb current velocities across the baseline (Option 0) and both structural interventions (Options 1 and 2), providing a clearer visual synthesis of how each design modulates tidal momentum in the nearshore zone.

Figure 8
Comparison of flood and ebb tidal current fields across the three modeling scenarios (Option 0, Option 1, and Option 2) under NE monsoon forcing. (A). Flood tide current field of Option 0. (B). Ebb tide current field of Option 0. (C). Flood tide current field of Option 1. (D). Ebb tide current field of Option 1. (E). Flood tide current field of Option 2. (F). Ebb tide current field of Option 2. NE, northeast.
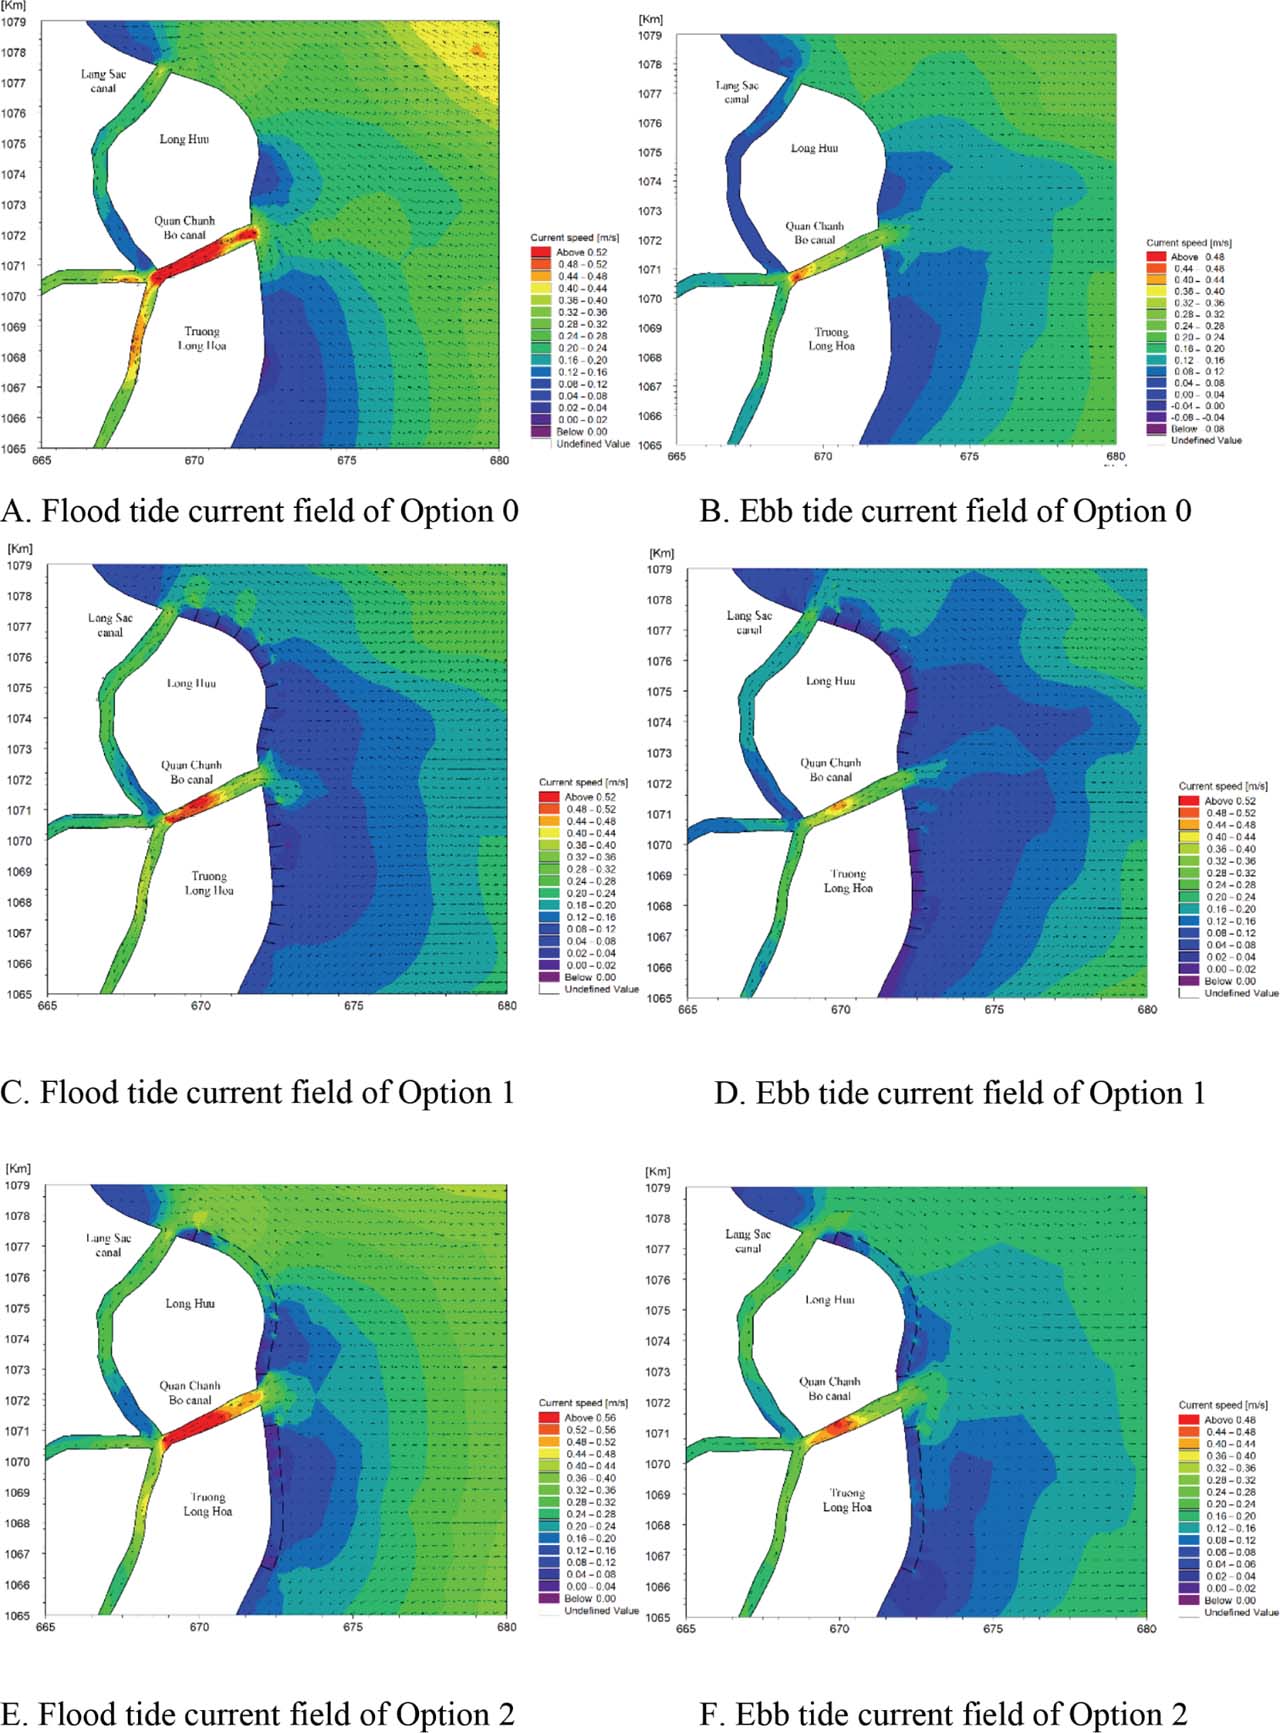
Figure 9
Comparison of flood and ebb tidal current fields across the three modeling scenarios (Option 0, Option 1, and Option 2) under SW monsoon forcing. (A). Flood tide current field of Option 0. (B). Ebb tide current field of Option 0. (C). Flood tide current field of Option 1. (D). Ebb tide current field of Option 1. (E). Flood tide current field of Option 2. (F). Ebb tide current field of Option 2. SW, southwest.
The detached breakwater system in Option 2 appears to be more effective than the groynes system (Option 1) previously discussed, particularly in how it uses diffraction to ‘scatter’ energy before it even reaches the mid-zone. The SW monsoon wave field, being more easily neutralized by this configuration, results in the most stable coastal conditions.
In the Option 0 baseline scenario, which simulates natural conditions during the NE monsoon, the flood tidal current speed near the coast shows a significant reduction compared to the offshore area. Particularly, in the coastal area between the QCB canal and the LS canal, the maximum current only reaches 0.12 m · s−1. The current south of the QCB canal has a higher velocity, but still only reaches about 0.2 m · s−1. As the tidal current moves into the river mouths, the velocity increases significantly, reaching 0.4 m · s−1 (Fig. 8A).
During low tide, the coastal current decreases significantly over a large area both north and south of the QCB estuary, with velocities ranging from 0.02 m · s−1 to 0.08 m · s−1. Meanwhile, the low-tide current in the QCB and LS channels is quite large, with a maximum velocity of 0.5 m · s−1 (Fig. 8B). Under natural conditions (Option 0), the NE monsoon wave field (as discussed in previous options) would interact with a low-velocity coastal current field. The primary hydrodynamic energy at the shoreline is driven more by wave action than by tidal currents, except near the mouths of the QCB and LS canals where the current speeds are 2–4 times higher than the surrounding waters.
The flood tidal flow pattern for Option 1 shows that the groyne system has blocked most of the nearshore flow in the NE monsoon season, and the impact of the Co Chien estuary flow on the nearshore area of Long Huu is negligible. The flood tide flow velocity in the area between the groynes ranges from 0.04 m · s−1 to 0.1 m · s−1, and the northern area has a very small flow compared to the southern. Conversely, the ebb tidal flow in the southern area was smaller than in the northern area, and the ebb tidal flow between the groynes was also very small, ranging from 0.04 m · s−1 to 0.08 m · s−1.
Similar to the flood tide flow, the ebb tide flow in the Co Chien estuary had little influence on the flow between the groynes (Figs 8C and 8D). These results indicate that during flood tide the northern area is much calmer than the southern area. This suggests the flood tide (typically moving northward in this region during the NE monsoon) is being hindered by the structures; during ebb tide, the pattern flips, with the southern area exhibiting smaller flows than the northern area.
Under the NE monsoon forcing in Option 2, the flood tidal current exhibits a clear southward intensification. Within the Long Huu coastal sector, the detached breakwater system induces significant hydrodynamic attenuation, reducing current velocities to a range of 0.06–0.1 m · s−1. However, a distinct nearshore jet is observed behind the breakwaters in the southern Truong Long Hoa area, where velocity magnitudes remain relatively high, ranging from 0.12 m · s−1 to 0.2 m · s−1 (Fig. 8E). During the ebb phase, the flow field is dominated by a southward-directed current that surpasses the flood-phase magnitude. In the Long Huu region, current speeds behind the breakwaters fluctuate between 0.06 m · s−1 and 0.2 m · s−1, whereas the Truong Long Hoa sector remains more quiescent, with velocities attenuated to 0.04–0.10 m · s−1 (Fig. 8F).
A critical finding in the flood tide phase is the development of a nearshore jet in the southern Truong Long Hoa area. Unlike the groynes (Option 1), which block flow entirely, the detached breakwaters allow water to pass behind them. The funneling of water through the segments, combined with the southward forcing of the NE monsoon, creates a localized acceleration (0.2 m · s−1). This ‘jet’ could potentially lead to localized erosion or ‘scouring’ at the southern end of the project area.
During the SW monsoon season, Option 0 indicates that the flood tide approaches the QCB and LS river mouths with a velocity of over 0.4 m · s−1. In the area north of the QCB river mouth, the flood tide velocity is quite small, only fluctuating between 0.06 m · s−1 and 0.1 m · s−1, while in the area south of the QCB mouth, the flow velocity decreases drastically, reaching <0.05 m · s−1 (Fig. 9A). For the ebb tide, the flow from QCB canal reaches approximately 0.3 m · s−1, higher than that of LS canal, which is only about 0.1 m · s−1. Along the coast, the flow tends to decrease from north to south. However, the intensity of the flow is higher than during the rising tide (Fig. 9B). This is understandable because the receding tide, combined with the flow from the Ham Luong River, increases the inshore flow in the study area. A major distinction for the SW monsoon is the influence of the Ham Luong River. During the ebb tide, the river’s discharge combines with the receding tidal flow. This synergy increases the inshore flow intensity compared to the flood tide. This is a classic example of river-induced current reinforcement, where the seasonal freshwater pulse from the Mekong system (which peaks toward the end of the SW monsoon) strengthens the southward-directed coastal currents. While the river mouths remain active, the area south of the QCB mouth becomes nearly stagnant during the flood tide (<0.05 m · s−1). This suggests that during the SW monsoon, the southern coastal reach is a ‘hydrodynamic dead zone’ which would likely lead to significant fine sediment settling (mud/siltation) under natural conditions.
In the SW monsoon, the tidal current patterns exhibit a distinct spatial distribution influenced by the groyne system of Option 1. During the flood tide, current velocities between the groyne system fluctuate between 0.08 m · s−1 and 0.12 m · s−1. The central reach of the Long Huu coastline serves as a zone of significant hydrodynamic attenuation, where velocities drop to their minimum, generally remaining below 0.05 m · s−1. In this phase, a clear gradient is observed, with current magnitudes tending to weaken toward the north compared to the southern section of the study area (Fig. 9C). Conversely, the ebb tide is characterized by a general decreasing trend in velocity across the entire domain. Current speeds between the groyne system are further reduced, ranging from only 0.04 m · s−1 to 0.08 m · s−1. During this phase, the spatial trend reverses, with the ebb current toward the northern region exhibiting greater strength than in the southern part (Fig. 9D).
One of the most interesting findings in the SW monsoon is that the ‘strength’ of the current shifts across the study area: during the flood tide, energy is concentrated in the South, with flow weakening as it moves North. This aligns with the incident direction of the SW monsoon; during the ebb tide, the trend flips, the North becomes the more energetic zone (though still quite weak), while the South reaches its most quiescent state. The central reach of the Long Huu coastline experiences the most dramatic attenuation, with speeds falling below 0.05 m · s−1 during the flood tide. In fluid dynamics, velocities this low are often below the threshold required to keep fine sediments (silts and clays) in suspension. This confirms that the area is highly conducive to sediment deposition. Compared to the baseline (Option 0), where SW tidal currents reached larger than 0.4 m · s−1 at the river mouths, the groynes have reduced the nearshore flow by approximately 75%–90%. This suggests the groynes act as a physical ‘brake’ on the tidal momentum. These findings suggest that the groynes provide a consistent protective ‘buffer’ year-round, successfully neutralizing the seasonal variations of the monsoon.
During the SW monsoon season, the tidal current patterns under Option 2 exhibit a spatial distribution similar to the NE monsoon phase, albeit with lower overall magnitudes. During the flood phase, the detached breakwater system facilitates significant hydrodynamic damping along the Long Huu coastline, where current velocities are reduced to 0.04–0.1 m · s−1. Conversely, a localized nearshore current persists behind the breakwaters south of Truong Long Hoa, with velocities reaching up to 0.2 m · s−1 (Fig. 9E). The ebb phase reveals a distinct tidal asymmetry, as the northward-directed currents surpass the flood-phase intensities. Behind the breakwater system in the Long Huu sector, current velocities range from 0.08 m · s−1 to 0.24 m · s−1, whereas the Truong Long Hoa area remains relatively quiescent with velocities between 0.04 m · s−1 and 0.12 m · s−1 (Fig. 9F). The simulation results indicate the seasonal asymmetry and directional shift; the most striking difference between the monsoons under Option 2 is the direction of the dominant ebb current. During the NE monsoon, the ebb flow was southward-directed, surpassing the flood magnitude, while in the SW monsoon, the ebb flow is northward-directed, again surpassing the flood intensities (0.24 m · s−1 vs 0.10 m · s−1). This confirms that the detached breakwater system does not block the seasonal reversal of regional currents but rather modulates their intensity. The persistence of the Southern ‘Jet’ similar to the NE monsoon, the SW monsoon exhibits a localized nearshore current behind the breakwaters in the southern Truong Long Hoa area (0.2 m · s−1). The fact that this velocity remains consistent (0.2 m · s−1) across both seasons suggests it is a structural artifact—water is being forced through the breakwater gaps or around the southern terminus of the system regardless of the seasonal wind forcing.
The results in Fig. 9 suggest that while the detached breakwaters dissipate wave energy, they provide limited resistance to tide-driven nearshore currents. The observed velocity gradients indicate that the current configuration does not sufficiently obstruct the longshore tidal flux, potentially maintaining higher-than-expected bed shear stress in specific coastal segments.
The SW monsoon appears to be the ‘critical season’ for Option 2. While it offers the highest level of protection from waves (quiescent nearshore), it also generates the highest current velocities (0.24 m · s−1). This combination suggests that Option 2 is designed for dynamic stability; it protects the shoreline from the destructive force of breaking waves while utilizing the tide-driven longshore currents to flush the ‘lee’ of the breakwaters, potentially preventing the excessive siltation that can occur in more enclosed defense systems.
The implementation of coastal structures in both scenarios significantly altered the nearshore hydrodynamic regime, leading to a marked attenuation of peak current velocities compared to the baseline conditions (Option 0). For the groyne system in Option 1, the maximum flow velocity decreased by 53%–85.8%, representing an area-wide mean reduction of 73%. Similarly, the detached breakwater configuration in Option 2 resulted in a 50.0%–89.0% reduction in peak velocity, with a mean reduction of 69.8%. These results demonstrate that while both interventions are effective at dampening ambient energy, the groyne field (Option 1) provides a slightly higher average reduction in nearshore current speeds across the study domain (Fig. 10).
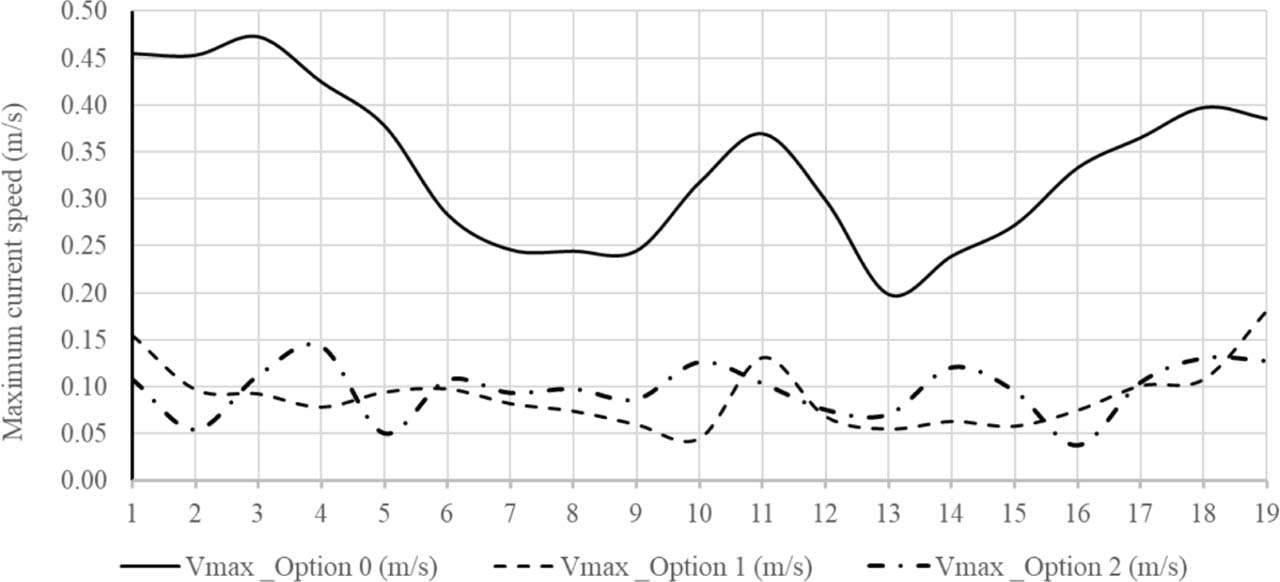
Figure 10
Distribution of the maximum current speed at 19 data points.
The above results indicate that the groynes act as a physical ‘brake’, blocking nearshore flow and reducing peak velocities by an area-wide mean of 73%. However, this obstruction forces water to accelerate around the structural heads—specifically at G1, G9, G10, and G17—leading to localized flow contraction and turbulence that drives high-intensity scouring. The detached breakwaters are hydrodynamically ‘leaky’. The segmented layout facilitates tidal-current exchange but induces a ‘funneling effect’ through the 200 m gaps. This creates ‘nearshore jets’ with localized accelerations reaching 0.2–0.24 m · s−1. These jets represent a structural artifact where tidal energy is concentrated into narrow streams, maintaining the seabed clear of sediment through persistent high velocity.
3.3. Morphodynamical responses to coastal protection structures
A comparison of the bed thickness variations between natural conditions (Option 0) and coastal protection (Option 1) under the same hydrodynamic, wave, and sediment forcing is plotted in Fig. 11 indicates that the baseline (Option 0) undergoes nearshore erosion exceeding 10.0 cm. Overall, Option 0 exhibits a domain-wide mean bed-level change of −8.0 cm to −10.0 cm, with an erosion-accretion area ratio of ∼90:10, indicating a heavily erosion-dominated coastal profile. Conversely, Option 1 exhibits a depositional trend with magnitudes ranging from 1.0 cm to 2.0 cm. This transitions the domain to an accretion-dominated regime, yielding an erosion-accretion area ratio of ∼25:75 and a net domain-wide mean bed-level change of +1.0 cm to −2.0 cm. The groyne system induces localized high-intensity scour at the tips of G1, G9, G10, and G17. This is not merely a phenomenon of proximity but a result of flow contraction. As the shore-normal structures block tidal momentum (reducing nearshore flow by up to 73%–90%), the volume of water is forced to accelerate around the structure’s head. This acceleration, combined with increased turbulence at the structural boundaries, elevates bed shear stress beyond the erosion threshold of the cohesive mud, preventing the sediment capture seen in the mid-cell zones and defining the maximum localized scour depth across the site. At the same time, significant accretion is observed within the nearshore zones between the LS estuary and G1, as well as between G10 and G11. The groyne system is the most aggressive at reversing the natural erosional trend. By reducing the nearshore current to <0.1 m · s−1 (as seen in your previous data), it allows for a depositional magnitude of 1.0–2.0 cm. The areas between the LS estuary and G1 act as primary sediment traps. Option 1 creates low-energy environments (velocities often <0.05 m · s−1) that fall below the critical threshold required to keep fine sediments in suspension, leading to aggressive accretion (avg 1.0 cm). The high-intensity scour at the tips of G1, G9, G10, and G17 is a result of flow contraction and turbulence as the current is forced around the head of the structures.

Figure 11
Bed thickness change and maximum bed thickness changes at 19 data points. (A). Option 0. (B). Option 1. (C). Option 2. (D). Maximum bed thickness changes at 19 data points.
A comparison of the bed thickness variations between the natural condition (Option 0) and Option 2 is presented in Fig. 11 shows a more spatially uniform depositional response. Option 2 shifts the coastal system to an accretion-dominant state with an erosion-accretion area ratio of ∼15:85 and a net domain-wide mean bed-level change of +0.3 cm to 0.5 cm. Unlike Option 1, Option 2 avoids deep localized head scour pits, displaying only minor, distributed scour near the structure edges. The results indicate that the detached breakwater system in Option 2 promotes a depositional trend in the lee of the structures, with accretion magnitudes of approximately 0.5 cm. Significant sediment accumulation is observed in the nearshore zones sheltered by detached breakwaters D6, D7, D8, D12, D13, and D14. Option 2, being less resistive to longshore tidal flux, maintains higher bed shear stress in the lee of the structures. While this results in lower total accretion (avg 0.3 cm), it promotes uniform stability by utilizing tide-driven currents to ‘flush’ the protected area, preventing the excessive and stagnant siltation that often destabilizes more enclosed defense systems. Conversely, the system induces localized, high-intensity scouring at the groyne heads (at G1, G2, G3 and G4) and within the gap between D9 and D10.
Unlike groynes, detached breakwaters allow continued circulation, which explains the high scouring between D9 and D10. The segmented layout creates a ‘funneling effect’ where water is forced through 200 m openings. The simulation reveals the formation of ‘nearshore jets’ with velocities reaching 0.2–0.24 m · s−1. These jets represent a structural artifact where tidal energy is concentrated into narrow streams, ‘jetting’ through the openings and keeping the seabed clear of sediment through persistent high velocity.
Notably, severe erosion occurs at groynes G1 and G3, driven by the fluvial discharge from the LS and QCB canals, which acts as a high-velocity hydraulic force. During the SW monsoon, a critical synergy occurs: the river’s seasonal freshwater pulse from the Ham Luong River combines with the receding (ebb) tidal flow. This ‘river-induced current reinforcement’ increases inshore flow intensity, creating a powerful southward-directed flux that interacts with the structures to intensify scouring at the canal-adjacent boundaries.
The detached breakwater system provides a more ‘refined’ morphological response. The accretion magnitude (0.5 cm) is significantly lower than Option 1, which correlates with the ‘leaky’ hydrodynamic nature of breakwaters that maintain higher bed shear stress. The zones behind D6–D8 and D12–D14 are likely forming salients—localized sediment bulges created by wave diffraction and reduced energy. The ‘high-intensity scouring’ in the gap between D9 and D10 suggests that tidal currents are being ‘jetted’ through this opening, keeping the bed clear of sediment.
The coastal protection structures in both options have significantly altered the morphology of the studied coastal area. The erosion trend under natural conditions has been remedied, and alluvial deposits have begun to form at the toe of the groynes in Option 1 and behind the detached breakwaters in Option 2. Extraction of results at 19 points showed that the groyne system in Option 1 reduced erosion by 0.3–2.2 cm, averaging 1.0 cm. In Option 2, sedimentation occurred behind the breakwaters at levels ranging from 0.18 cm to 0.52 cm, averaging 0.3 cm. The above results indicate that Option 2 has a small but uniform level of sedimentation along the entire protected coastline (Fig. 11D).
The efficiency of the two structural options is shaped by the unique settling and suspension thresholds of fine-grained sediments (median grain size of ∼0.003 mm). In Option 1, the groyne system on a sandy coast primarily traps bedload transport. In this muddy environment, the groynes act as a physical ‘brake’ on tidal momentum, reducing velocities to below 0.05 m · s−1. In fluid dynamics, these velocities fall below the critical threshold required to keep fine silts and clays in suspension, effectively turning the groyne ‘cells’ into high-efficiency sediment traps for cohesive particles. While Option 2 presents a unique risk for muddy coasts is excessive: stagnant siltation or the formation of thick fluid mud layers can destabilize engineering works. The study distinguishes Option 2 by highlighting its ‘leaky’ hydrodynamic nature. While it attenuates 61.9% of wave energy, it maintains higher bed shear stress than the groyne system. This is a strategic advantage for muddy coasts, as it utilizes tide-driven currents to flush the area behind the breakwaters, preventing the detrimental accumulation of stagnant mud.
In contrast, the domain-wide mean bed level change, the erosion-accretion area ratio, and the maximum scour depth are presented in Table 2.
Table 2
Quantitative morphodynamic metrics across simulated scenarios.
| Metric | Option 0 (baseline) | Option 1 (groynes) | Option 2 (breakwaters) |
|---|---|---|---|
| Erosion-accretion area ratio | ∼90:10 (erosion dominant) | ∼25:75 (accretion dominant) | ∼15:85 (accretion dominant) |
| Domain-wide mean bed-level change | −8.0 cm to −10.0 cm (net erosion) | 6/2024 | +0.3 to +0.5 cm (net accretion) |
| Maximum scour depth & behavior | Broad, generalized nearshore erosion >10.0 cm | 9/2017 | Minor, distributed edge scour near structure ends |
Although the numerical simulations resolve short-term, seasonal monsoonal events resulting in centimeter-scale vertical bed-level changes (Δz from −1.0 cm to −10.0 cm), these vertical adjustments directly govern decadal, meters-per-year horizontal shoreline retreat (Δx from 10 m · year−1 to 30 m · year−1) observed across the study area. In cohesive muddy environments, vertical bed erosion in the shallow nearshore increases water depth at the marsh or mangrove toe, reducing bottom friction and allowing higher wave energy to reach the upper intertidal slope. Using a generalized profile equilibrium relationship (Δx = Δz/tanβ), where β represents the low-gradient nearshore bed slope of ∼0.001–0.005, a vertical bed erosion of just 5.0 cm (0.05 m) translates to a horizontal equilibrium retreat of 10–50 m. By arresting vertical seabed degradation and inducing net vertical accretion +1.0 cm to 2.0 cm), both Options 1 and 2 effectively flatten the nearshore profile, attenuate incident wave energy before it reaches the coast, and prevent slope-failure-driven horizontal retreat.
To rigorously evaluate the localized scour dynamics observed in Fig. 11, the bed shear stress (τb) generated by local flow fields was evaluated against the critical erosion shear stress τce of the cohesive mud deposit τce ≈ 0.15–0.20 N · m−2 for the top fluid-mud layer with median grain size d50 = 0.003 mm.
In Option 1 (groynes), blocking up to 73%–90% of nearshore tidal momentum forces flow contraction around the structure tips (G1, G9, G10, and G17). This localized flow acceleration raises bed shear stress to peak values of τb ≈ 0.85–1.20 N · m−2, exceeding the critical erosion threshold τce by 4–6 times. According to the Partheniades erosion formulation applied in the MIKE 21 MT module, this excess shear stress drives localized erosion rates up to 0.05 kg · m−2 · s−1, culminating in maximum local scour depths exceeding 10.6 cm concentrated within a 50.0 m radius of the structure tips.
Conversely, Option 2 (detached breakwaters) distributes shear stresses more evenly. While the 200 m inter-structure gaps create ‘funneling jets’ with current speeds of 0.20–0.24 m · s−1, the resulting bed shear stress peaks at τb ≈ 0.25–0.38 N · m−2. Because τb exceeds τce only slightly, the magnitude of scour development is restricted to minor, shallow depressions (3.0–4.0 cm). This prevents high-intensity scour holes while maintaining sufficient tidal exchange to avoid fluid mud stagnation.
4. Conclusions
This study utilized a validated coupled numerical framework to evaluate the morphodynamical effectiveness of shore-normal groynes and detached breakwaters along the muddy coastline of Vinh Long Province. The investigation leads to the following conclusions:
(1) Both engineering interventions successfully transition the nearshore environment from a chronic erosional state (natural retreat exceeding 10.0 cm) to a depositional regime. While both systems effectively dampen ambient energy, they utilize different physical mechanisms to achieve stability.
(2) The groyne system (Option 1) provides superior current velocity reduction (average 73%), facilitating the greatest total sediment accretion (average 1.0 cm). Conversely, the detached breakwater system (Option 2) achieves significantly higher wave attenuation (average 61.9%)—approximately 54% more effectively than groynes—while promoting a more uniform sedimentation pattern (average 0.3 cm).
(3) To support sustainable coastal management in the MRD, the selection of a protection scheme should be dictated by specific morphological and engineering priorities:
- Groynes (Option 1) are proposed for scenarios prioritizing aggressive sediment capture and rapid recovery of the bed level. This scheme is optimal for coastal sectors where the primary objective is to intercept current-driven alongshore sediment transport.
- Detached Breakwaters (Option 2) are recommended for scenarios prioritizing maximum wave attenuation and uniform morphological stability. This scheme is ideal for areas where long-term dynamic stability is preferred over total accretion volume, as its ‘leaky’ hydrodynamic nature prevents the dramatic ‘sawtooth’ shoreline artifacts common in groyne fields.
(4) Regardless of the chosen scheme, designers must incorporate mitigation strategies for localized scouring at structural tips and gaps. These erosional artifacts are intensified by the synergy between fluvial discharge from the LS to QCB canals and receding tidal flows, which must be explicitly considered to ensure the long-term integrity of hard engineering in deltaic environments.
Acknowledgements
This research is funded by the Ministry of Education and Training under grant number B2024.XDA.05.