
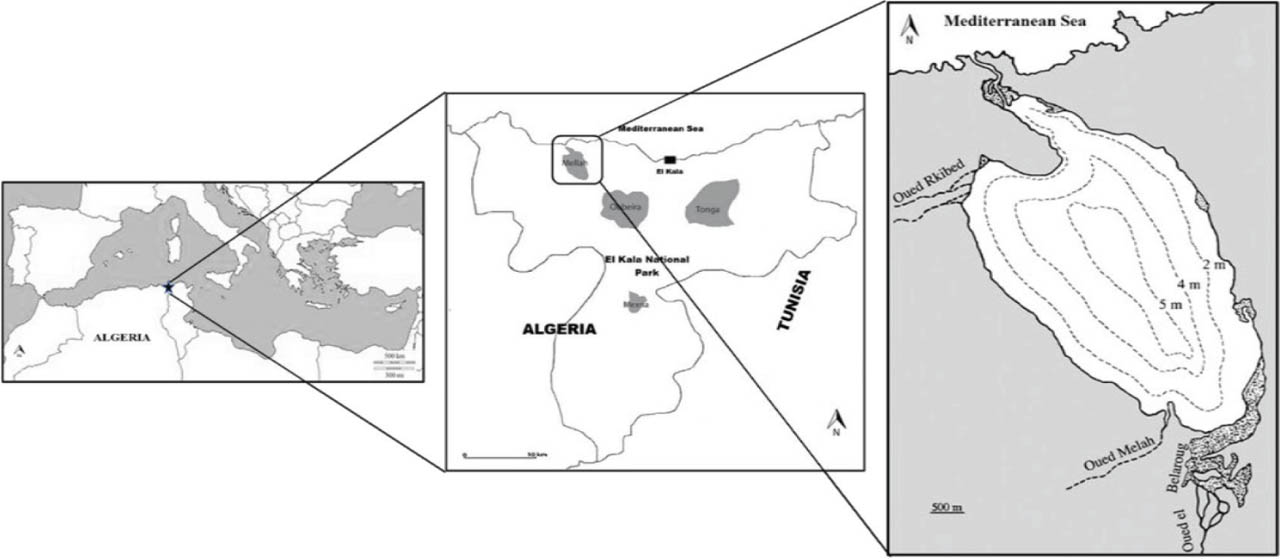
Figure 1
Location of El Mellah Lagoon within El Kala National Park.
Table 1
Sampling structure and collection methods by species.
| Species | n | Sampling period | Collection methods |
|---|---|---|---|
| A. anguilla | 103 | January–May | Fyke nets |
| M. cephalus | 122 | July–October | Fish weir |
| C. auratus | 68 | July–September | Gillnets |
| C. glaucum | 448 | January–December | Hand collection |
| R. decussatus | 451 | January–December | Hand collection |
Table 2
Summary statistics on measured variables of fish from El Mellah lagoon.
| Species | n | TL (cm) | W (g) | ||||||
|---|---|---|---|---|---|---|---|---|---|
| Range | Mean | SD | Median | Range | Mean | SD | Median | ||
| A. anguilla | 103 | 28.2–66 | 43.72 | 7.65 | 43 | 34.72–484.27 | 146.59 | 85.80 | 122.2 |
| M. cephalus | 122 | 24.1–55.9 | 42.34 | 4.93 | 42.6 | 123.54–1820.5 | 817.76 | 276.91 | 785.2 |
| C. auratus | 68 | 17.7–34.4 | 26.21 | 3.36 | 25.9 | 73.1–325.2 | 177.78 | 76.22 | 181.2 |
Table 3
Summary statistics on measured variables of bivalves from El Mellah lagoon.
| Species | n | SL (mm) | W (g) | ||||||
|---|---|---|---|---|---|---|---|---|---|
| Range | Mean | SD | Median | Range | Mean | SD | Median | ||
| C. glaucum | 448 | 19–47 | 33.21 | 4.28 | 33 | 2.24–33.49 | 13.45 | 4.68 | 13.27 |
| R. decussatus | 451 | 30–66 | 45.65 | 7.3 | 46 | 5.34–54.52 | 19.09 | 9.37 | 18.03 |
Table 4
LWR parameters of studied species.
| Species | n | Equation | a | 95% CI a | SE b | 95% CI b | p (regression) | R2 | p (t-test, b = 3) | Growth pattern |
|---|---|---|---|---|---|---|---|---|---|---|
| A. anguilla | 103 | log W = −3.0084 + 3.1223 log TL | 0.0010 | 0.0004–0.0026 | 0.1292 | 2.866–3.379 | <0.0001 | 0.853 | > 0.05 | I |
| M. cephalus | 122 | log W = −1.6900 + 2.8191log TL | 0.0204 | 0.0104–0.0400 | 0.0908 | 2.639–2.999 | <0.0001 | 0.889 | <0.05 | A – |
| C. auratus | 68 | log W = −2.3175 + 3.1984 log TL | 0.0048 | 0.0015–0.0155 | 0.1792 | 2.841–3.556 | <0.0001 | 0.828 | >0.05 | I |
| C. glaucum | 448 | log W = −2.7871 + 2.5628 log SL | 0.0016 | 0.0012–0.0023 | 0.0469 | 2.471–2.655 | <0.0001 | 0.870 | <0.05 | A – |
| R. decussatus | 451 | Log W = −3.7991 + 3.0399 log SL | 0.0002 | 0.0001–0.0002 | 0.0271 | 2.987–3.093 | <0.0001 | 0.966 | >0.05 | I |